Greenhouse gas emissions from transport in 2024
Published 14 July 2026

© Crown copyright 2026
This publication is licensed under the terms of the Open Government Licence v3.0 except where otherwise stated. To view this licence, visit nationalarchives.gov.uk/doc/open-government-licence/version/3 or write to the Information Policy Team, The National Archives, Kew, London TW9 4DU, or email: psi@nationalarchives.gov.uk.
Where we have identified any third party copyright information you will need to obtain permission from the copyright holders concerned.
This publication is available at https://www.gov.uk/government/statistics/transport-and-environment-statistics-2024--2/greenhouse-gas-emissions-from-transport-in-2024
1. About this release
This release presents statistics on greenhouse gas (GHG) emissions from transport. GHG data is sourced from accredited official statistics[footnote 1] published by the Department for Energy Security and Net Zero (DESNZ). For more information, see the About these statistics section.
Data on GHG emissions from transport can be found on the energy and environment data tables page.
In 2020 transport was significantly impacted by the COVID-19 pandemic, as people were instructed to stay at home as much as possible. Restrictions were eased in 2021, and the last restrictions removed in 2022. Transport emissions have been rising steadily since 2020, however the rate of increase has slowed year on year, and 2024 emissions from domestic transport and international aviation and shipping are 8% lower compared to 2019 levels. This impact should be considered when interpreting these statistics.
Carbon dioxide equivalent (CO2e)
Different GHGs have different impacts on the greenhouse gas effect. All gaseous emissions are converted to the equivalent amount of CO2 needed to create the same effect and presented in this report as CO2e.
2. Main findings
In 2024, domestic transport accounted for 30% of total domestic greenhouse gas emissions in the United Kingdom (UK).
Domestic transport was responsible for 110.4 MtCO2e (million tonnes of carbon dioxide equivalent), similar to 2023 (0.2% increase from 110.2 MtCO2e in 2023). This was a decrease of 10% compared to pre-pandemic levels in 2019.
Domestic transport emissions have decreased by 11% since 1990, whilst total UK domestic emissions decreased by 53% over the same period.
3. Domestic greenhouse gas emissions for transport and other sectors
Chart 1: Domestic greenhouse gas emissions by sector, 1990 to 2024 (DESNZ final UK greenhouse gas emissions 2024)
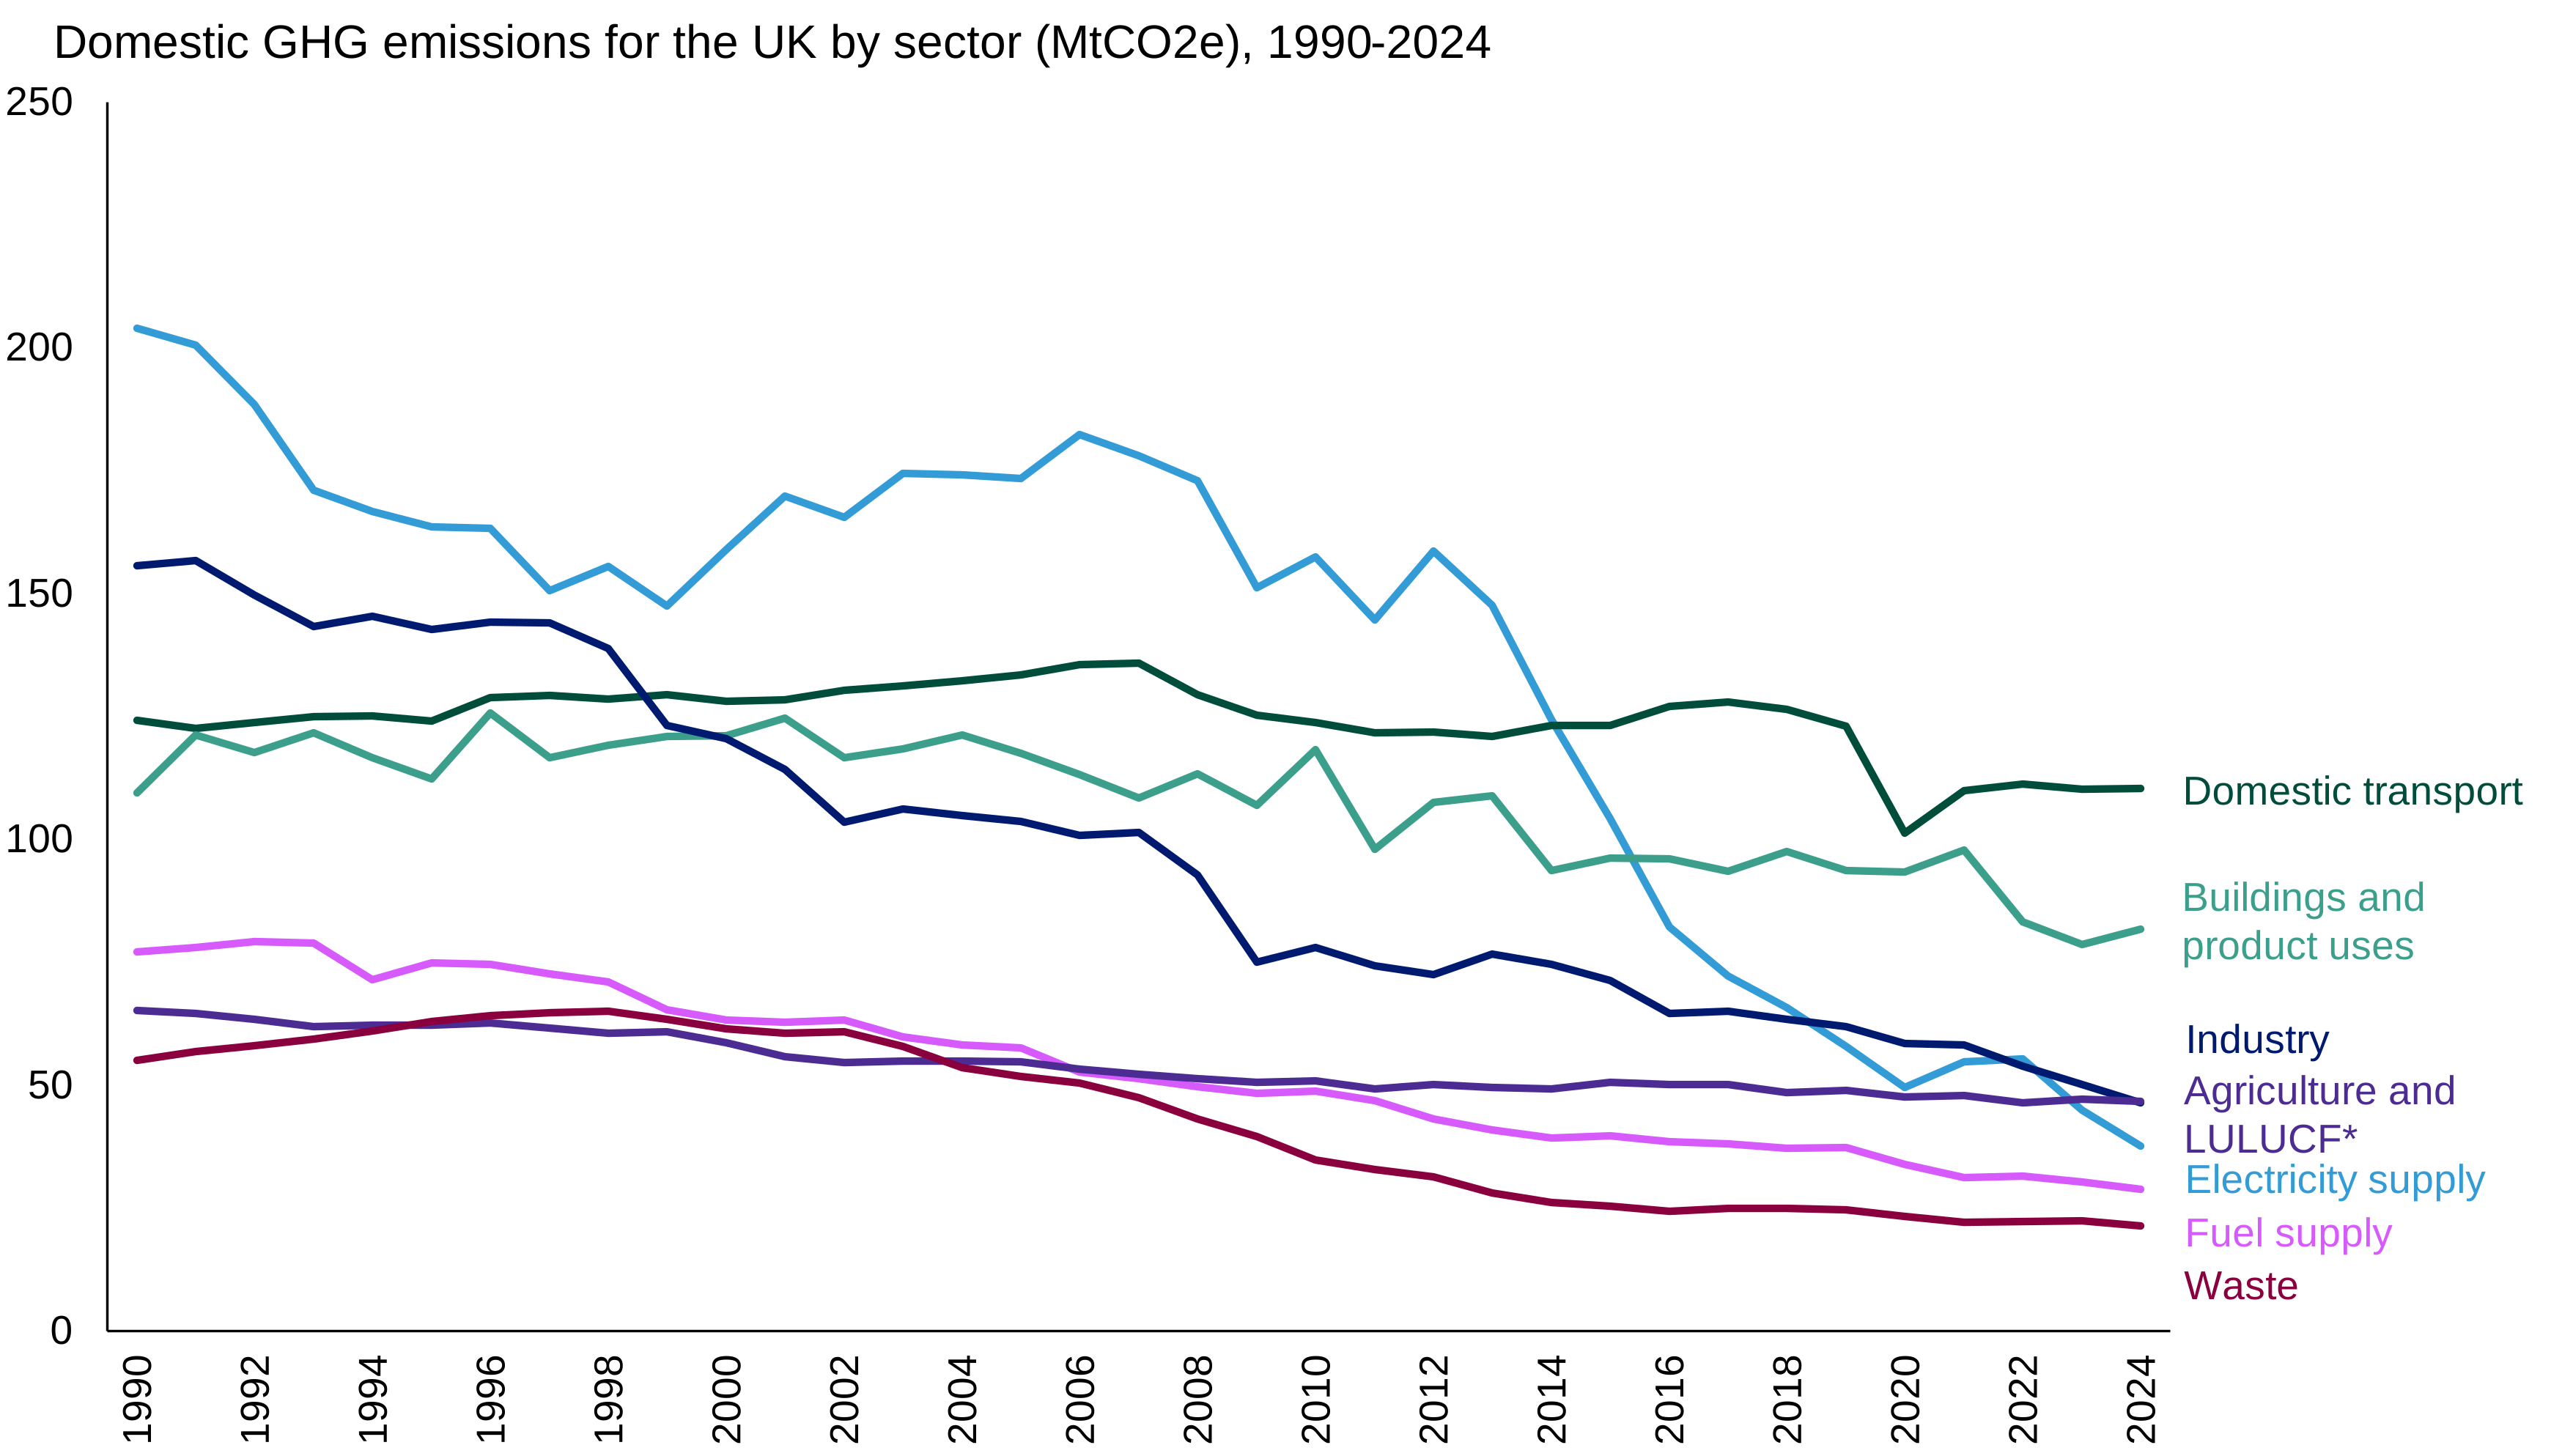
*LULUCF stands for Land Use, Land Use Change, and Forestry.
Chart 1 is a line chart showing that:
-
In 2024, domestic transport emissions (110.4 MtCO2e), similar to 2023 (0.2% increase from 110.2 MtCO2e in 2023) and remained 10% below 2019 (123.0 MtCO2e) pre-pandemic levels
-
Between 1990 and 2024, GHG emissions from domestic transport reduced by only 11% whilst emissions from all other sectors reduced significantly (53% decrease)
-
Since 2014, domestic transport has been the sector with the highest greenhouse gas emissions (accounting for 30% of all UK domestic emissions in 2024, up from 16% in 1990), due to a steady decline in emissions from electricity supply, the historically largest-emitting sector [footnote 2]
Chart 2: Proportion of domestic greenhouse gas emissions by sector, 2024 (DESNZ final UK greenhouse gas emissions 2024)
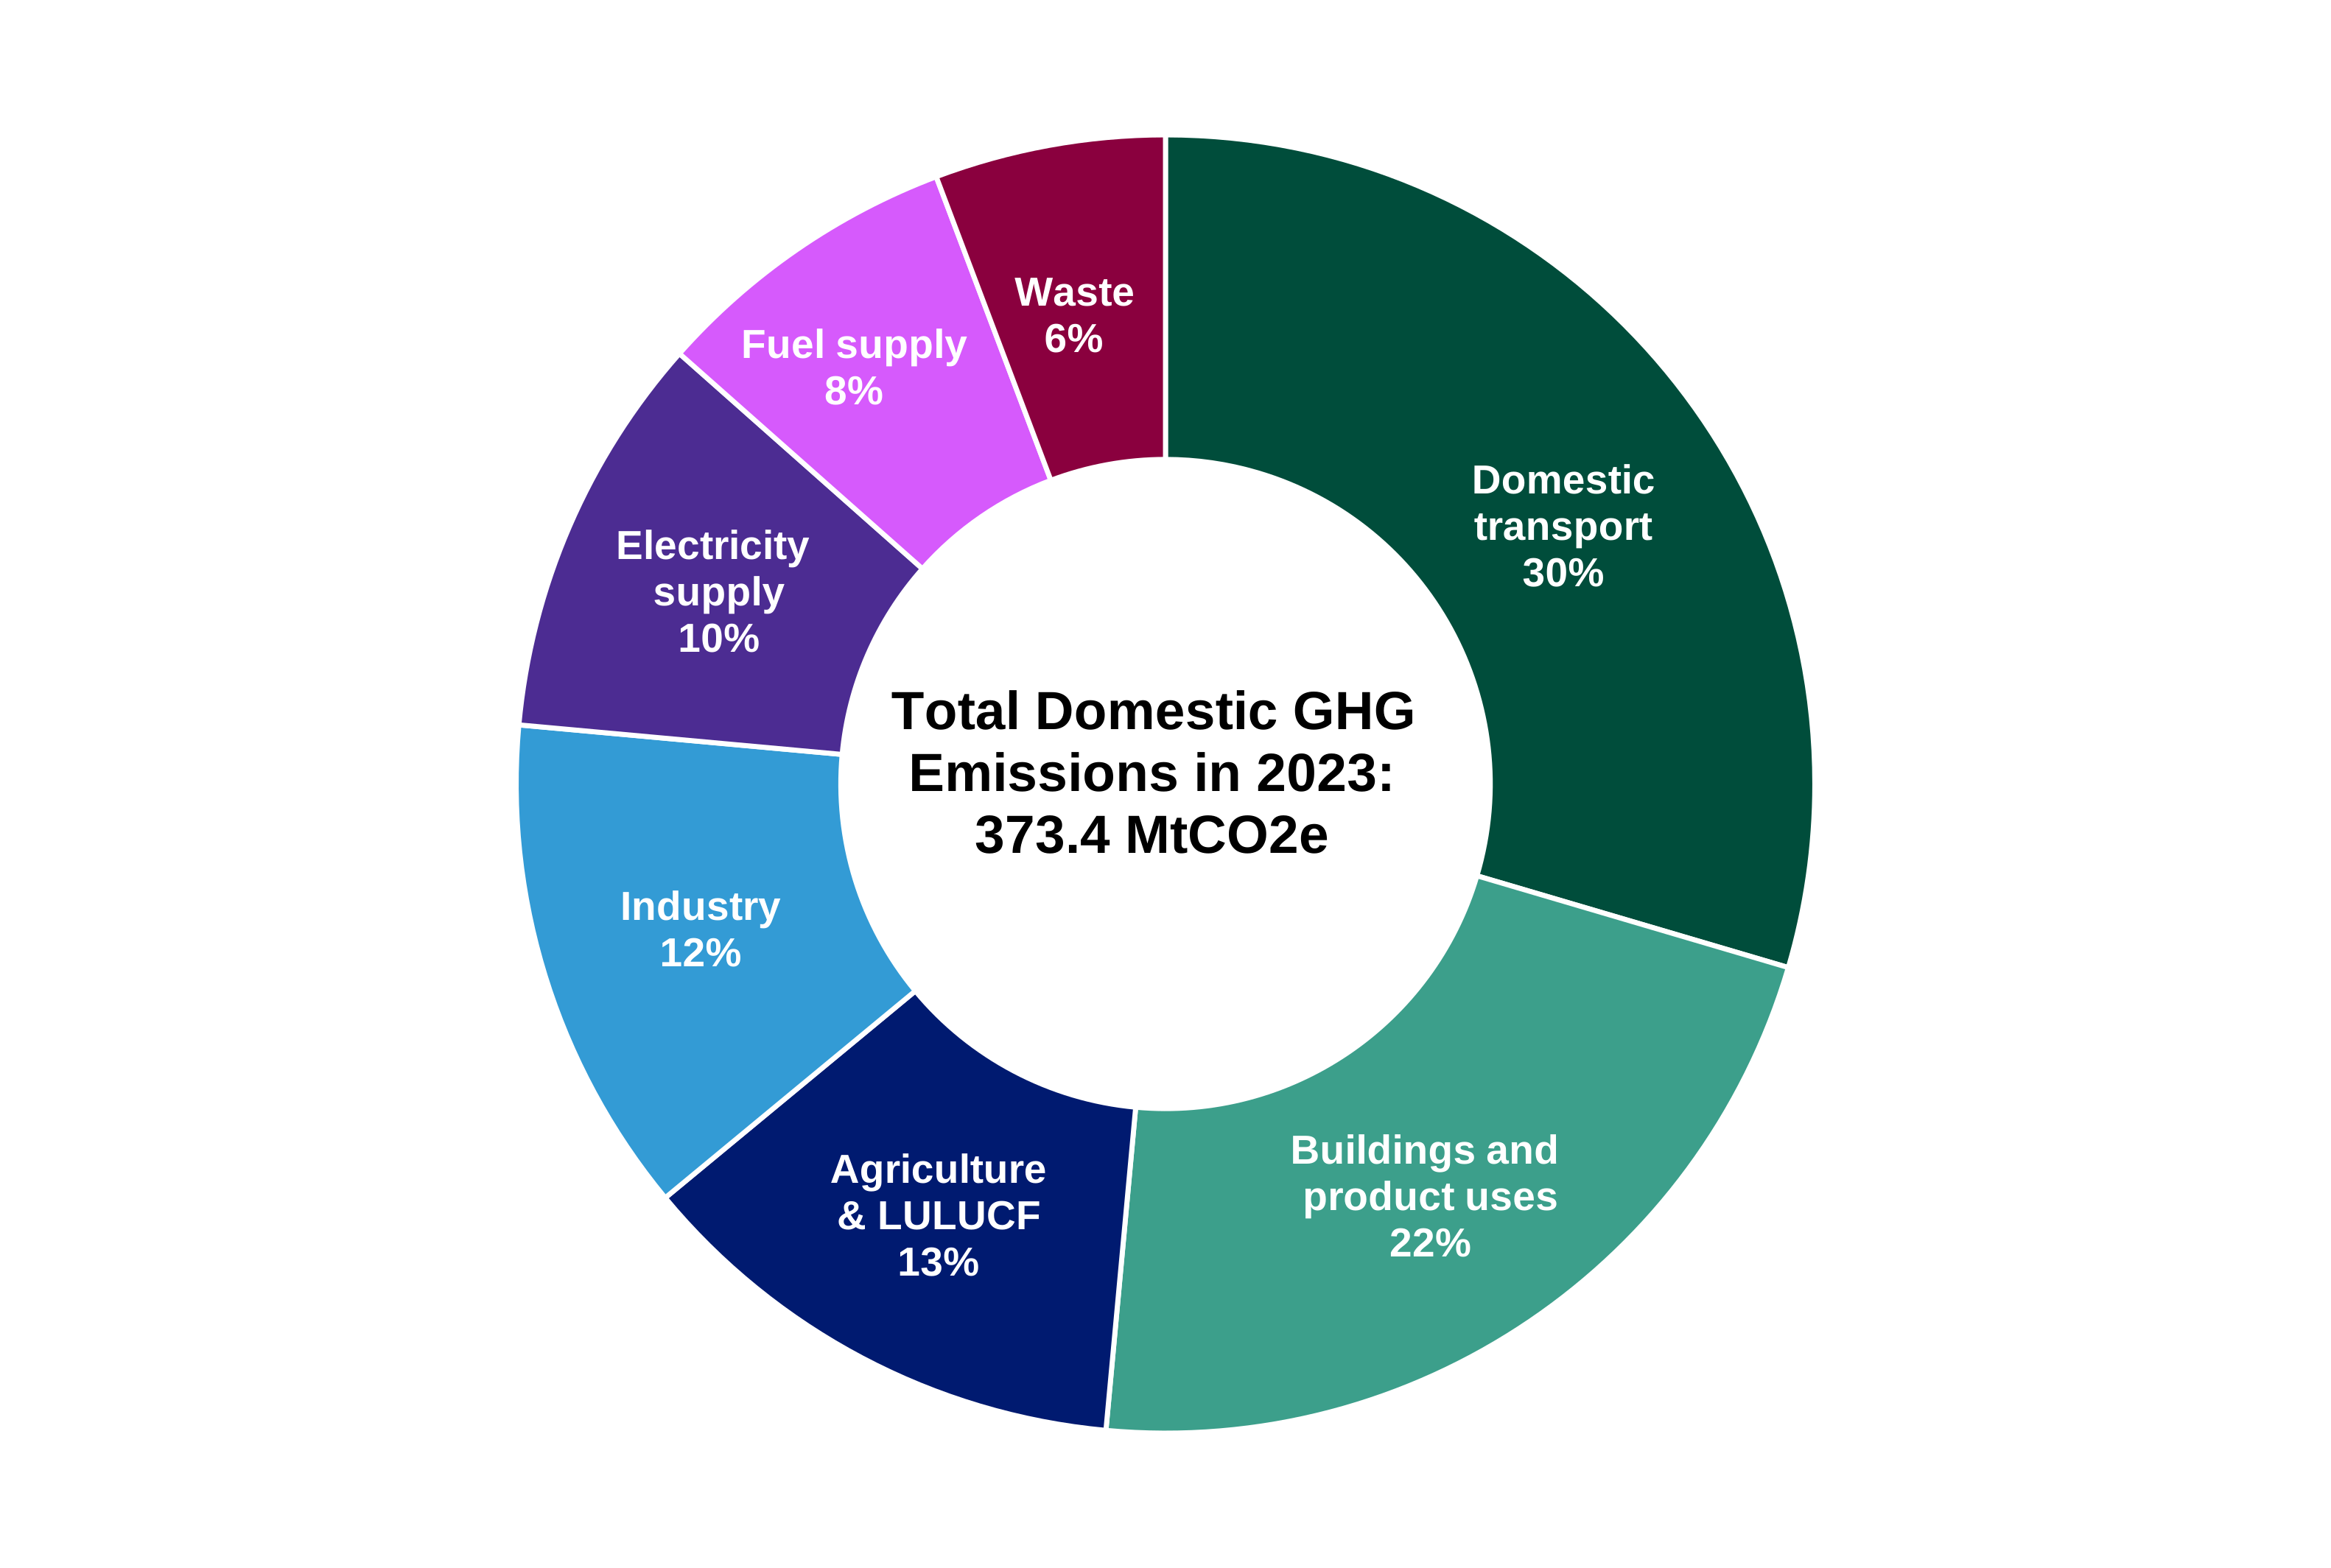
Chart 2 is a doughnut chart showing that, in 2024, GHG emissions from:
-
Domestic transport (110.4 MtCO2e) accounted for 30%
-
Buildings and product uses (81.8 MtCO2e) accounted for 22%
-
Agriculture and LULUCF (46.8 MtCO2e) accounted for 13%
-
Industry (46.5 MtCO2e) accounted for 12%
-
Electricity supply (37.7 MtCO2e) accounted for 10%
-
Fuel supply (28.8 MtCO2e) accounted for 8%
-
Waste (21.4 MtCO2e) accounted for 6%
4. Domestic greenhouse gas emissions from road transport
Road transport is responsible for the majority of domestic transport GHG emissions.
Chart 3: Domestic greenhouse gas emissions by road transport modes and non-road transport, 2024 (ENV0201)
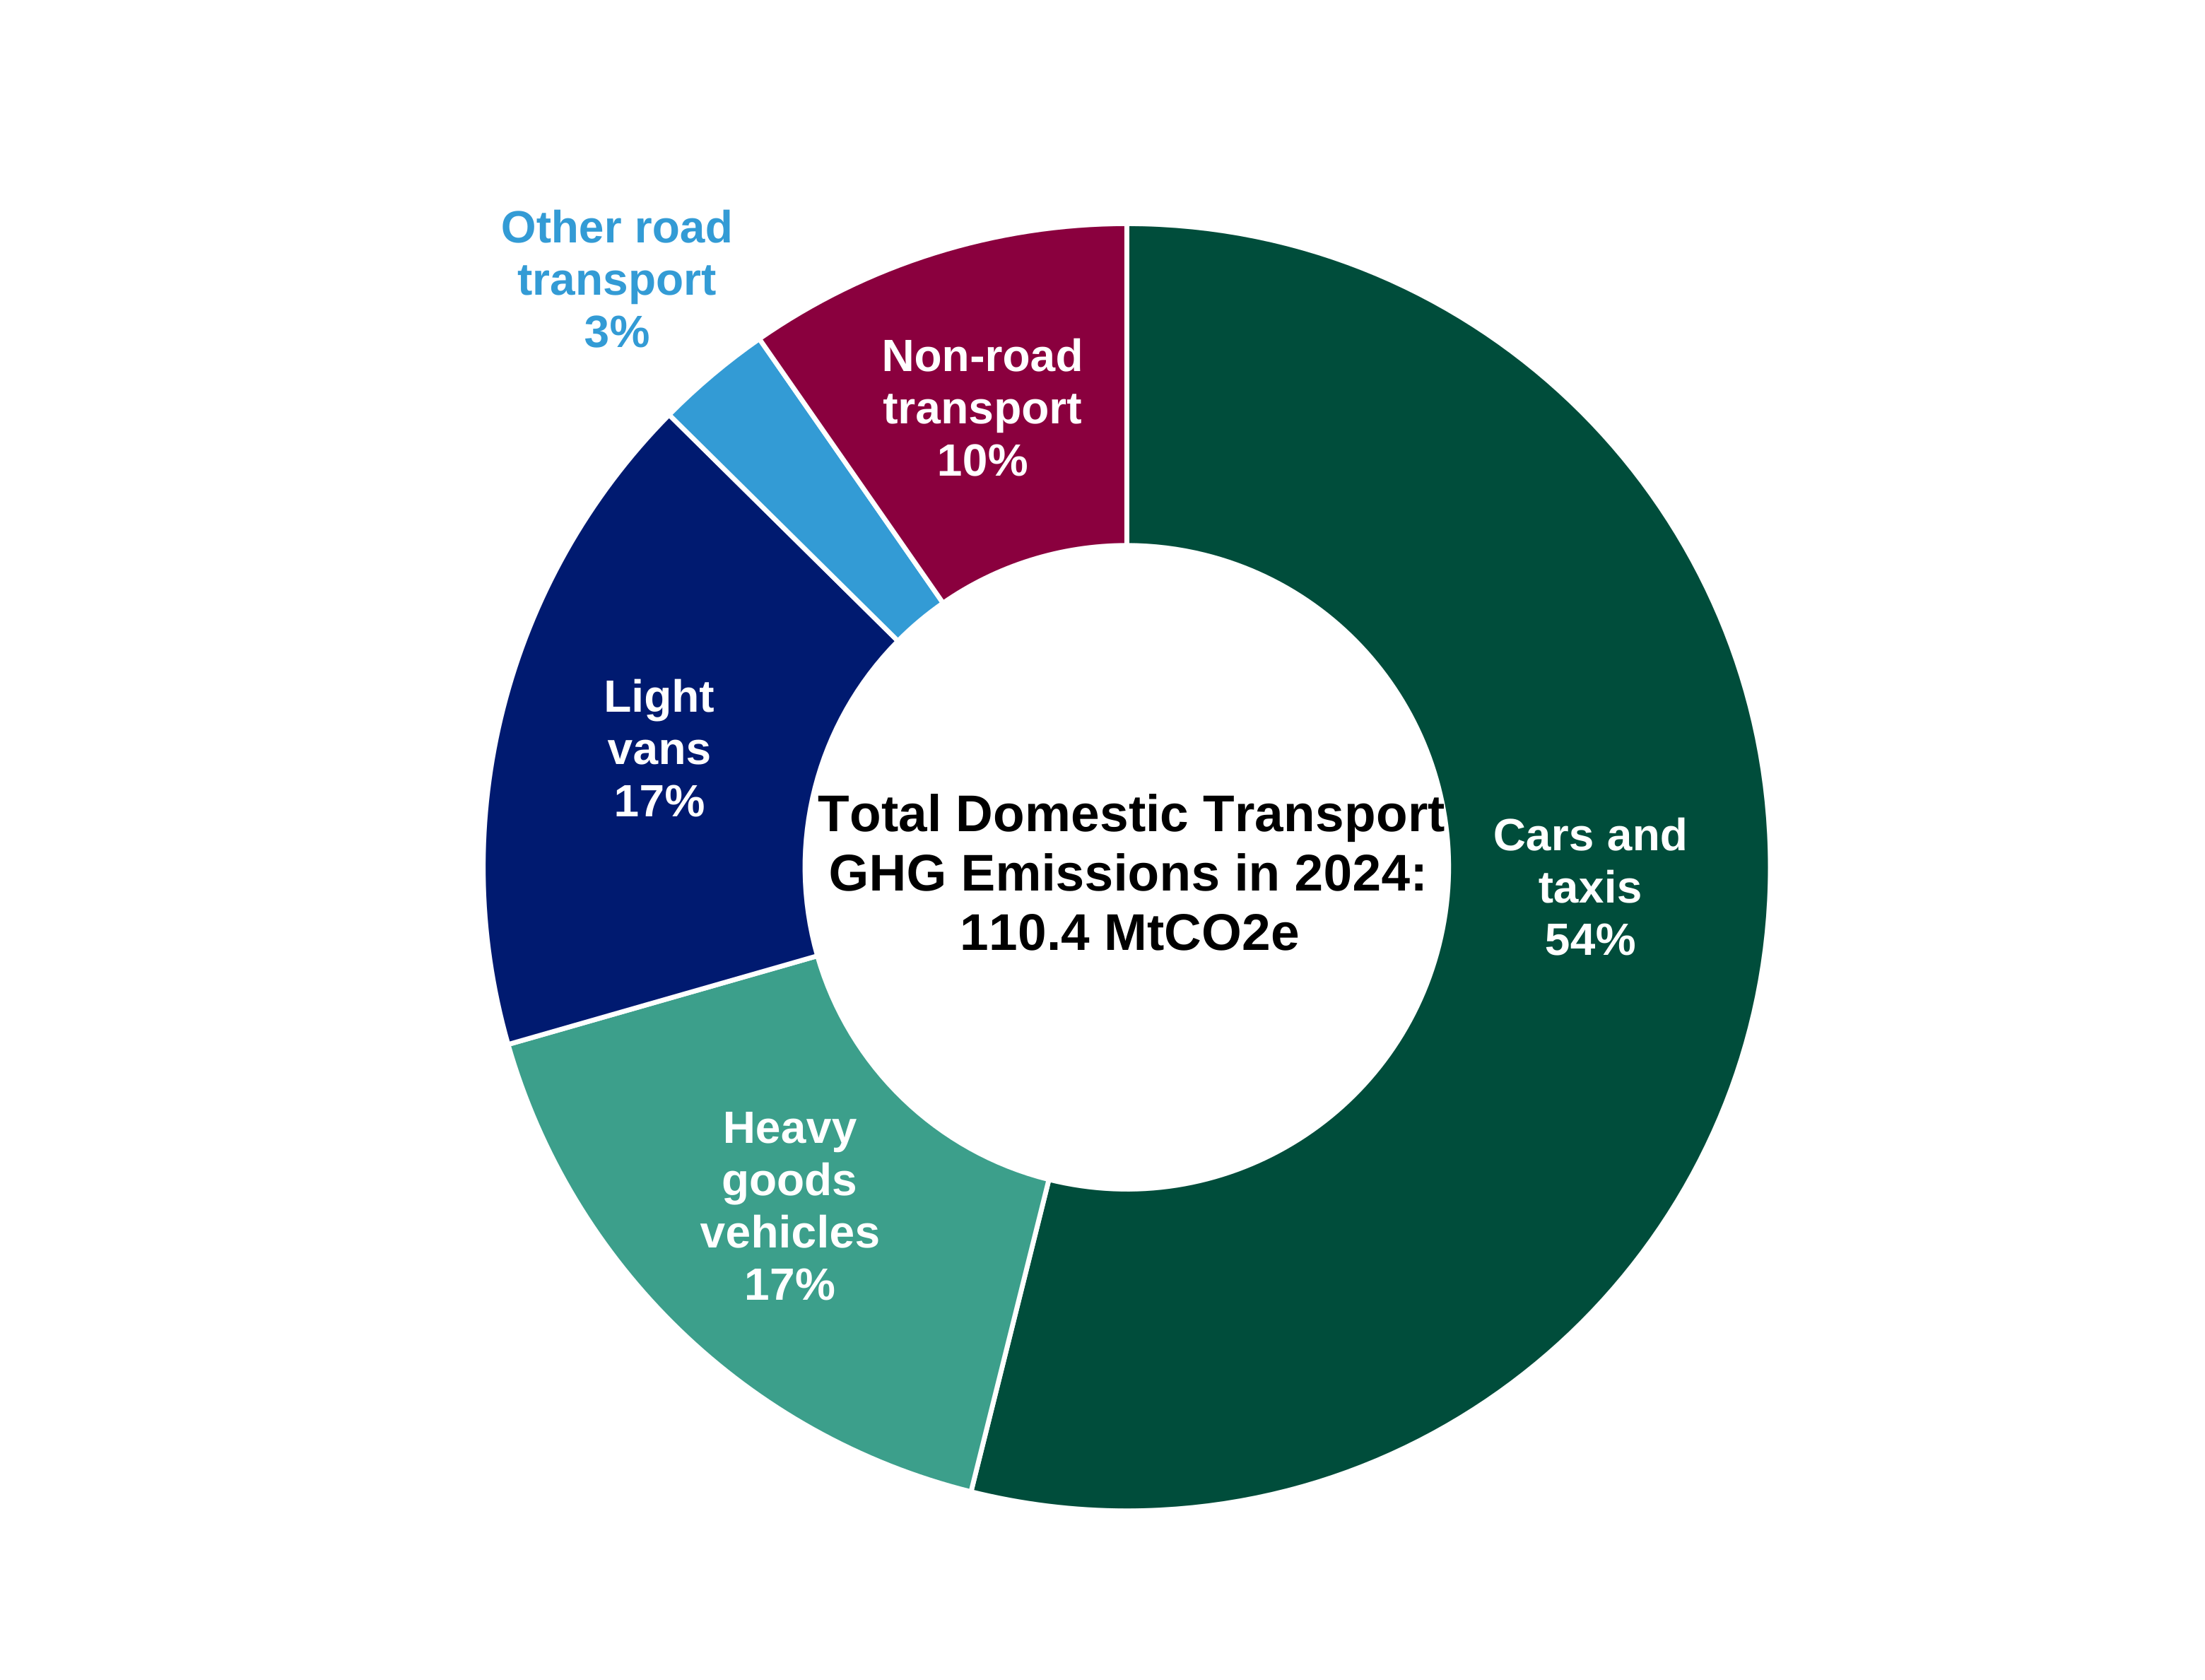
Chart 3 is a doughnut chart showing that in 2024:
-
The majority (90%) of the 110.4 MtCO2e emissions from domestic transport came from road vehicles (99.7 MtCO2e)
-
Cars and taxis accounted for the largest proportion (53%) of domestic transport GHG emissions (59.5 MtCO2e)
-
HGVs (18.4 MtCO2e) and light vans (18.6 MtCO2e) each contributed to 17% of domestic transport GHG emissions
5. Domestic and international greenhouse gas emissions from transport modes
Chart 4: Domestic and international greenhouse gas emissions (MtCO2e) by transport mode, 1990, 2019, and 2024 (ENV0201)
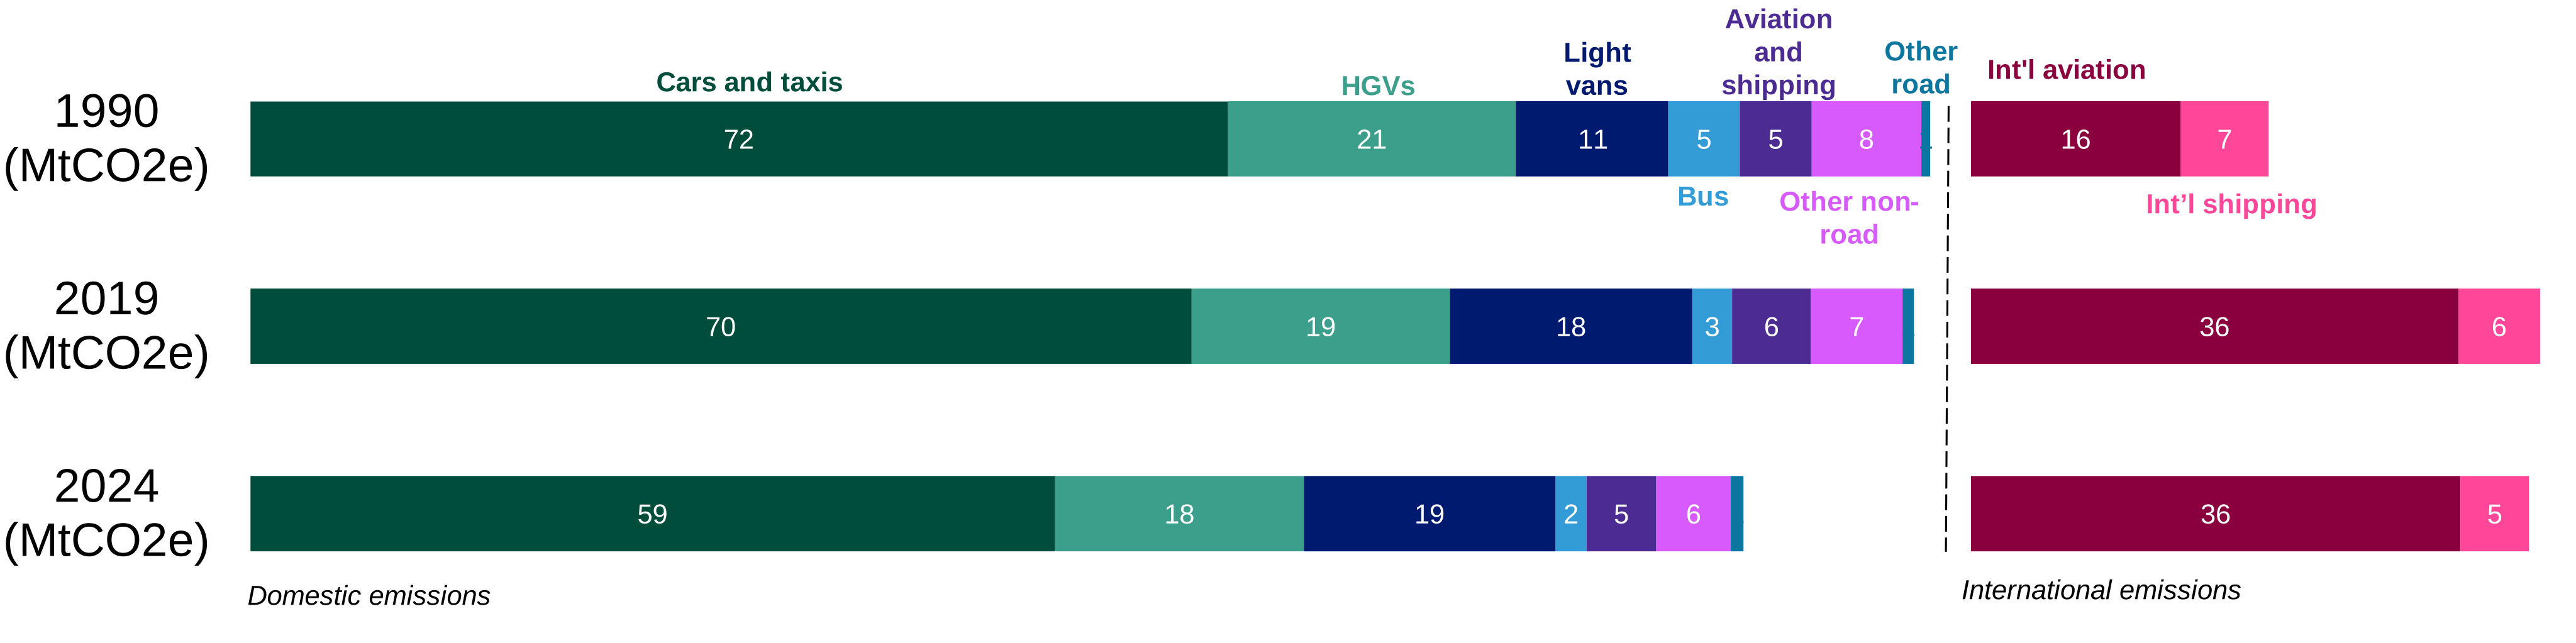
HGVs Stands for Heavy Goods Vehicles.
Other non-road Category includes rail and other non-road transport.
Other road Category includes motorcycles and mopeds and other road transport.
The table below contains the MtCO2e of GHG emissions for each mode of transport found in chart 4.
Table 1: Domestic and international greenhouse gas emissions (MtCO2e) by transport mode, 1990, 2019, and 2024 (ENV0201)
| Transport type | 1990 (MtCO2e) | 2019 (MtCO2e) | 2024 (MtCO2e) |
|---|---|---|---|
| Total transport (domestic and international) | 146.2 | 165.0 | 151.6 |
| Total domestic transport | 124.2 | 123.0 | 110.4 |
| Cars and taxis | 72.3 | 69.6 | 59.5 |
| HGVs | 21.3 | 19.1 | 18.4 |
| Light vans | 11.3 | 17.9 | 18.6 |
| Buses and coaches | 5.3 | 3.0 | 2.3 |
| Motorcycles and mopeds | 0.7 | 0.4 | 0.5 |
| Other road transport | 0.0 | 0.4 | 0.5 |
| Rail | 2.0 | 1.9 | 1.7 |
| Domestic aviation | 1.5 | 1.3 | 1.2 |
| Domestic shipping | 3.8 | 4.5 | 4.0 |
| Other non-road transport | 6.1 | 4.9 | 3.9 |
| International aviation | 15.5 | 36.0 | 36.2 |
| International shipping | 6.5 | 6.0 | 5.0 |
Chart 5: Trends in total greenhouse gas emissions from domestic and international transport, 1990 to 2024 (ENV0201)
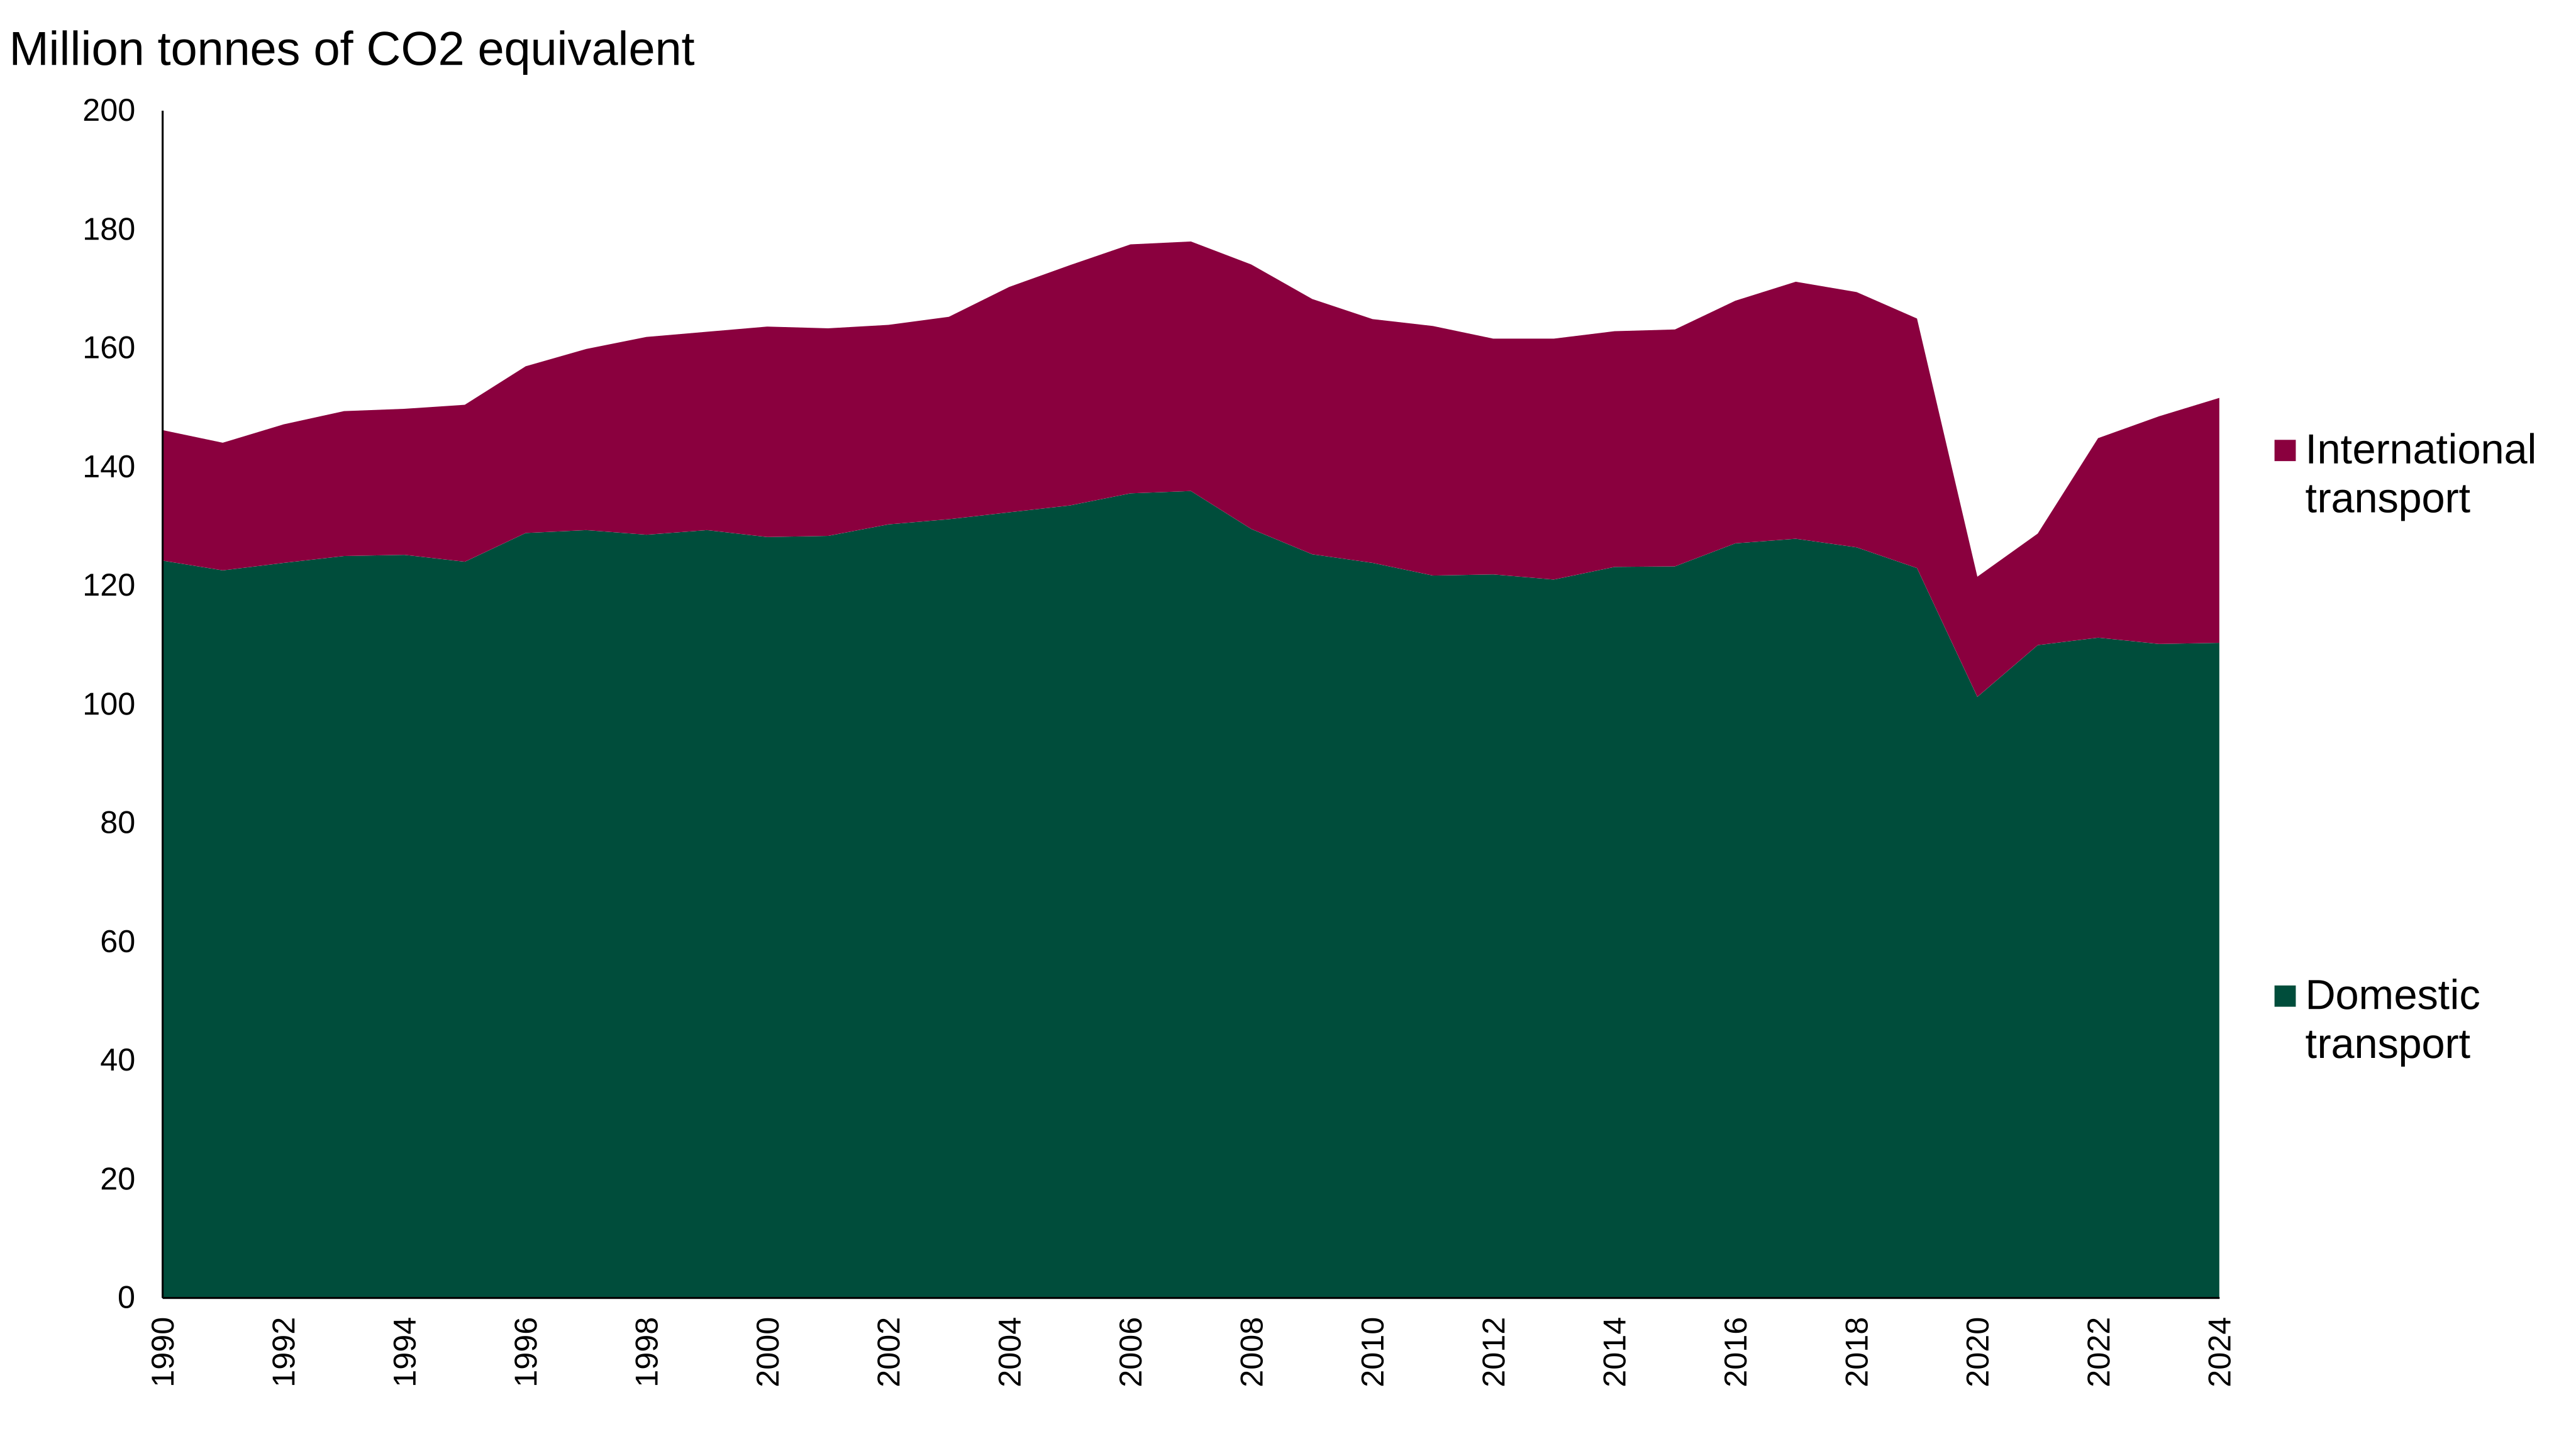
Chart 5 is an area chart showing that:
- International transport was responsible for 41.2 MtCO2e of emissions in 2024, (27% of total transport emissions)
- This has grown steadily since 1990, when international transport was responsible for 22.0 MtCO2e of emissions (15% of total transport emissions)
- After a sharp decline during the pandemic, international transport continues to rise steadily since 2022, and emissions are now approaching pre-pandemic levels
Chart 6: Trends in total greenhouse gas emissions from domestic and international transport by transport mode, 1990 to 2024 (ENV0201)
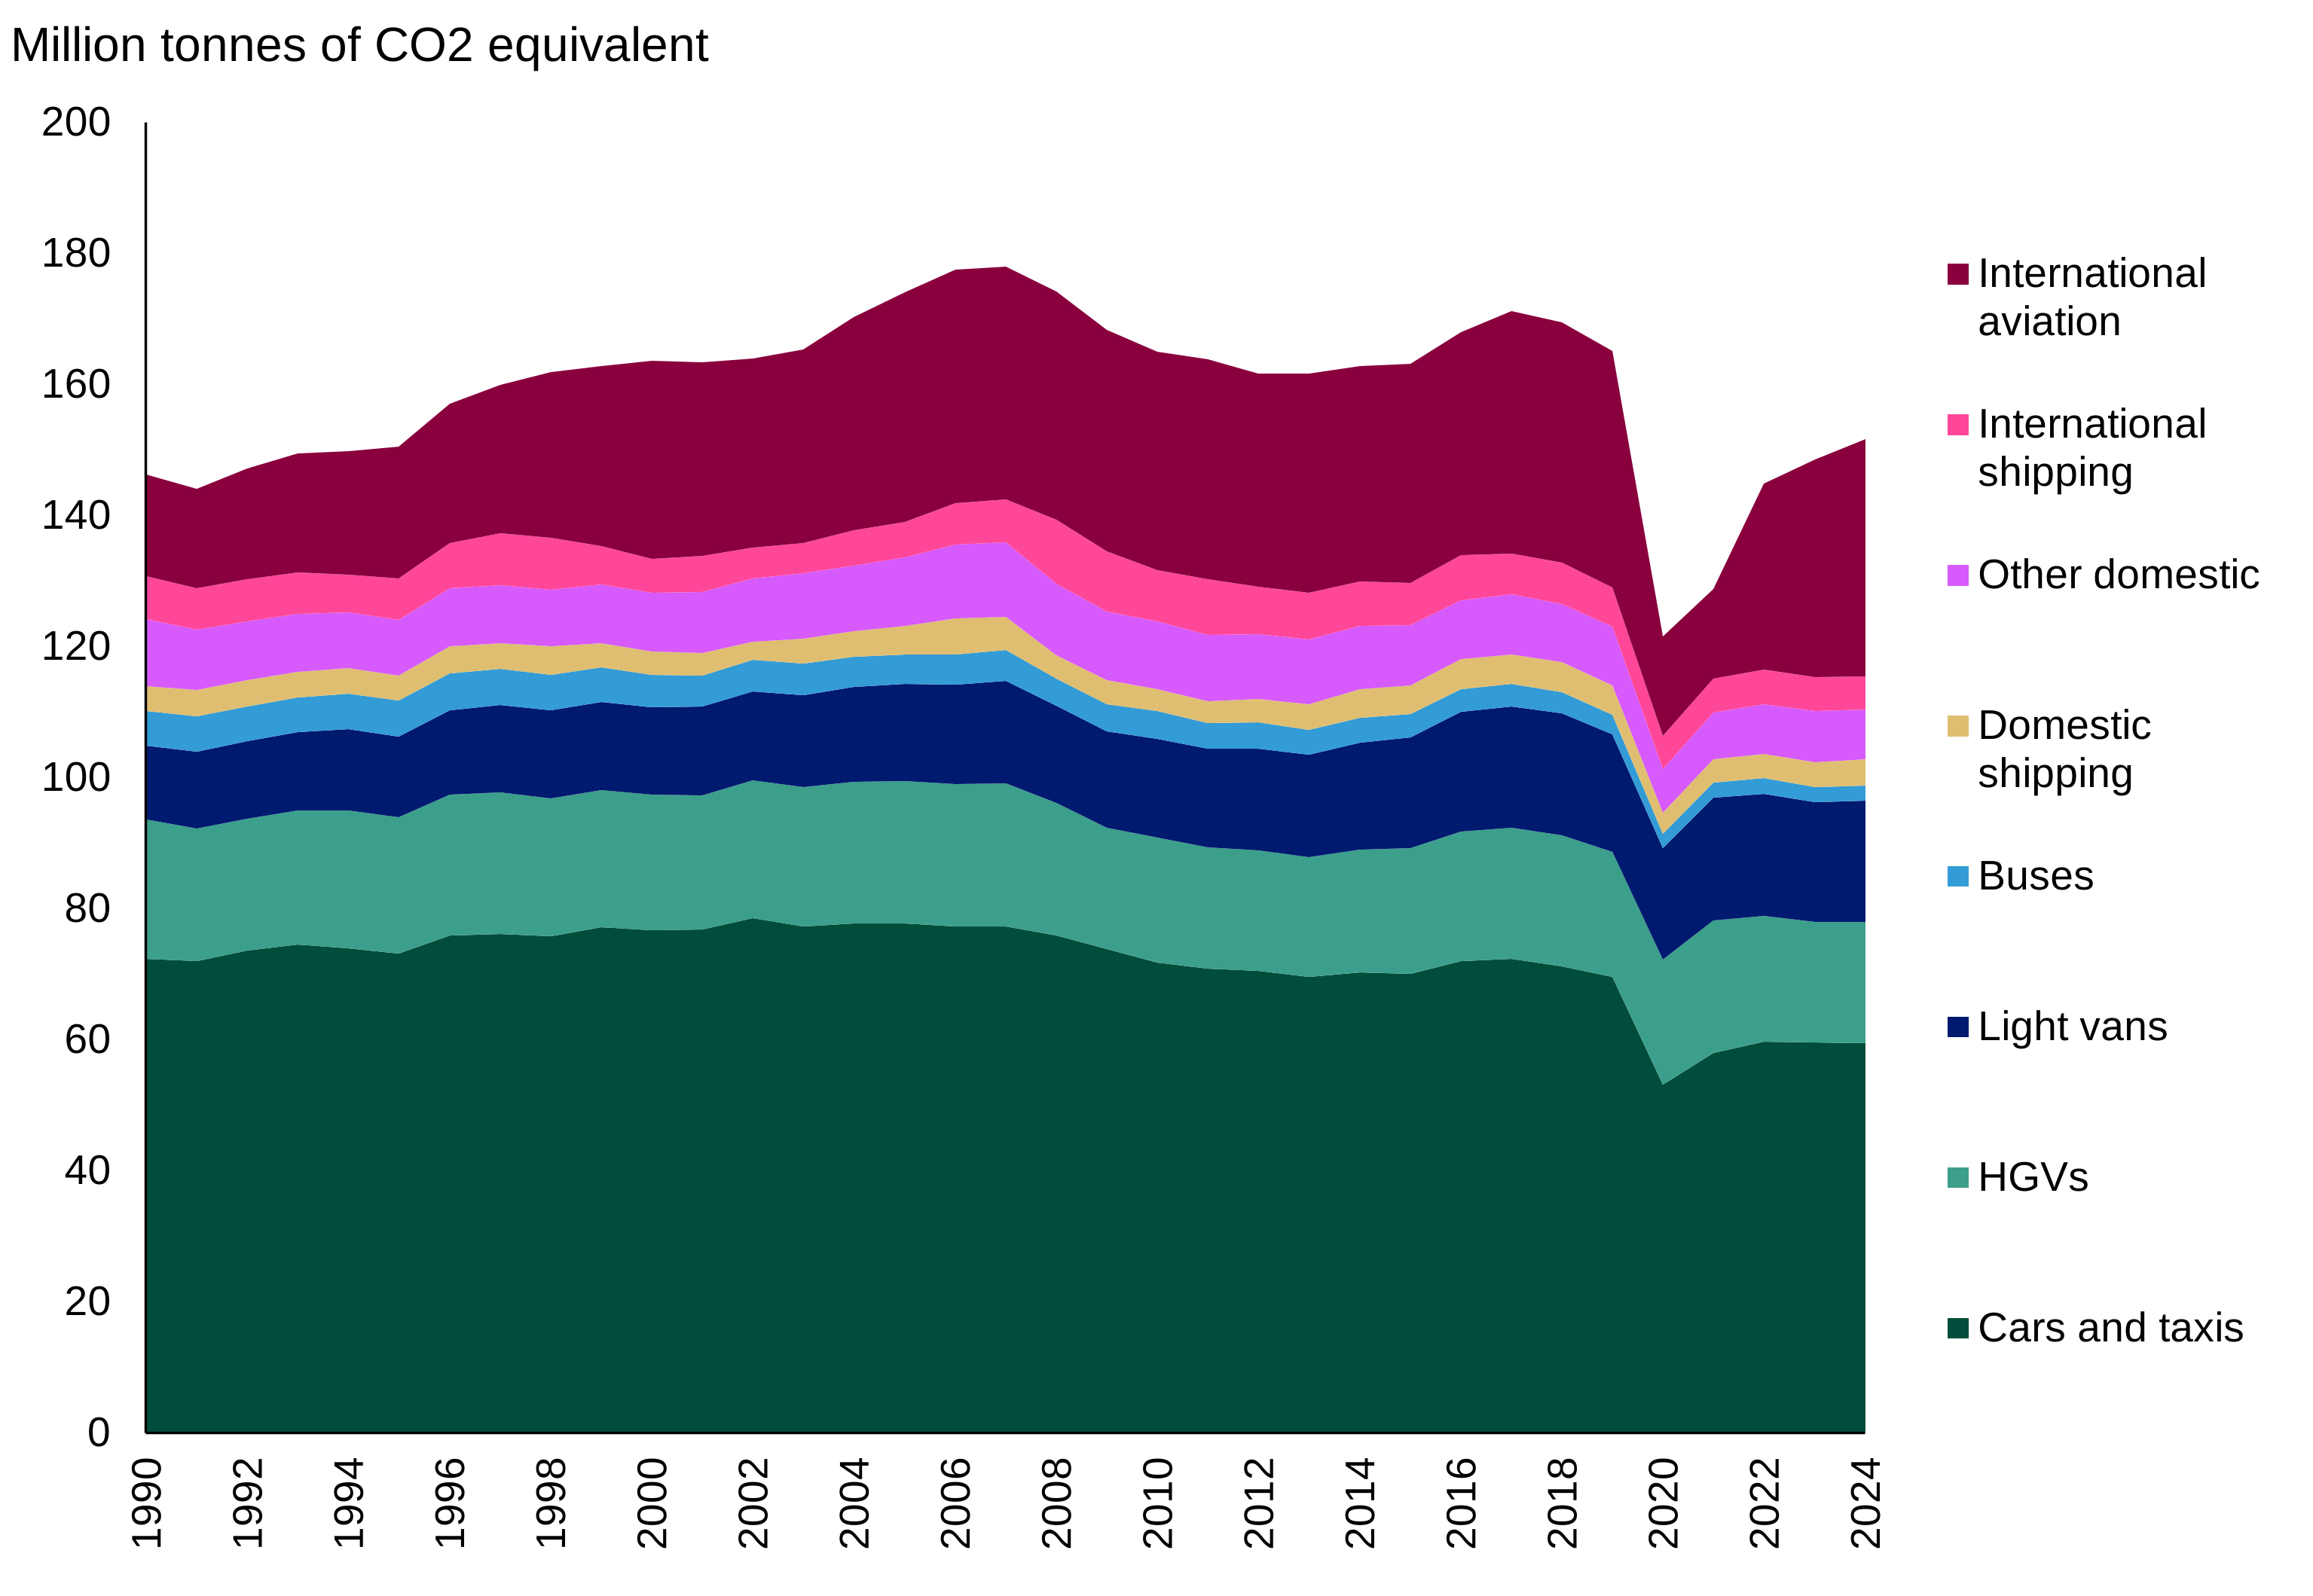
Other domestic: category includes motorcycles and mopeds, other road transport, rail, domestic aviation and other non-road transport.
Chart 6 is an area chart showing that:
- In 1990, international aviation emitted 15.5 MtCO2e (11% of total transport emissions), growing steadily to 36.2 MtCO2e (25% of total transport emissions) by 2024
- In 1990, international shipping emitted 15.5 MtCO2e (4% of total transport emissions), decreasing to 5.0 MtCo2e (3% of total transport emissions) by 2024
- In 1990, cars and taxis emitted 72.3 MtCo2e (49% of total transport emissions), decreasing to 59.5 MtCO2e (39%) in 2024
Chart 7: Domestic and international greenhouse gas emissions by transport mode, 2024 (ENV0201)
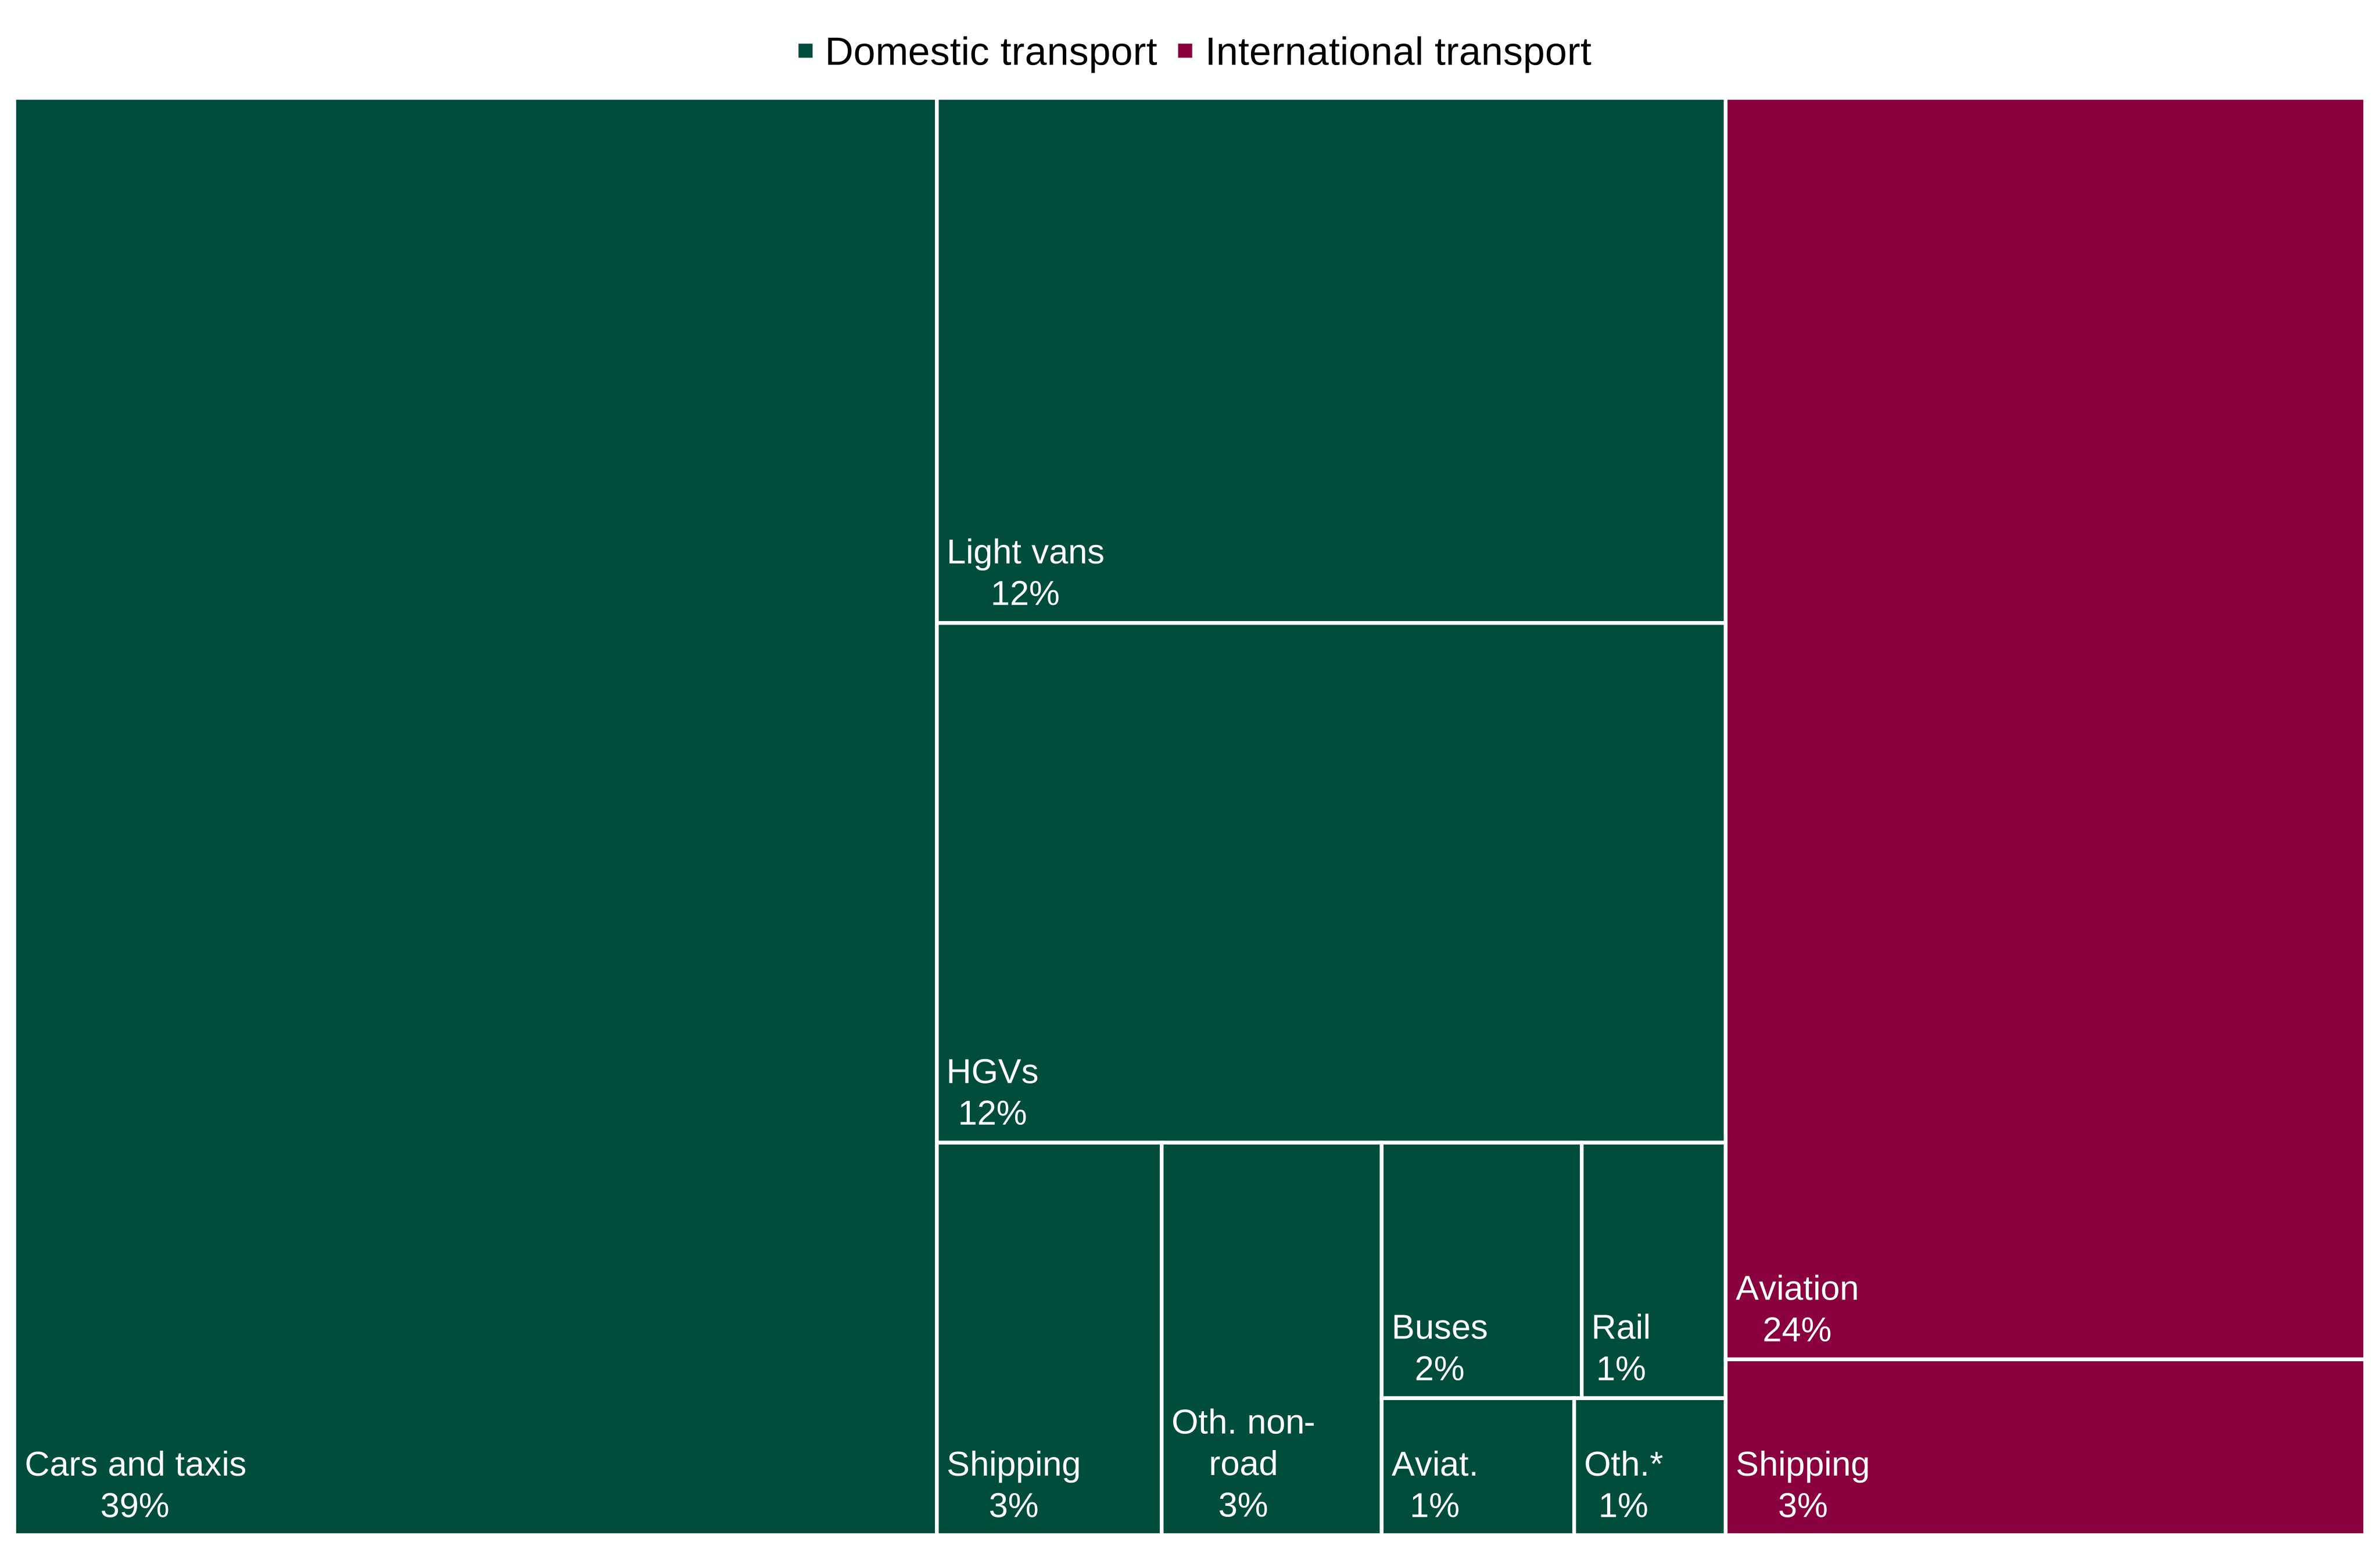
*Oth. Category includes motorcycles and mopeds and other road transport.
Chart 7 is a treemap chart showing that:
-
In 2024, the majority (73%) of the 151.6 MtCO2e GHG emissions from transport came from domestic transport (110.4 MtCO2e)
-
In 2024, international transport accounted for 27% of transport GHG emissions (41.2 MtCO2e)
Chart 8: Domestic and international aviation and shipping trends over time, 1990 to 2024 (ENV0201)
There have been revisions to domestic shipping emissions estimates this year: for further detail see the About these statistics section
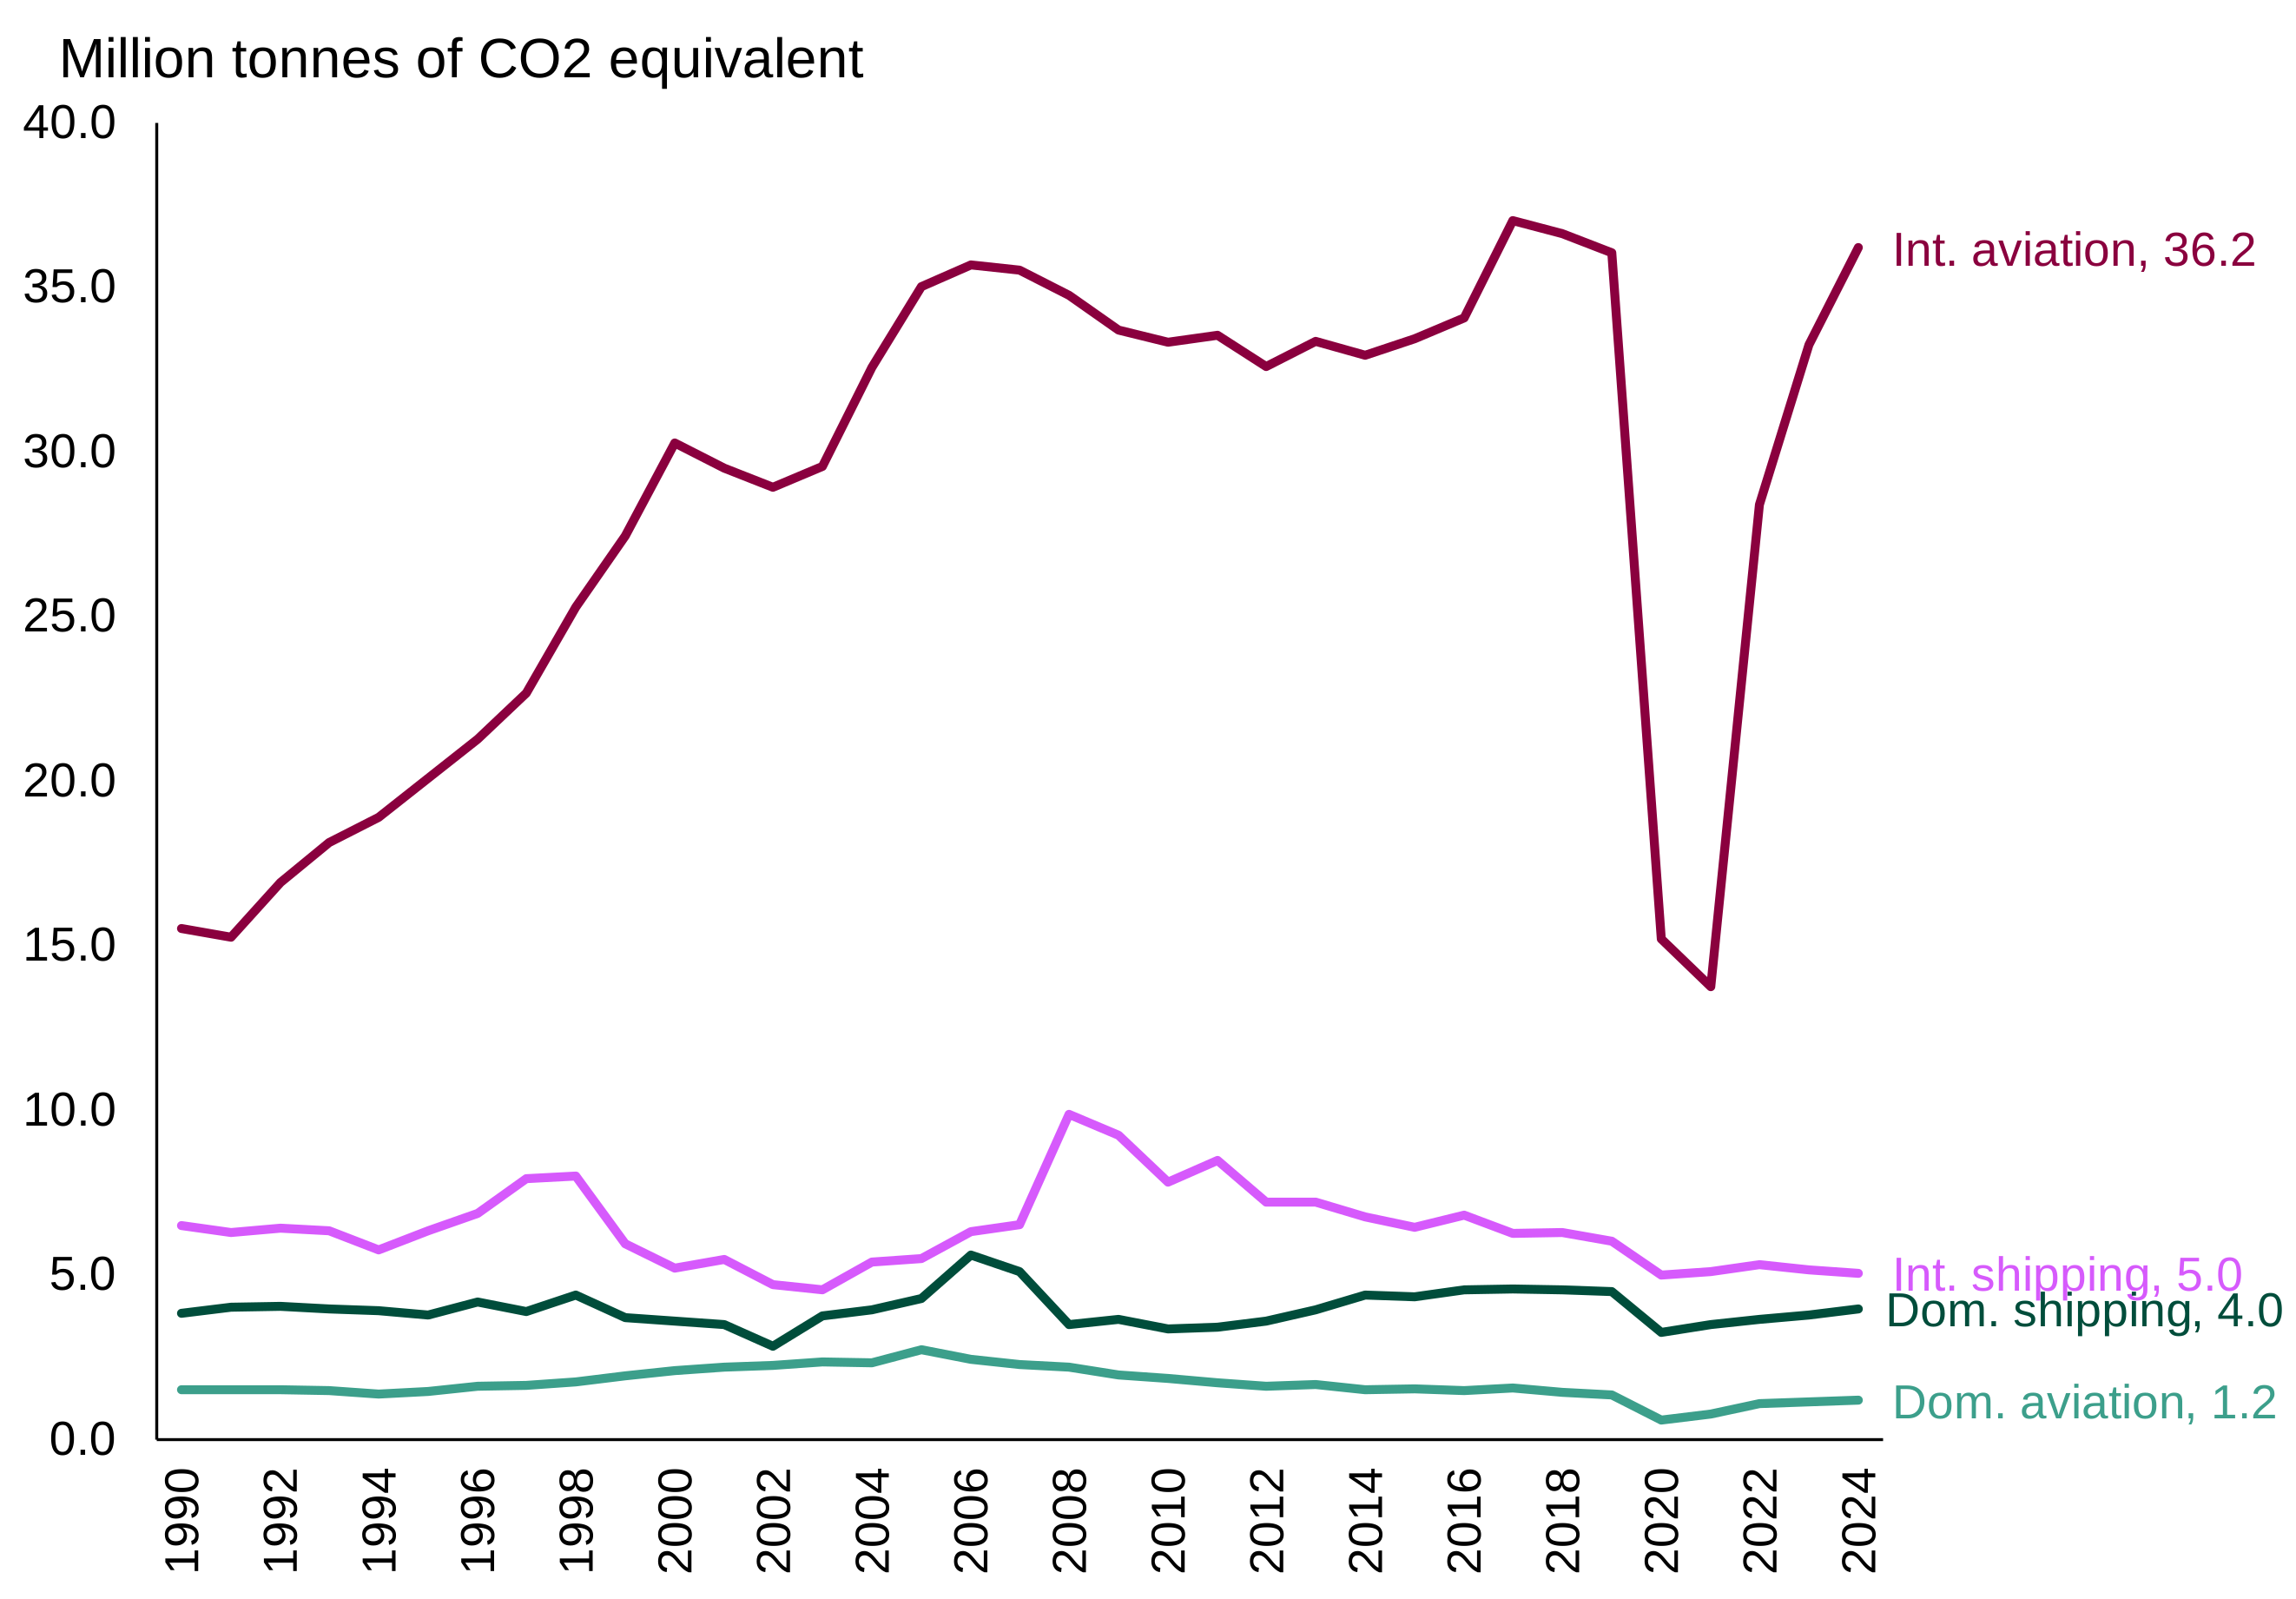
Chart 8 is a line chart showing that from 1990 to 2024:
-
International aviation emissions increased by 133% (15.5 MtCO2e to 36.2 MtCO2e)
-
International shipping emissions decreased by 22% (6.5 MtCO2e to 5.0 MtCO2e)
-
Domestic shipping emissions increased by 3% (3.8 MtCO2e to 4.0 MtCO2e)
-
Domestic aviation emissions decreased by 21% (1.5 MtCO2e to 1.2 MtCO2e)
6. Provisional greenhouse gas emissions from transport estimates for 2024
Provisional data for the UK’s domestic GHG emissions from the transport sector for 2025 have been released by DESNZ. These provisional estimates cannot be summarised by transport mode and are subject to change. This should be considered when referencing the figures.
Provisional estimates indicate that domestic transport GHG emissions have increased by 2% (3 MtCO2e) compared to 2024, to 112.9 MtCO2e in 2025. This is a decrease of 8% (10.1 MtCO2e) compared to the pre-pandemic period in 2019. Transport emissions have been rising steadily since 2020, however the rate of increase has slowed year on year.
In 2025, domestic transport remained the UK’s largest emitting sector, rising from 30% of total emissions in 2024 (110.4 MtCO2e) to 31% in 2025 (112.9 MtCO2e).
Emissions from international aviation fuel use from UK bunkers were estimated to be 36.0 MtCO2e in 2025, a slight decrease of 0.5% from 36.2 in 2024. This marks a return to the pre-pandemic emissions level in 2019 (36.0 MtCO2e).
Methodology for the calculation of provisional estimates can be found on the Provisional UK greenhouse gas emissions national statistics 2025 page published by DESNZ.
7. About these statistics
Our statistical practice is regulated by the Office for Statistics Regulation (OSR). OSR sets the standards of trustworthiness, quality and value in the Code of Practice for Statistics that all producers of official statistics should adhere to. You are welcome to email environment.stats@dft.gov.uk with any comments about how we meet these standards.
Domestic emissions
This report primarily focuses on UK domestic GHG emissions, which does not include international aviation and shipping. Emissions are estimated following the guidance set out by the Intergovernmental Panel on Climate Change (IPCC), as required for the UK’s submissions to the United Nations Framework Convention on Climate Change (UNFCCC) each year. Under this guidance, international aviation and shipping emissions are reported but not included within the UK total. This report focuses on ‘territorial’ emissions, which are those emitted within the UK’s borders. Alternative presentations, on a residency or a consumption basis, are also available see data table (ENV0201).
Data sources
The data we present on greenhouse gases comes from the DESNZ Greenhouse Gas Inventory collected and modelled by the Ricardo Consortium (a third-party contractor). To calculate transport emissions, Ricardo combine data on fuel consumption with transport data to model emissions. It covers the period 1990 to 2024.
The UK Greenhouse Gas Inventory is reviewed every year (including a review by the UNFCCC), and the whole historical data series (from 1990 to 2024) is revised where necessary to incorporate method improvements, changes to international reporting guidelines or new data. Further details can be found in DESNZ’s 2024 UK Greenhouse Gas Emissions, Final Figures statistical release, under the heading ‘Revisions to the UK Greenhouse Gas Inventory’.
Updates to domestic shipping emissions
There has been an update to the method for estimating domestic shipping emissions to align with data on the amount of fuel sold, moving away from methods based on estimates of the fuel used. There are significant changes across all years from 1990 to 2024.
Previously, bottom-up estimates of emissions were reported based on ship movement data, which allowed an estimate of the amount of fuel used. The updated method uses this same approach but then normalises the bottom-up estimates to align with DESNZ’s Digest of UK Energy Statistics (DUKES) data on the amount of fuel sold.
Modelled emissions estimates for inland waterways and port machinery are also now normalised to align with DUKES data, but estimates for military shipping are based on fuel purchases by the Ministry of Defence (MoD).
Further information can be found:
- In the ‘Revisions to the UK Greenhouse Gas Inventory’ section of DESNZ’s Final UK 1990-2024 greenhouse gas emissions statistics
- In the ‘MS 10 National navigation and fishing’, ‘MS 11 Inland Waterways’ and ‘MS 12 International shipping’ sections of the UK 1990-2024 National Inventory Document
- Under section 3.3.5.4 of the UK Informative Inventory Report from the National Atmospheric Emissions Inventory
8. Instructions for printing and saving
Depending on which browser you use and the type of device you use (such as a mobile or laptop) these instructions may vary.
You will find your print and save options in your browser’s menu. You may also have other options available on your device. Tablets and mobile device instructions will be specific to the make and model of the device.
9. How to search
Select Ctrl and F on a Windows laptop or Command and F on a Mac.
This will open a search box in the top right-hand corner of the page. Type the word you are looking for in the search bar and press enter.
Your browser will highlight the word, usually in yellow, wherever it appears on the page. Press enter to move to the next place it appears.
10. Contact details
Transport energy and environment statistics
Email environment.stats@dft.gov.uk
Media enquiries 0300 7777 878
To hear more about DfT statistical publications as they are released, follow us on X at DfTstats.
11. Footnotes
-
Accredited official statistics are called National Statistics in the Statistics and Registration Service Act 2007. ↩
-
Context for the reduction in electricity supply emissions is available in Final UK greenhouse gas emissions national statistics: 1990 to 2024, DESNZ. ↩