Employment of disabled people 2023
Published 26 October 2023

© Crown copyright 2023
This publication is licensed under the terms of the Open Government Licence v3.0 except where otherwise stated. To view this licence, visit nationalarchives.gov.uk/doc/open-government-licence/version/3 or write to the Information Policy Team, The National Archives, Kew, London TW9 4DU, or email: psi@nationalarchives.gov.uk.
Where we have identified any third party copyright information you will need to obtain permission from the copyright holders concerned.
This publication is available at https://www.gov.uk/government/statistics/the-employment-of-disabled-people-2023/employment-of-disabled-people-2023
1. Introduction
These statistics relate to the employment of working-age (aged 16 to 64) disabled people in the UK. They provided context for the government’s goal to see one million more disabled people in work between 2017 and 2027 which was met in 2022.
They also provide context for the government’s ongoing commitment to reduce the gap between the employment rates of disabled and non-disabled people (known as the disability employment gap). The government reaffirmed this commitment in the Health and Disability White Paper published alongside the Spring Budget 2023, and stated an intention to set a new disability employment ambition.
This is the fourth annual publication and provides more detailed breakdowns of the labour market status of disabled people than those published on a quarterly basis by the Office for National Statistics (ONS). The need for these statistics was set out in the government’s strategy Improving lives: the future of work, health and disability published in November 2017.
This release contains annual data to March 2023 and quarterly data to June 2023.
2. Main points
Since 2013, the earliest comparable year (see ‘What you need to know’), up to the start of the pandemic (March 2020) the general trend in disability employment was positive. There had been strong growth in the number and rate of disabled people in employment and a narrowing of the gap between the rate of disabled and non-disabled people in employment (the disability employment gap).
The pandemic initially reversed these trends with year-on-year changes showing a fall in the disability employment rate and a widening of the disability employment gap in 2020. The latest quarterly data for April to June 2023 shows that since the same quarter in 2019 the rate has increased by 1.0 percentage point (this change was not statistically significant) and the gap remains unchanged.
-
There were 5.1 million disabled people in employment in the UK in Q2 2023. This is an increase of 320,000 on the year and an overall increase of 2.2 million since the same quarter in 2013
-
The disability employment rate was 53.6% in Q2 2023, compared to 82.5% for non-disabled people. For disabled people, there is an increase of 0.6 percentage points on the year and an overall increase of 10.0 percentage points since the same quarter in 2013
-
The disability unemployment rate was 7.1% in Q2 2023, compared to 3.5% for non-disabled people. For disabled people, this is an increase of 0.4 percentage points from last year and an overall decrease of 6.4 percentage points since the same quarter in 2013
-
The disability economic inactivity rate – where the person self-reports that they are not in or looking for work - was 42.3% in Q2 2023, compared to 14.5% for non-disabled people. For disabled people, this is a decrease of 0.8 percentage points on the year and an overall decrease of 7.2 percentage points since the same quarter in 2013
-
However, the number of working-age disabled people has increased by 500,000 on the year. This means that the 0.8 percentage point decrease equates to an increase of 140,000 in the number of economically inactive disabled people between Q1 2022 and Q2 2023
-
The disability employment gap was 28.9 percentage points in Q2 2023. This is no change on the year and an overall decrease of 4.2 percentage points since the same quarter in 2013
-
On average, between 2014 and 2019, around 340,000 disabled workers moved out of work each year and 380,000 workless disabled people moved into work (includes people who were classed as disabled at the start of the year)
-
This trend was reversed in 2020 and 2021 but in 2022 480,000 workless disabled people moved into work compared to 450,000 disabled workers moving out of work
-
On average, between 2014 and 2022, disabled workers moved out of work at nearly twice the rate (8.9%) of non-disabled workers (5.0%). Workless disabled people moved into work at nearly one-third of the rate (10.0%) of workless non-disabled people (27.3%)
The increasing number of disabled people in employment (between 2013 and 2023) was driven by four main components of change: disability prevalence (60%); non-disabled employment rate (20%); disability employment gap (15%) and increases in the working-age population (5%) (see supplementary data table MSR002)
The latest data shows that:
-
nearly one in four of the working-age population are classed as disabled
-
the number of people reporting a long-term health condition and the number classed as disabled continue to rise
-
The increase in disability prevalence is associated with an increase in people reporting mental health conditions and “other health problems or disabilities”
-
nearly one in three people classed as being disabled one year were no longer classed as being disabled the next year
The disability employment gap is wider for:
-
disabled men
-
older (aged 50 to 64) disabled people
-
disabled people with no qualifications
-
disabled people living in social housing
-
disabled people living alone
-
disabled people living in Northern Ireland, the North of England, Scotland and Wales
The disability employment rate is lower for disabled people:
-
with a mental health condition
-
with five or more health conditions
Disabled people were more likely than non-disabled people to be:
-
working in Health, Retail and Education
-
working in lower-skilled occupations
-
self-employed
-
working part-time (and subsequently less hours)
-
working in the public sector
-
working for a small employer (less than 50)
-
underemployed (looking for and available to start another job or work longer hours)
-
leaving work for health reasons
Disabled people were more likely to be economically inactive and for those that were:
-
the majority gave long-term sickness as their main reason for being inactive
-
they were more likely (than non-disabled people) to want a job
-
they were less likely (than non-disabled people) to have had a job in the last two years
3. What you need to know
Disability
Estimates by disability status in this release are for working-age people (aged 16 to 64 years) from April 2013 onwards. They use the Government Statistical Service (GSS) Harmonised Standard definition, in line with the Equality Act 2010 (EA) core definition.
Estimates prior to April 2013, under different definitions of disability, are covered in-depth in the 2019 version of this publication.
A person is classed as:
-
having a long-term health condition if they answer ‘Yes’ to question 1 (see below)
-
disabled if they answer ‘Yes’ to question 1 and either ‘Yes, a little’ or ‘Yes, a lot’ to question 2
-
disabled, limited a lot if they answer ‘Yes’ to question 1 and ‘Yes, a lot’ to question 2
| Questions | Response options | ||
|---|---|---|---|
| 1. Do you have any physical or mental health conditions or illnesses lasting or expected to last 12 months or more? | Yes | No | |
| 2. Does your condition or illness reduce your ability to carry-out day-to-day activities? | Yes, a little | Yes, a lot | No |
Figure 1: Labour Force and Annual Population Surveys long-term health condition and disability question routing
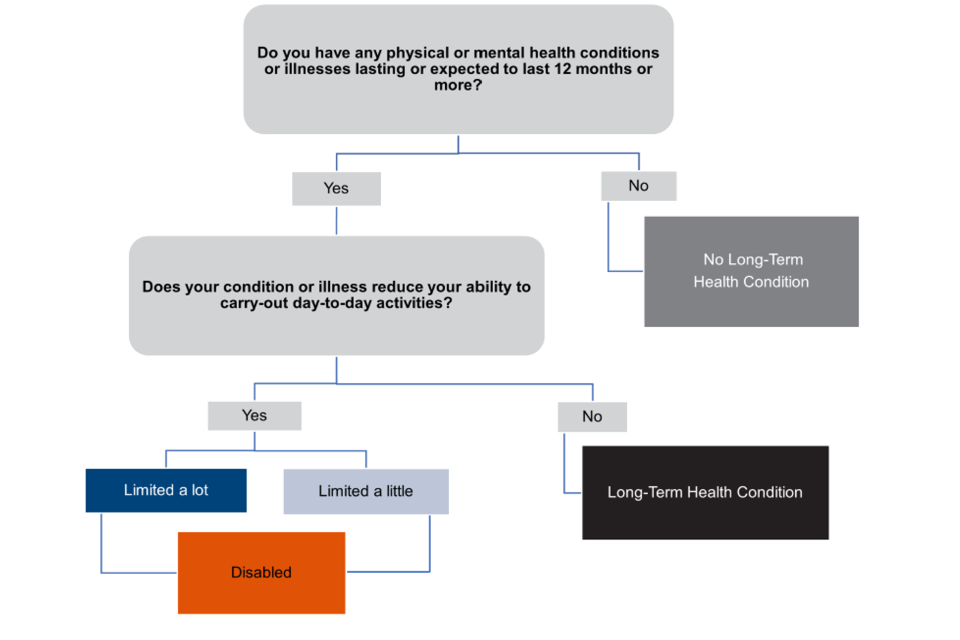
Less than 1% of the working-age population either don’t know or don’t answer both questions so have an unknown disability status.
Employment
Employment and other labour market concepts used in this release are defined in the same way as National Statistics published by the Office for National Statistics (ONS) in their Labour Market Overview. This in turn follows internationally agreed guidelines set out by the International Labour Organisation (ILO).
Seasonality
Quarterly estimates in this release are not seasonally adjusted. When comparing not seasonally adjusted data over time it is best practice to compare the same 3-month period for different years (for example, compare April to June 2013 with April to June 2023 but do not compare April to June 2013 with January to March 2023).
Data sources
Full definitions are given in the background information and methodology. Estimates in this release are based on versions of the Annual Population and Labour Force Surveys using the latest population weights.
The population totals used for the latest estimates use projected growth rates from Real-Time Information (RTI) data for UK, EU and non-EU populations based on 2021 patterns. The total population used therefore does not consider any changes in migration, birth rates, death rates, and so on, since June 2021, so levels estimates may be under- or over-estimating the true values and should be used with caution. Estimates of rates will, however, be robust.
The Office for National Statistics (ONS) are transforming the Labour Force Survey to increase the sample size (making it more representative of the population as a whole) and improve the methods for collecting data, including the flexibility to quickly change the questions so that they reflect the key needs of the day. The survey will move to an on-line first approach, supported by telephone collection and ‘knock to nudge’. This should provide more robust insights on the detailed characteristics of those within and outside work. The latest update on progress can be found at: Labour market transformation – update on progress and plans - Office for National Statistics (ons.gov.uk).
Statistical significance
All results in the commentary are statistically significant at the 95% level, unless stated. Differences in employment of groups with given characteristics are not necessarily caused by those characteristics.
We can use statistical significance to decide whether we think a difference between two survey-based estimates reflects a true change in the population rather than being attributable to random variation in our sample selection.
Statistical significance helps us to establish what observed changes or relationships we should pay attention to, and which apparent changes may have occurred only because of randomness in the sampling.
Rounding
Figures contained within this release are subject to additional rounding unless otherwise stated. The level of rounding applied, which is dependent on the magnitude of the figure being quoted, is shown in the table below.
Table showing statistical release rounding policy
| Range | Rounded to the nearest |
|---|---|
| 0 to 1,000 | 10 |
| 1,001 to 10,000 | 100 |
| 10,001 to 100,000 | 1,000 |
| 100,001 to 1,000,000 | 10,000 |
| 1,000,001 to 10,000,000 | 100,000 |
| 10,000,001 to 100,000,000 | 1,000,000 |
Users should note that percentages are calculated using numbers prior to rounding and rounded to one decimal place unless otherwise stated. Percentages therefore may not add up to 100%.
Accessibility
The supplementary data tables accompanying this release have been developed using Government Statistical Service (GSS) guidance on releasing statistics in spreadsheets.
4. Measures
The next section looks at the three main measures used to monitor disability employment:
-
the (absolute) number of disabled people in employment
-
the disability employment rate (the number of disabled people in employment divided by the number of disabled people)
-
the difference between the employment rates of disabled and non-disabled people (known as the disability employment gap)
Trends for each measure, starting from April 2013, when the current definition of disability began, are shown in Figures 2 to 4. The components or factors that may influence these measures are examined in Figure 5.
The number of disabled people in employment continues to rise
Figure 2: Number of disabled people in employment, people aged 16 to 64, UK, April to June 2013 to April to June 2023
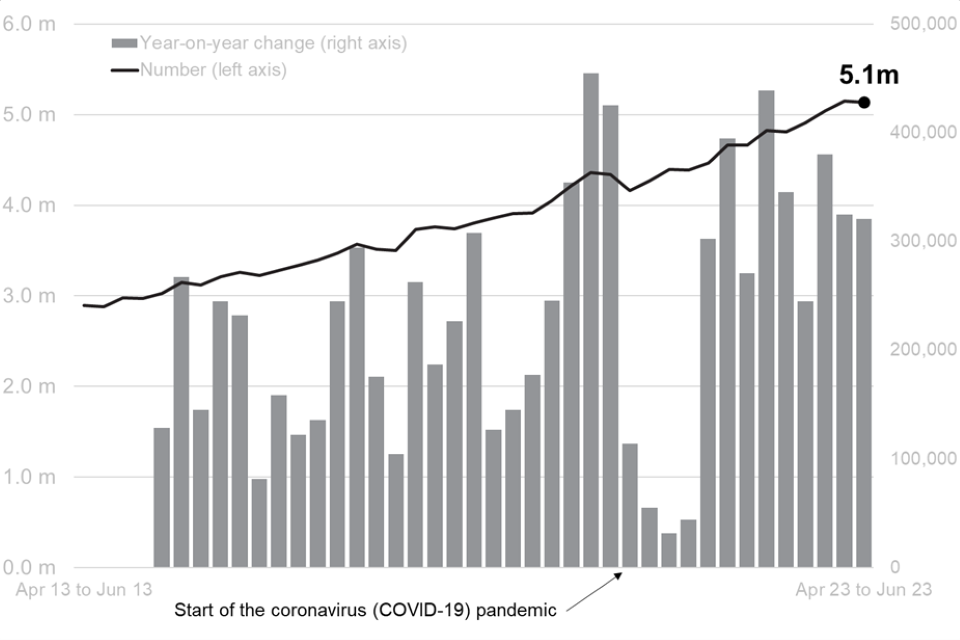
Source: Labour Force Survey – data and definitions can be found in supplementary data table MSR001
The number of disabled people in employment has increased by 2.2 million from 2.9m in April to June 2013 to 5.1 million in April to June 2023 (an increase of 77.2%). The number continued to increase (year-on-year) throughout the coronavirus (COVID-19) pandemic but at a much slower rate. The increase has now returned to its pre-pandemic trend with 1.1 million more disabled people in employment in April to June 2023 than there were in the same quarter in 2019.
The longer-term increases in disability employment can be linked to four main factors: disability prevalence; non-disabled employment rate; disability employment gap and working age population. See figure 4 for more details.
The disability employment rate has yet to return to its pre-pandemic trend
Figure 3: Disability employment rate, people aged 16 to 64, UK, April to June 2013 to April to June 2023
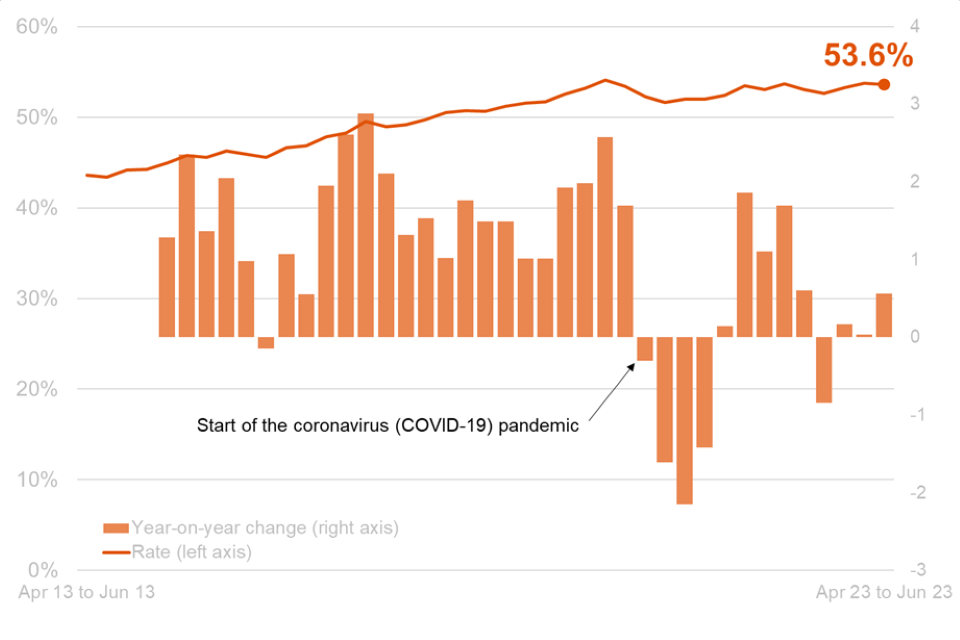
Source: Labour Force Survey – data and definitions can be found in supplementary data table MSR001
The disability employment rate has increased by 10.0 percentage points from 43.6% in April to June 2013 to 53.6% in April to June 2023. The rate began to fall (year-on-year) at the start of the coronavirus (COVID-19) pandemic before showing signs of recovery, with changes stabilising in the last year. The latest quarter (April to June 2023) showed the rate increased by 0.6 percentage points (compared to the same quarter last year), however this increase is not statistically significant.
The disability employment gap has stabilised in the last four years
Figure 4: Disability employment gap (percentage point), people aged 16 to 64, UK, April to June 2013 to April to June 2023
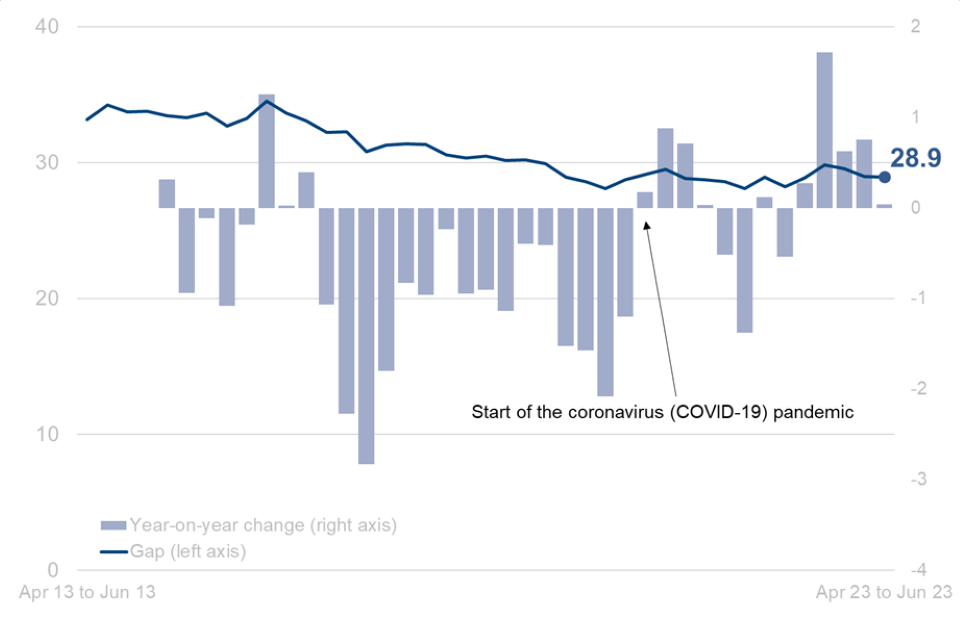
Source: Labour Force Survey – data and definitions can be found in supplementary data table MSR001
The disability employment gap has decreased by 4.2 percentage points from 33.1 percentage points in April to June 2013 to 28.9 percentage points in April to June 2023. The gap started to widen (year-on-year) at the start of the coronavirus (COVID-19) pandemic which was the first time this had happened in four years.
Whilst there have been some signs of the gap narrowing again, the latest quarter (April to June 2023) showed the gap had remained unchanged compared to the same quarter last year and the same quarter in 2019. This was driven by an equal rise in the disability employment rate (0.6 percentage points) and a rise in the non-disabled employment rate (also 0.6 percentage points).
The increasing number of disabled people in employment is associated with four main components of change
There are four main components of change in the number of disabled people in employment:
-
overall working-age population
-
disability prevalence
-
non-disabled employment rate
-
disability employment gap
Each of these factors has contributed to the increased number of disabled people in employment since April to June 2013. However, it is not possible to directly measure the impact of each component because they interact with each other.
These estimates are intended to give a broad indication of the impact of the different components. They tell us about the components of change, but not the causes. Neither do they capture all interactions. For example, an increase in disability prevalence could impact the disability employment gap, even without any changes in employment, if prevalence increased faster among those already in work than among those out of work.
The increasing number of disabled people in employment is most associated with rising disability prevalence
Figure 5: Number of disabled people in employment by component of change, people aged 16 to 64 years, UK, April to June 2013 to April to June 2023
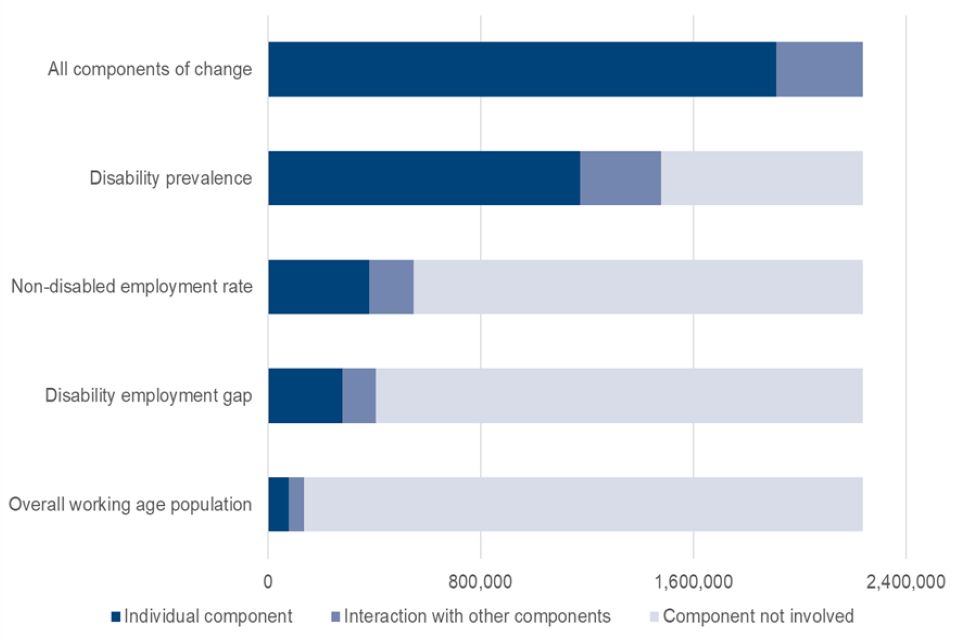
Source: Labour Force Survey – data and definitions can be found in supplementary data table MSR002
Figure 5 shows how much of this increase may be attributed to the four components of change. For each component, a range is given. The lower end of the range shows the estimated impact of that component in isolation (dark blue bar); the upper end gives the impact including all interaction effects with the other components (mid-blue bar) and the light blue shaded area is any increase where the component is not involved. Therefore, the same interaction effects can appear in the chart under more than one component. However, taken as a whole, these interactions had a relatively small impact.
For an example calculation, and for more information on the method applied to calculate the components of change, see background information and methodology.
The impact of each component on the increase in the number of disabled people in employment is estimated as:
-
60% for disability prevalence (1,170,000 to 1,480,000)
-
20% for non-disabled employment rate (380,000 to 550,000)
-
15% for disability employment gap (280,000 to 410,000)
-
5% for working age population (80,000 to 130,000)
The increase in disability prevalence is associated with an increase in people reporting mental health conditions and “other health problems or disabilities”. This is covered in more detail in the next section.
International Comparisons
The OECD released a report in October 2022 that looked at rates of disability prevalence and employment across OECD nations. This showed that the disability employment gap in the UK had narrowed between 2012-2015 and 2016-2019 unlike in most other OECD countries. However, the UK gap was still above the OECD average in 2016-2019.
However, caution should be used when making direct comparisons regarding disability statistics between countries due to differences in disability definitions and population demographics, as well as stigma, perception, and awareness of disability across countries and within countries over time.
5. Populations
The next section looks at how the working-age population has changed over the last 10 years. In particular, the changes in the number of people who report having a long-term health condition or are classed as disabled and how these are associated with different demographics.
Nearly one in four of the working-age population are classed as disabled
Figure 6: Proportion of the population with a long-term health condition, classed as disabled, including those limited a lot, people aged 16 to 64 years, UK, 2022/2023
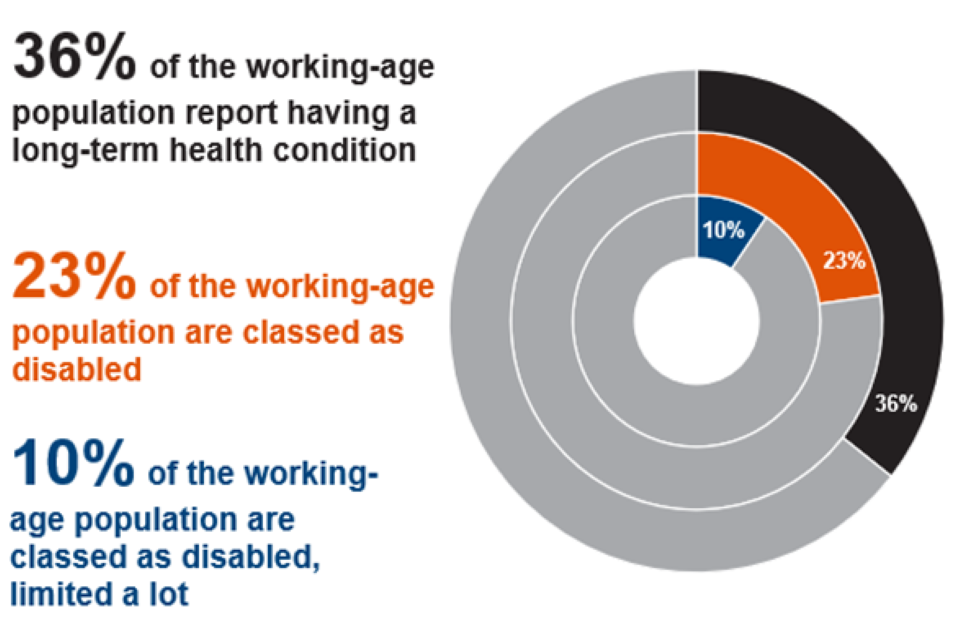
Source: Annual Population Survey – data and definitions can be found in supplementary data table POP001
Research published by the Government Statistical Service (GSS) in March 2023 showed that during cognitive interviews some respondents felt that the difference between an activity being “a little” and “a lot” was subjective.
The number of people reporting a long-term health condition or classed as disabled continues to rise
Figure 7: Number of people with a long-term health condition, classed as disabled, including those limited a lot, people aged 16 to 64, UK, 2013/14 to 2022/23
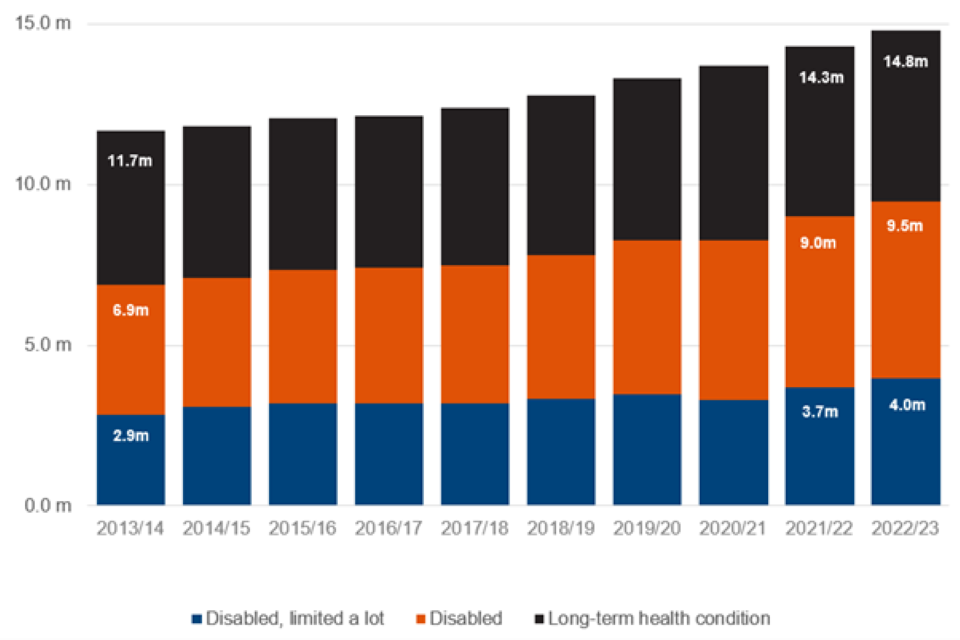
Source: Annual Population Survey – data and definitions can be found in supplementary data table POP001
The working-age population in the UK has increased by 1.0 million (2.5%) in last 10 years from 40.6 million (2013/2014) to 41.6 million (2022/2023). The rate of increase had slowed in the recent years, increasing by an average of 0.1% a year between 2020/2021 and 2021/2022 compared to an average of 0.4% a year between 2013/2014 and 2014/2015. However, the rate of growth between 2021/2022 and 2022/2023 returned to approximately 0.4%.
Between 2013/2014 and 2022/2023, the number of people reporting a long-term health condition increased by 3.1 million (26.8%). Of those with a long-term health condition, the number of people who reported their condition limited their day-to-day activities (classifying them as disabled) increased by 2.6 million (37.6%). Of those, the number who reported their day-to-day activities were limited a lot increased by 1.1m (39.0%). For context the increase in number (1.1 million) is greater than for the working-age population as a whole during the same period (1.0 million).
The number and rate of people reporting a long-term health condition or classified as disabled (including those whose day-to-day activities were limited a lot) is increasing faster in the latest years than in each of the years between 2013/2014 and 2018/2019.
The period of 2022/2023 saw an increase in the number of people reporting a long-term health condition (510,000 or 3.6%), classified as disabled (480,000 or 5.3%) and disabled, limited a lot (260,000 or 7.1%). However, the increase has been slower in 2022/2023 compared to 2021/2022, which saw the largest annual increase since 2013/14 in the number of people reporting a long-term health condition (610,000 or 4.4%), classified as disabled (730,000 or 8.8%) and disabled, limited a lot (410,000 or 12.3%).
The longer-term increase in the number of disabled people could be due to several factors, including changes in public awareness and attitudes towards disability. However, we have seen in other functional based surveys which do not rely on people self-reporting disability that these are not the only factors. For example, the Adult Psychiatric Morbidity Survey (APMS) shows increases in prevalence for some conditions which may be due to changes in society and health, including behaviours associated with diet and levels of physical activity. The latest version of the APMS was for 2014 with the next version currently in the field.
The increase in disability prevalence is associated with an increase in people reporting mental health conditions and “other health problems or disabilities”
The number of disabled people with a mental health condition as their main condition has increased by 1.2 million (97.0%) between 2013/2014 and 2022/2023. This is mainly from people reporting depression, bad nerves or anxiety which saw a 930,000 (112.6%) increase. There has also been a large increase in people reporting “other” health problems or disabilities (780,000 or 112.9%) between 2013/2014 and 2022/2023, the majority of which has occurred since 2019/2020.
This compares to musculoskeletal conditions which have shown a decrease of 44,000 (1.8%) in the same period, although this is not statistically significant. This varies by condition with problems or disabilities connected with arms or hands increasing by 18.8% and problems or disabilities connected with back or neck decreasing by 10.6%. However, this group still makes up around 40% of all people who reported a musculoskeletal condition as their main health condition in 2022/2023.
Despite the numbers falling there are still 2.3 million disabled people (24.7%) whose main health condition is musculoskeletal. There are also 1.6 million disabled people (16.8%) who report having both a mental health and a musculoskeletal condition.
Musculoskeletal (MSK) conditions include problems or disabilities connected with the arms, hands, legs, feet, back or neck. Mental health (MH) conditions include depression, bad nerves, anxiety, mental illness or other nervous disorders.
Figure 8: Change in the number of disabled people by age, gender and main health condition (MSK and MH only), people aged 16 to 64, UK, 2013/2014 to 2022/2023
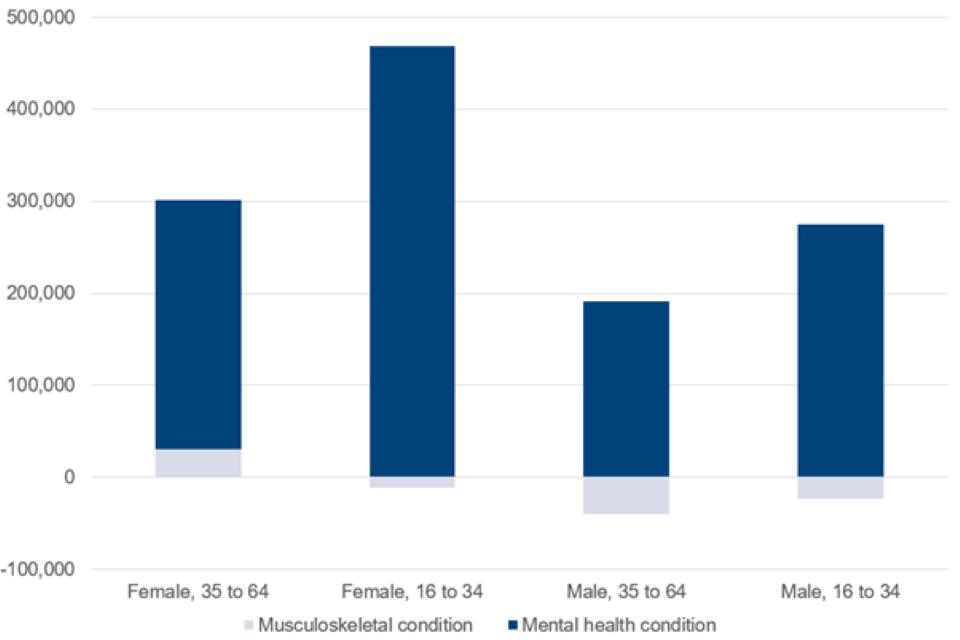
Source: Annual Population Survey – data and definitions can be found in supplementary data table POP002
Data for all health conditions is provided in the supplementary tables should alternative breakdowns be required.
The increase in the number of people being classed as disabled has been greater for:
-
women, 1.6 million (43.0%), compared to men, 960,000 (30.6%)
-
younger people (aged 16 to 34), 1.3 million (77.7%) compared to older people (aged 35 to 64), 1.3 million (24.6%)
The largest increases across age, gender and health condition were for women aged 16 to 34 with a mental health condition (as their main condition) who saw an increase of 470,000 (181%).
Independent research released by the Office for National Statistics (ONS) in December 2022, using the Opinions and Lifestyle Survey (OPN), examined instances of moderate to severe depressive symptoms amongst adults in Great Britain, providing a range of sub-analyses on predictors of depressive symptoms. Cost of living and depression in adults, Great Britain - Office for National Statistics (ons.gov.uk)
This found that around 1 in 6 (16%) adults experienced moderate to severe depressive symptoms; this is similar to rates found in Summer 2021 (17%), however higher than pre-pandemic levels (10%). When comparing within population groups, prevalence of moderate to severe depressive symptoms was higher among adults who were economically inactive because of long-term sickness (59%), unpaid carers for 35 or more hours a week (37%), disabled adults (35%), adults in the most deprived areas of England (25%), young adults aged 16 to 29 years (28%) and women (19%).
The House of Commons Library also published a summary, which provides further context, on “Mental health statistics: prevalence, services and funding in England” in March 2023”. This asks “How common are mental health conditions? How long do people wait to access NHS therapy for depression and anxiety? Do statistics show that mental health services work for everyone? How much is spent on mental health services?”
Some long-term health conditions are associated with a greater impact on a person’s day-to-day activities
Figure 9: Proportion of people with a long-term health condition, classed as disabled, including those limited a lot, by main health condition, people aged 16 to 64 years, UK, 2022/2023
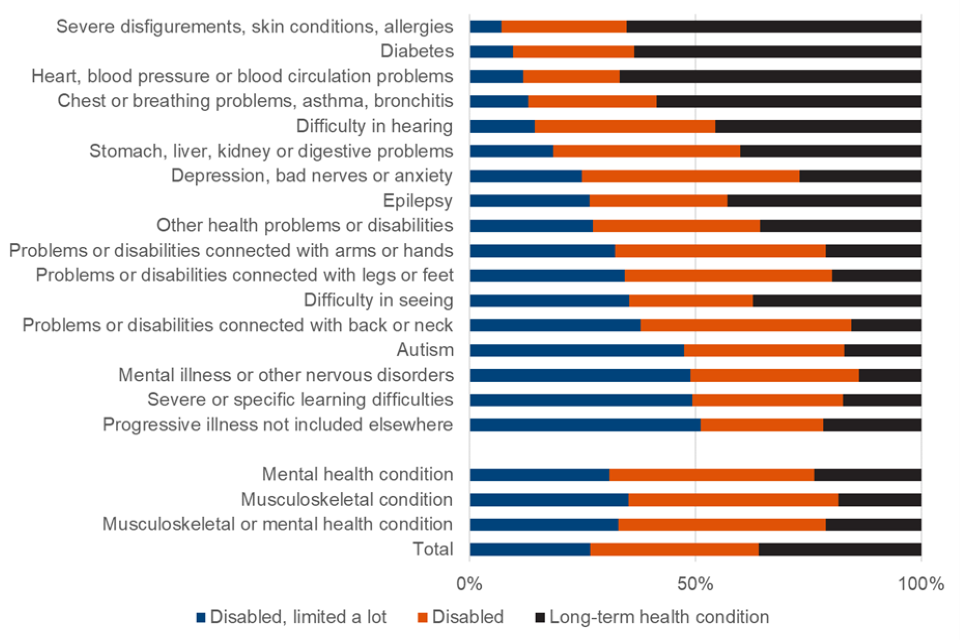
Source: Annual Population Survey – data can be found in supplementary data table POP003
Musculoskeletal (MSK) conditions include problems or disabilities connected with the arms, hands, legs, feet, back or neck. Mental health (MH) conditions include depression, bad nerves, anxiety, mental illness or other nervous disorders.
Data for all health conditions is provided in the supplementary tables should alternative breakdowns be required.
There are large differences on the impact a persons’ main long-term health condition has on their day-to-day activities. For example, 7.1% of those who reported severe disfigurements, skin conditions, allergies as their main condition said it affected their day-to-day activities a lot. In comparison, 51.1% of people with a progressive illness (not included elsewhere) and 49.4% of those with severe or specific learning difficulties said it affected their day-to-day activities a lot.
People with a mental health condition as their main long-term health condition were less likely to report that it limited their day-to-day activities a lot compared to people with a musculoskeletal condition (30.9% compared to 35.2%).
However, there is a large difference between the different groupings that make up the mental health condition figure. Of the people who reported depression, bad nerves, or anxiety 24.9% said their condition limited their day-to-day activities a lot. This compares to people with a mental illness or other nervous disorder where around twice this figure (48.8%) said their day-to-day activities were limited a lot, and this group makes up 25.1% of all those who report a mental health condition as their main condition.
Estimates for some long-term health conditions are based on small sample sizes and therefore subject to a higher degree of uncertainty. Sample sizes for all long-term health conditions can be found in supplementary data table POP003U. The equivalent data for main or secondary long-term health conditions can be found in supplementary data table POP004 and supplementary data table POP004U.
6. Labour market status
The next section looks at the labour market status of individuals, specifically whether they are in employment or not. Employment is defined as anyone who has done one or more hour of paid work and those who have a job that they are temporarily away from (for example, because they are on holiday or off sick).
The largest two categories within employment are employees and self-employed people; in recent years these two categories have accounted for over 99% of all people in employment. People who are not in employment will be either unemployed or economically inactive.
These breakdowns are shown for different characteristics, by disability status and over time.
The disability employment gap increases with age
Figure 10: Proportion of people in employment by disability status and age, people aged 16 to 64 years, UK, 2022/2023
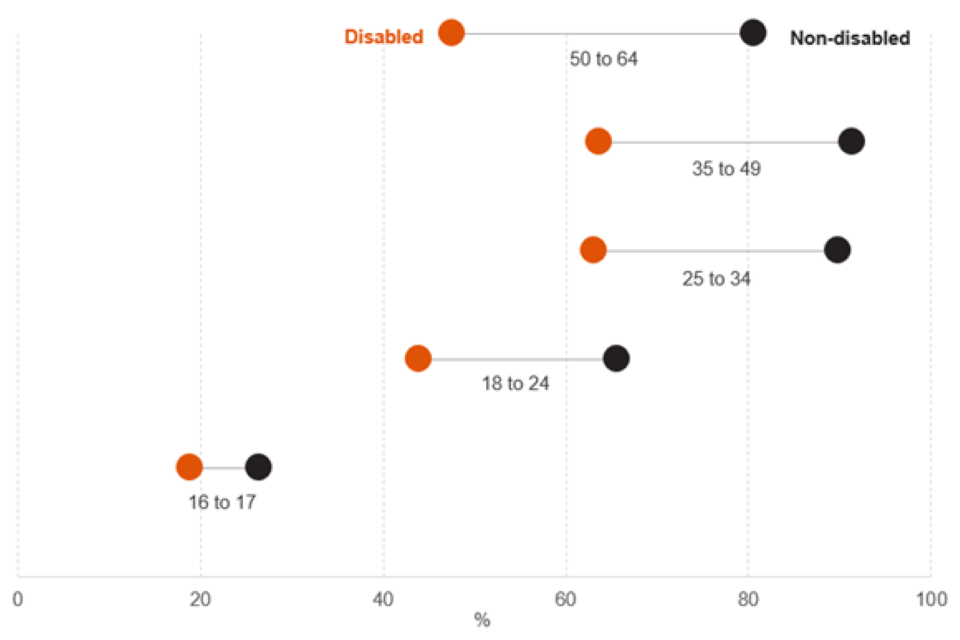
Source: Annual Population Survey – data and definitions can be found in supplementary data table LMS001
Employment rates for disabled people, across all ages, are lower than those of non-disabled people. For both disabled and non-disabled people, employment rates generally increase with age up to the age of 50 where they start to decrease. 16 to 17-year-olds have the lowest employment rates but this is because they are more likely to be in education or training than in employment.
The disability employment gap increases with age with those aged 50 to 64-years-old having the largest gap (32.9 percentage points compared to 21.6 percentage points for 18 to 24-year-olds).
The age-profile of the disabled population is skewed towards older individuals. For example, the 50 to 64-year-old age group makes up over 40% of the working-age disabled population, whilst the 18 to 24-year-old age group makes up just over 10% of the working-age disabled population. In comparison, the 50–64-year-old age group makes up approximately 30% of the non-disabled working-age population.
Disabled women are as likely to be in employment as disabled men
Figure 11: Proportion of people in employment by gender, disabled people aged 16 to 64 years, UK, 2013/2014 to 2022/2023
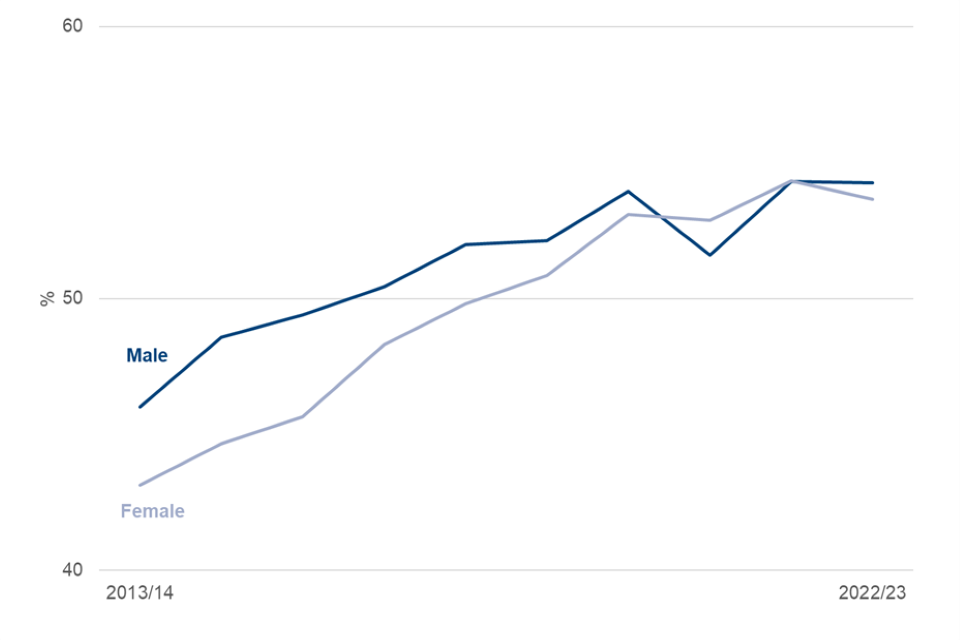
Source: Annual Population Survey – data and definitions can be found in supplementary data table LMS002
The gap between the employment rates of disabled women and men has been closing for several years. The rate for disabled men in 2022/2023 was estimated at 54.2%, marginally greater than for disabled women at 53.6%, but this difference is not statistically significant. This follows 2021/22, where the employment rates for disabled men and women were equal, with both estimated at 54.3%. The parity between men and women contrasts with non-disabled people where, in 2022/2023, women had an employment rate of 78.6% compared to 85.0% for men, a difference of 6.4 percentage points.
The employment rate for disabled women has increased by 10.5 percentage points since 2013/14, up from 43.1%, with the rate for men increasing more slowly - by 8.2 percentage points from 46.0% in 2013/2014.
Given the greater employment rate of non-disabled men compared to non-disabled women, the disability employment gap is narrower for women (25.0 percentage points compared to 30.8 percentage points for men).
However, the gap has widened for women by 1.8 percentage points in the last year, and therefore the gap has closed at a greater rate for men than women since 2013/2014 (3.8 percentage points for women and 5.4 percentage points for men).
Disabled people with a musculoskeletal condition are more likely than those with a mental health condition to be in employment
Figure 12: Proportion of people in employment by main or secondary health condition, people aged 16 to 64 years, UK, 2022/2023
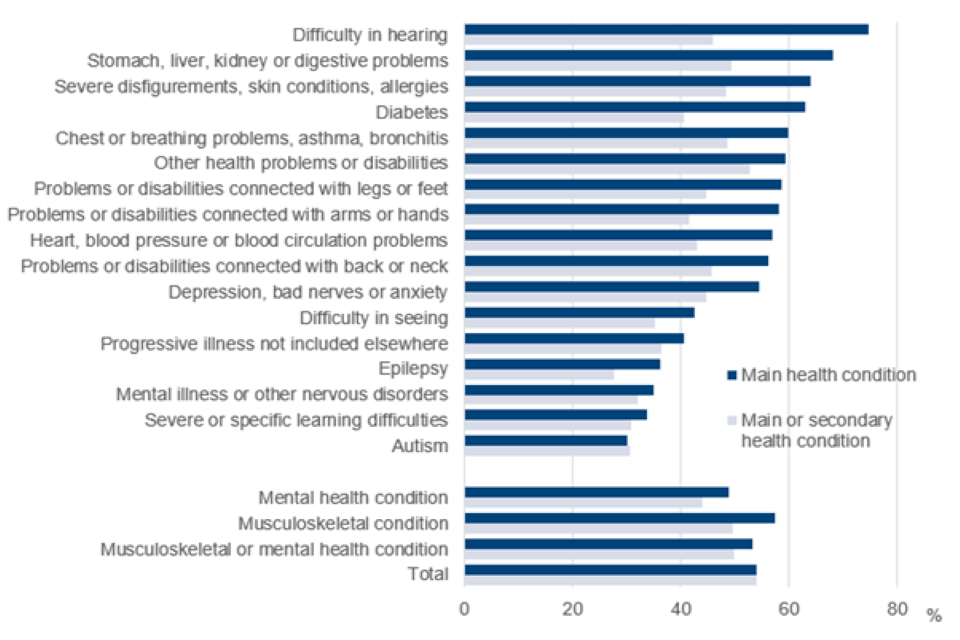
Source: Annual Population Survey – data and definitions can be found in supplementary data tables LMS003 and LMS004
Musculoskeletal (MSK) conditions include problems or disabilities connected with the arms, hands, legs, feet, back or neck. Mental health (MH) conditions include depression, bad nerves, anxiety, mental illness or other nervous disorders.
Data for all health conditions is provided in the supplementary tables should alternative breakdowns be required.
There is a lot of variation in employment rates of disabled people for different health conditions. For example, in 2022/2023, people whose main health condition is Difficulty in hearing are over twice as likely to be in employment compared to someone whose main health condition is Autism (74.7% compared to 30.0%). Disabled people with a musculoskeletal condition are more likely than those with a mental health condition to be in employment (57.5% compared to 48.9% where it is the main condition). However, 1.6m (or 16.8% of disabled people) report having both a musculoskeletal and a mental health condition.
Employment rates for health conditions where the condition is secondary are generally lower than those for main conditions. This is because people with a secondary condition will, by definition, have more than one health condition. We know that the more health conditions a person has the less likely they are to be in employment (see supplementary data table LMS005).
The impact a health condition has on an individual’s day-to-day activities is associated with their likelihood of being in employment
Figure 13: Proportion of disabled people in employment by proportion of individuals whose main condition limits their day-to-day activities a lot, people aged 16 to 64, UK, 2022/2023
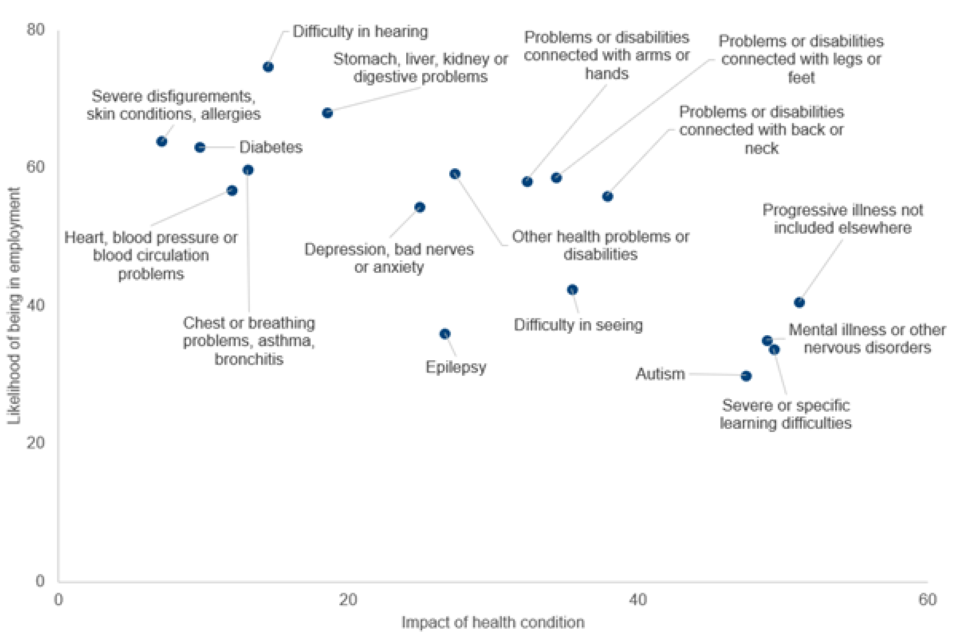
Source: Annual Population Survey – data and definitions can be found in supplementary data tables POP003 and LMS003
The difference in employment rates for different conditions is associated with the effect the condition has on a person’s day-to-day activities i.e., the greater the impact the lower chance they have of being in employment and vice-versa. Figure 13 displays a strong negative correlation (-0.8) between the employment rates of disabled people by main condition and the proportion of people with that condition who report that it limits their day-to-day activities “a lot”. A strong correlation does not necessarily mean that the impact of a health condition causes a person to be in or not in employment.
For example, 14.4% of people with Difficulty in hearing (the condition associated with the highest employment rate) reported their main condition affected their day-to-day activities “a lot” compared to 47.0% for Autism (the condition associated with the lowest employment rate) (see supplementary data table POP003).
Disabled people with one health condition are more than twice as likely to be in employment than those with five or more conditions
Figure 14: Proportion of people in employment by number of health conditions, people aged 16 to 64 years, UK, 2022/2023
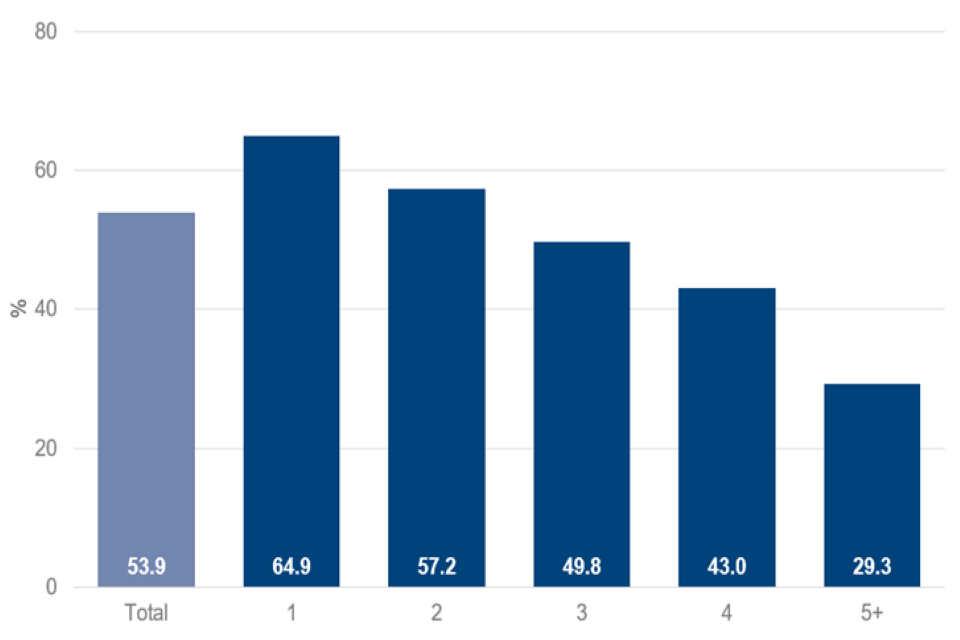
Source: Annual Population Survey – data and definitions can be found in supplementary data table LMS005
The proportion of disabled people reporting more than one long-term health condition was generally falling prior to the coronavirus (COVID-19) pandemic - from 60.7% in 2013/2014 to 55.9% in 2019/2020. In 2020/2021 the proportion increased to 60.4%, and stands at 58.9% in 2022/2023, higher than the pre-pandemic figure.
64.9% of disabled people with one health condition were in employment in 2022/2023. This proportion continues to increase (from 57.4% in 2013/2014) and is 11.0 percentage points higher than the rate for all disabled people. Employment rates decline as the number of health conditions increases. Less than a third (29.3%) of disabled people with five or more health conditions were in employment in 2022/2023.
Non-disabled people with no formal qualifications are as likely to be employed as disabled people with a highest qualification at A Level
Figure 15: Proportion of people in employment by disability status and highest qualification, people aged 16 to 64, UK, 2022/23
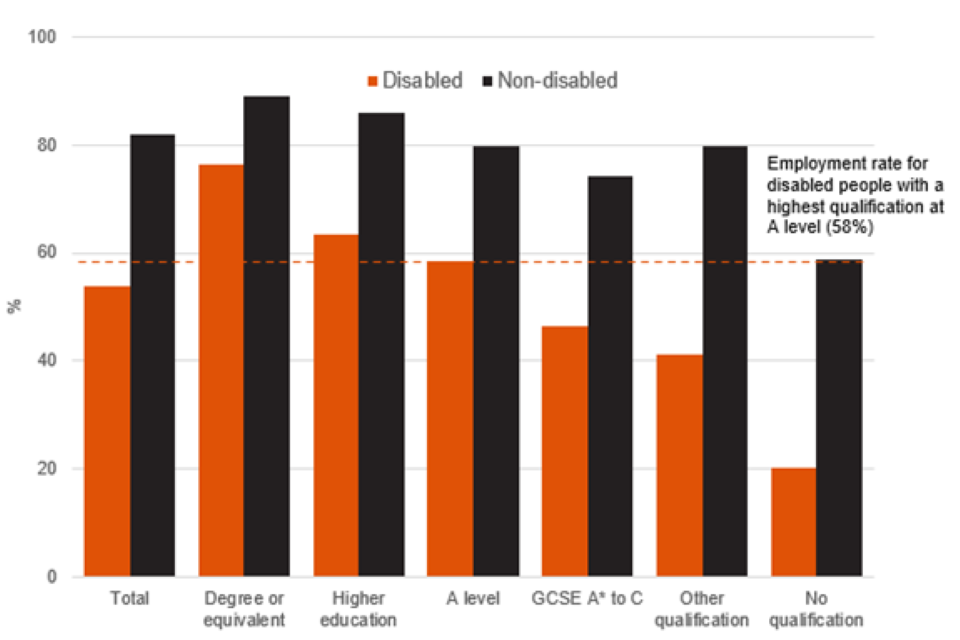
Source: Annual Population Survey – data and definitions can be found in supplementary data table LMS006
In education attainment, disabled people are less likely to have a degree or equivalent qualification than non-disabled people (25.6% for disabled people and 40.0% for non-disabled people), and more likely to have no qualifications (12.9% for disabled people and 5.0% for non-disabled people). However, since 2013/2014, the proportion of disabled people reporting a degree as their highest qualification has risen by 10.3 percentage points, compared to a rise of 11.4 percentage points for non-disabled people.
Generally, the higher the qualification a person has the more likely they are to be in work. However, disabled people are less likely to be in work at all qualification levels. Non-disabled people with a degree are around 12.7 percentage points more likely to be in work compared to their disabled counterparts. For those with no qualifications the difference is three times greater with non-disabled people around 38.7 percentage points more likely to be in work. Disabled people with a highest qualification at A level are around as likely (58.4%) to be in employment as a non-disabled person with no qualifications (58.9%).
Disabled people of Black/African/Caribbean/Black British and White ethnicity have the largest disability employment gaps
Figure 16: Proportion of people in employment by disability status and ethnicity, people aged 16 to 64 years, UK, 2022/23
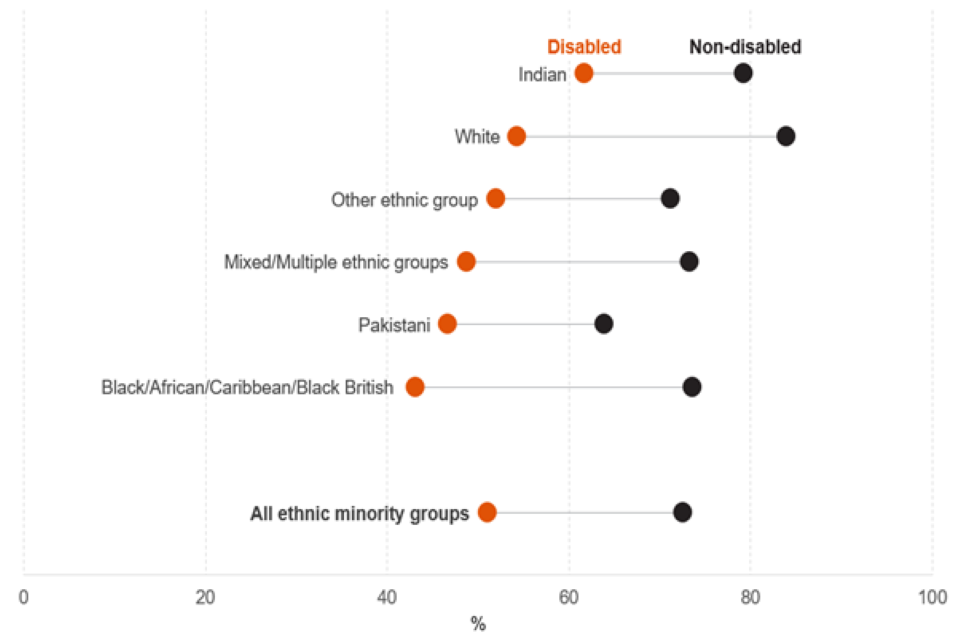
Source: Annual Population Survey – data and definitions can be found in supplementary data table LMS007
Disabled people of all ethnicities are less likely to be in employment compared to their non-disabled counterparts. People of Indian ethnicity have the highest disability employment rate (61.7%) whilst people of Black/African/Caribbean/Black British ethnicity have one of the lowest (43.2%).
As a result, disabled people of Black/African/Caribbean/Black British ethnicity have the largest disability employment gap (30.4 percentage points) for any ethnic minority group. This gap is marginally higher than the disability employment gap for people of White ethnicity (29.6 percentage points), albeit the difference is not statistically significant. Historically, the White ethnic population has had the widest disability employment gap, this is due in part to them also having the highest non-disabled employment rate, which holds in 2022/23 at 83.9%. The disability employment gap for all ethnic minority (non-White) groups is 21.5 percentage points.
Estimates for Bangladeshi, Chinese and any other Asian background ethnic groups are based on small sample sizes and subject to a higher degree of uncertainty and are therefore not included in this analysis. The data for all groups can be found in supplementary data table LMS007.
Disabled people living in social rented accommodation have the widest disability employment gap
Figure 17: Proportion of people in employment by disability status and housing tenure, people aged 16 to 64 years, UK, 2022/23
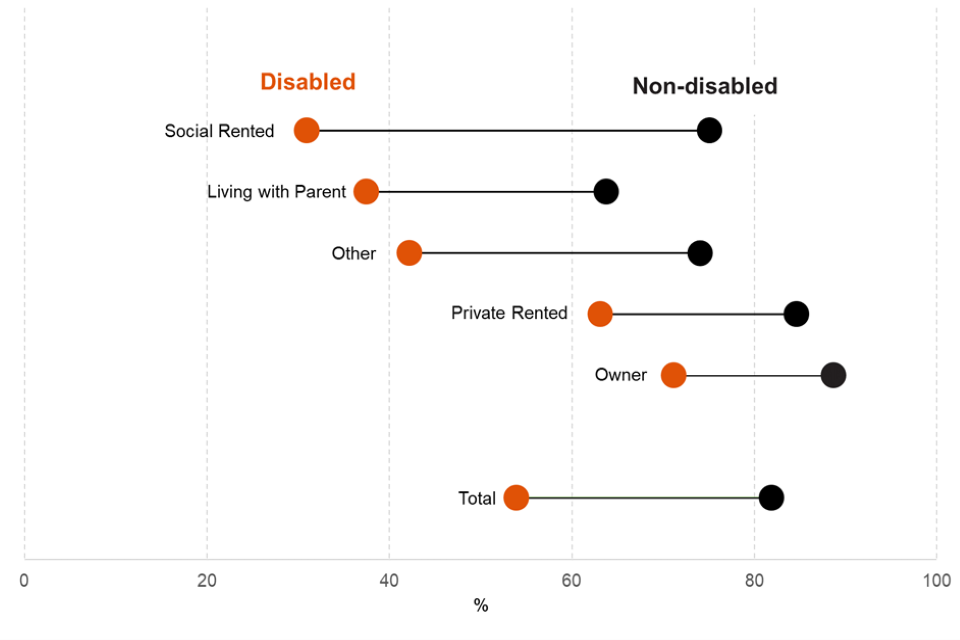
Source: Annual Population Survey – data and definitions can be found in supplementary data table LMS011
Disabled people are less likely to own a home than non-disabled people (39.8% compared to 54.9%), and more likely to be living in social housing (24.1% compared to 7.5%). However, they are similarly likely to be privately renting or living with a parent.
Individuals who own their home are the most likely to be in work, regardless of their disability status (88.7% for non-disabled people and 71.2% for disabled people), followed by those living in private rented accommodation. The housing tenures with the lowest employment rates are living with parents, and people living in social rented accommodation.
However, disabled people are less likely to be in work across all tenures. For example, non-disabled people living in a home they own are around 17.5 percentage points more likely to be in work compared to their disabled counterparts, the narrowest disability employment gap. For those living in social housing, the disability employment gap is widest, where non-disabled people living in social housing are 44.1 percentage points more likely to be in work compared to disabled people.
Disabled people not living in a couple are less likely to be employed and have a wider disability employment gap
Figure 18: Proportion of people in employment by disability and couple status, people aged 16 to 64, UK, April to June 2023
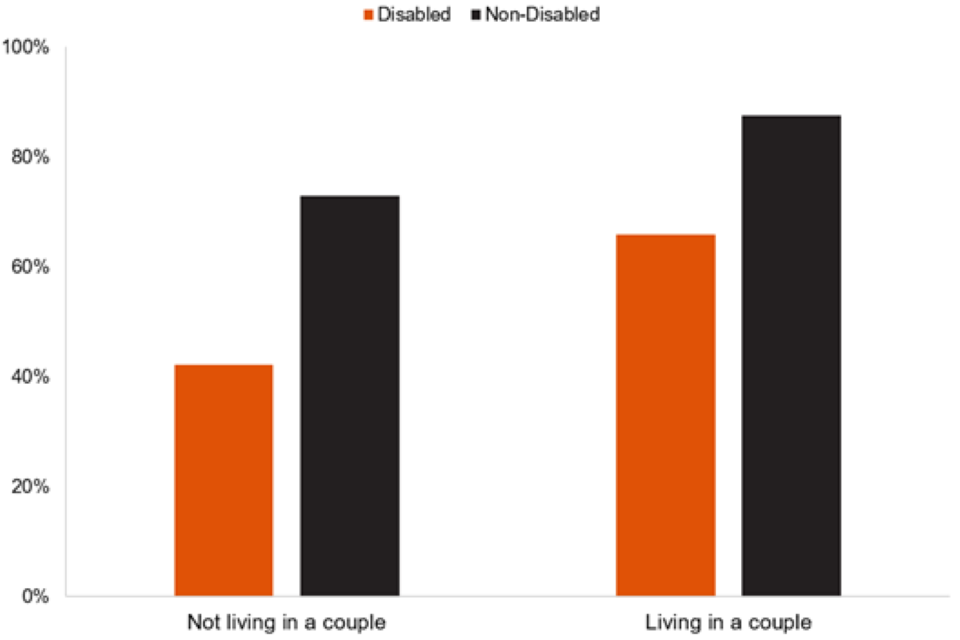
Source: Annual Population Survey – data and definitions can be found in supplementary data table LMS012
In April to June 2023, disabled individuals were less likely to be living in a couple than non-disabled individuals (52.9% compared to 63.2%).
Disabled individuals who are living in a couple are more likely to be in employment than disabled individuals who do not live in a couple (65.8% compared to 42.3%). This result holds for non-disabled individuals, but the difference is less pronounced (87.5% for living in a couple compared to 73.0% for not living in a couple). Hence, living in a couple is related to higher employment, regardless of disability status.
However, the disability employment gap is wider for individuals who do not live in a couple when compared to individuals who do live in a couple (30.7 percentage points compared to 21.7 percentage points).
Since the second quarter of 2015, the gap has narrowed by 8.1 percentage points for individuals who are living in a couple, driven by a 10.7% rise in the employment rate of disabled people living in a couple. The gap for individuals who are not living in a couple has also narrowed, but to a lesser extent (3.0 percentage points).
Living in a couple includes people who are Single, Widowed or Divorced and co-habiting and people who are Married or in a Civil Partnership and are living with their partner.
Despite falling across most areas of the UK there are still large differences in the disability employment gap in different parts of the country
Figure 19: Disability employment gap (percentage points) by country and region, people aged 16 to 64 years, UK, 2013/2014 and 2022/2023
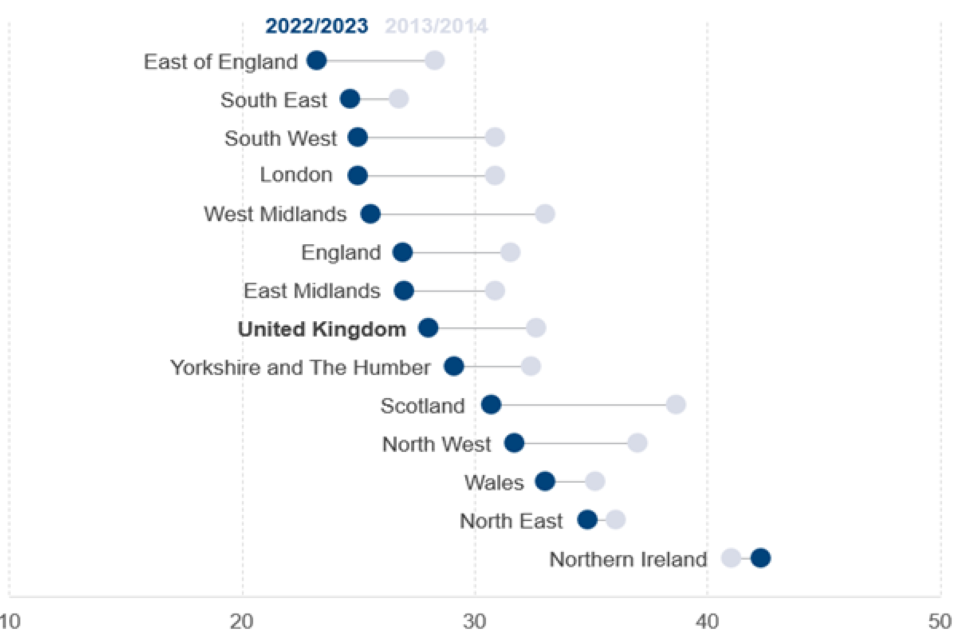
Source: Annual Population Survey – data and definitions can be found in supplementary data table LMS008
All areas of the UK have seen a reduction in the disability employment gap between 2013/2014 and 2022/2023 except Northern Ireland where the gap has increased by 1.3 percentage points.
The areas that ranked above the UK average in 2022/2023 were Northern Ireland, North East and North West of England, Wales, Scotland and Yorkshire and The Humber. East Midlands, West Midlands, London, South West, South East and the East of England ranked below.
East of England (1.4 percentage points) is the area that has seen the largest reduction in the disability employment gap in the past 12 months, albeit this fall is not statistically significant. However, Yorkshire and The Humber (3.7 percentage points) and West Midlands (3.0 percentage points) have seen the largest increases in the same period, where the rises on both occasions are statistically significant.
Local authorities with the largest disability employment gaps tend to be concentrated within certain areas of the country
Figure 20: Disability employment gap (percentage points) by Local Authority, people aged 16 to 64 years, Great Britain, 2020 to 2022
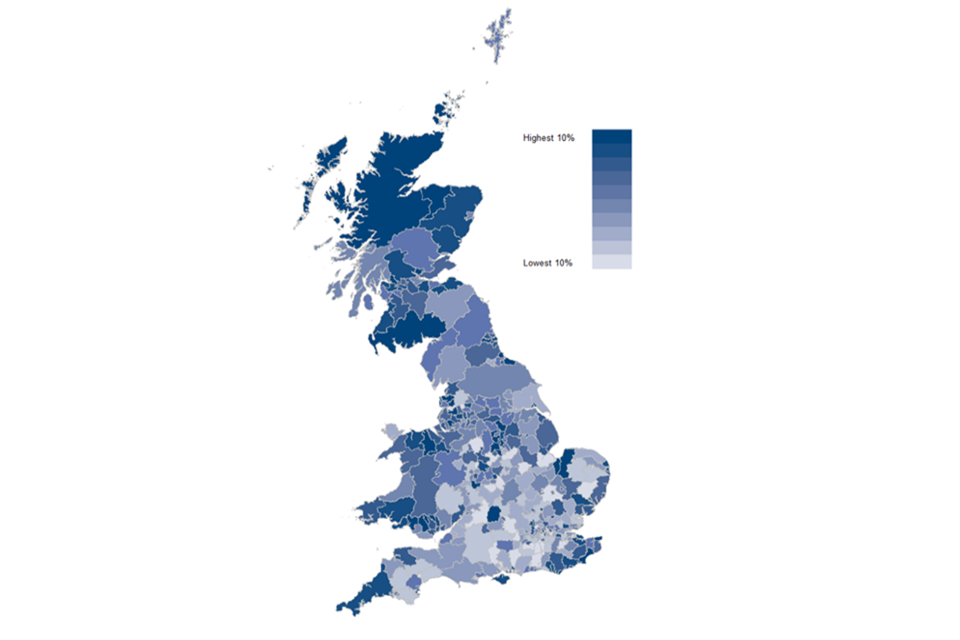
These estimates are based on survey data, in general there is a higher degree of uncertainty around estimates at a Local Authority level because at this granular level the sample sizes are small. Historic level trends can be volatile.
Source: Annual Population Survey – data and definitions can be found in supplementary data table LMS009
Local Authorities with the largest disability employment gaps can be found across most regions and countries of the UK. However, many of these are concentrated in Scotland, Wales, and the North East of England. For example, Local Authorities with the largest (top 20%) disability employment gaps include the Highlands and Moray in Scotland (44.5 and 40.0 percentage points), Blaenau Gwent and Merthyr Tydfil in Wales (46.8 and 43.9 percentage points) and Redcar and Cleveland in the North East of England (38.8 percentage points).
In contrast, Local Authorities with the smallest disability employment gaps tend to be found in the South and East of Great Britain. Local Authorities with the lowest disability employment gap (bottom 20%) include Exeter (3.3 percentage points), Horsham (5.5 percentage points) and East Hampshire (6.9 percentage points), amongst others.
Research conducted by the Office for National Statistics (ONS) used 2021 census data to analyse health and disability, identifying higher rates of prevalence in parts of the North of England, the Midlands and Wales. The research paper proposes that geographic disparities in health outcomes may be connected to the legacy of the industrial revolution. This research used age-standardisation to account for the age-profile of the area when analysing prevalence.
Data for Northern Ireland is not available below country level and is therefore not shown in the Local Authority map above (Figure 20). Data for all Local Authorities, regions and countries of the UK, including Northern Ireland, can be found in supplementary data table LMS009. The equivalent data for Parliamentary Constituencies can be found in supplementary data table LMS010.
7. Employment
The next section looks at differences between disabled and non-disabled people who are in employment.
Disabled workers are more likely to work in the Health, Retail and Education industries
Figure 21: Percentage of people employed in each industry by disability status, people aged 16 to 64 years, UK, 2022/2023
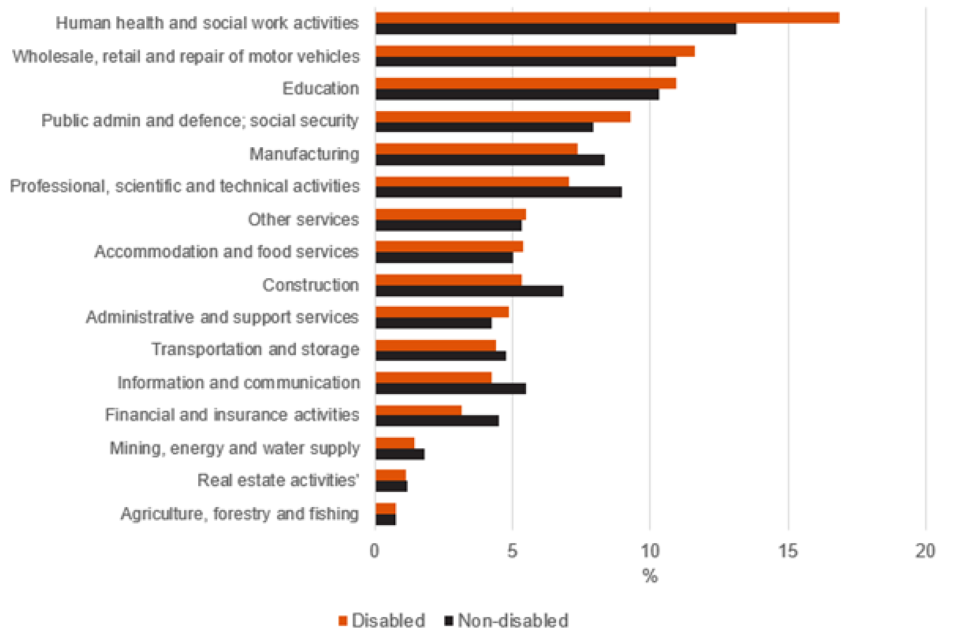
Source: Annual Population Survey – data and definitions can be found in supplementary data table EMP001
In 2022/2023 both disabled and non-disabled workers (including those who are self-employed) were most likely to be working in the following industries:
-
Human health and social work activities
-
Wholesale, retail and repair of motor vehicles
-
Education
These three industries made up 39.5% of disabled people in employment and 34.4% of non-disabled people in employment. Disabled people are more likely than non-disabled people to be working in these three industries.
The industries, in 2022/2023, where disabled workers were most likely to be under-represented, compared to non-disabled workers, are:
-
Professional, scientific and technical activities (7.1% of disabled workers compared to 9.0% of non-disabled workers)
-
Construction (5.3% compared to 6.8%)
-
Financial and insurance activities (3.2% compared to 4.5%)
-
Information and communication (4.3% compared to 5.5%)
-
Manufacturing (7.3% compared to 8.3%)
When analysing the age and gender demographics of disabled workers by industry, the notable differences (which were also seen for non-disabled workers) were:
-
Accommodation and food services (9.5% of disabled workers aged 16-34 compared to 3.5% of disabled workers 35-64)
-
Education (6.6% of disabled working men compared to 14.3% of disabled working women)
-
Human health and social work activities (6.8% of disabled working men compared to 24.5% of disabled working women)
Disabled workers are less likely to be in higher-skilled occupations
Figure 22: Proportion of people employed in each occupation by disability status, people aged 16 to 64 years, UK, 2022/2023
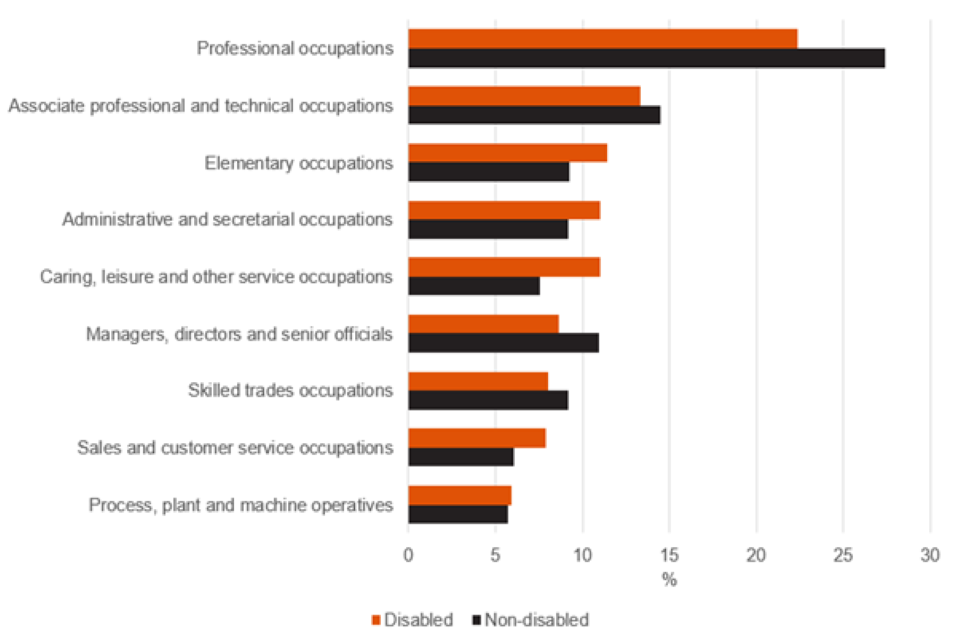
Source: Annual Population Survey – data and definitions can be found in supplementary data table EMP002
Both disabled and non-disabled workers were most likely to be working in Professional occupations and least likely to be working as Process, plant and machine operatives in 2022/2023.
Disabled workers were less likely to be in higher skilled occupations such as, Managers, directors and senior officials; Professional occupations; Associate professional and technical occupations, than non-disabled workers. However, the proportion of disabled workers in these occupations has increased over the past nine years, from 37.5% in 2013/2014 to 44.3% in 2022/2023.
Disabled workers were also more likely to be working in Caring, leisure and other service occupations; Elementary occupations; Administrative and secretarial occupations and Sales and customer service occupations than non-disabled workers. Conversely, the proportion of disabled workers in these occupations has decreased over the past nine years, from 44.8% in 2013/2014 to 41.3% in 2022/2023.
When analysing the age and gender demographics of disabled workers by occupation, the notable differences (which were also seen for non-disabled workers) were:
-
Elementary occupations (14.9% of disabled workers aged 16-34 compared to 9.8% of disabled workers 35-64)
-
Skilled trade occupations (15.3% of male disabled workers compared to 2.4% of female disabled workers)
-
Caring, leisure and other service occupations (5.0% of male disabled workers compared to 15.7% of female disabled workers)
Occupation data for 2020/2021 and 2021/2022 has been revised following a coding error identified in the collection of Standard Occupational Classification 2020 (SOC20) data for the Office for National Statistics (ONS) Labour Force and Annual Population Surveys. More information can be found at: Revision of miscoded occupational data in the ONS Labour Force Survey, UK - Office for National Statistics
Disabled workers are more likely than non-disabled workers to be self-employed
Figure 23: Proportion of people in employment who are self-employed by disability status, employed people aged 16 to 64 years, UK, 2013/2014 to 2022/2023
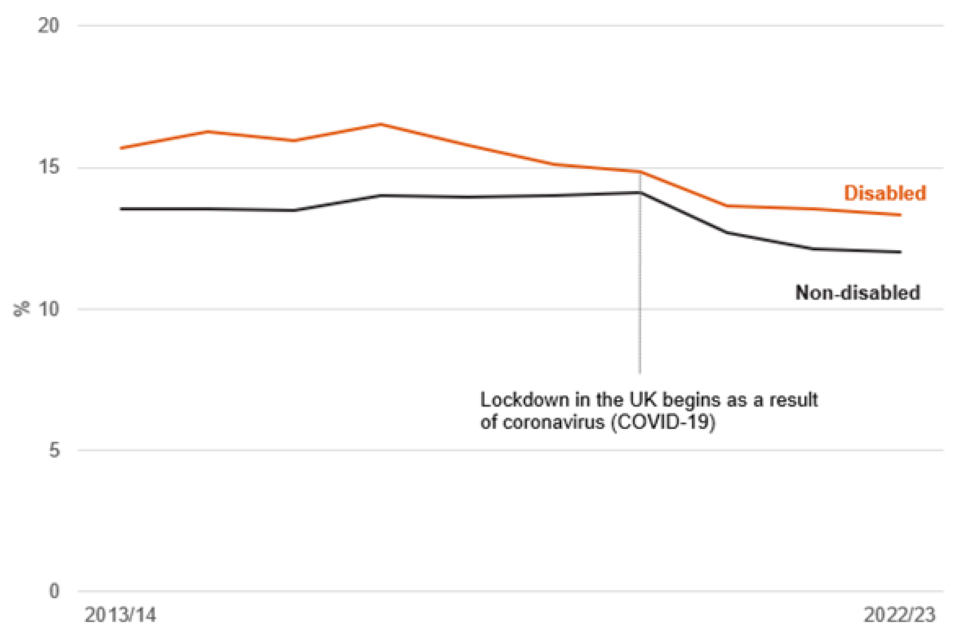
Source: Annual Population Survey – data and definitions can be found in supplementary data table EMP003
The proportion of disabled workers who are self-employed has decreased by 2.3 percentage points from 15.7% in 2013/2014 to 13.3% in 2022/2023. This compares to non-disabled workers where the proportion has fallen by 1.5 percentage points from 13.5% to 12.0% over the same period.
The difference between the proportion of disabled and non-disabled workers who are self-employed decreased to a seven-year low (0.8 percentage points) in 2019/2020. However, the difference stands at 1.3 percentage points in 2022/2023, despite both the proportion of disabled and non-disabled people working in self-employment falling since 2019/2020.
Falls in self-employment during the coronavirus (COVID-19) pandemic, for disabled and non-disabled workers, may in part be explained by a shift in people reclassifying themselves from self-employed to employees. This coincided with the introduction of the furlough scheme. The following article covers this in more depth: Understanding changes in self-employment in the UK - Office for National Statistics (ons.gov.uk)
One in three disabled workers are working part-time
Figure 24: Percentage of people in employment by disability status and working pattern, people aged 16 to 64 years, UK, 2022/2023
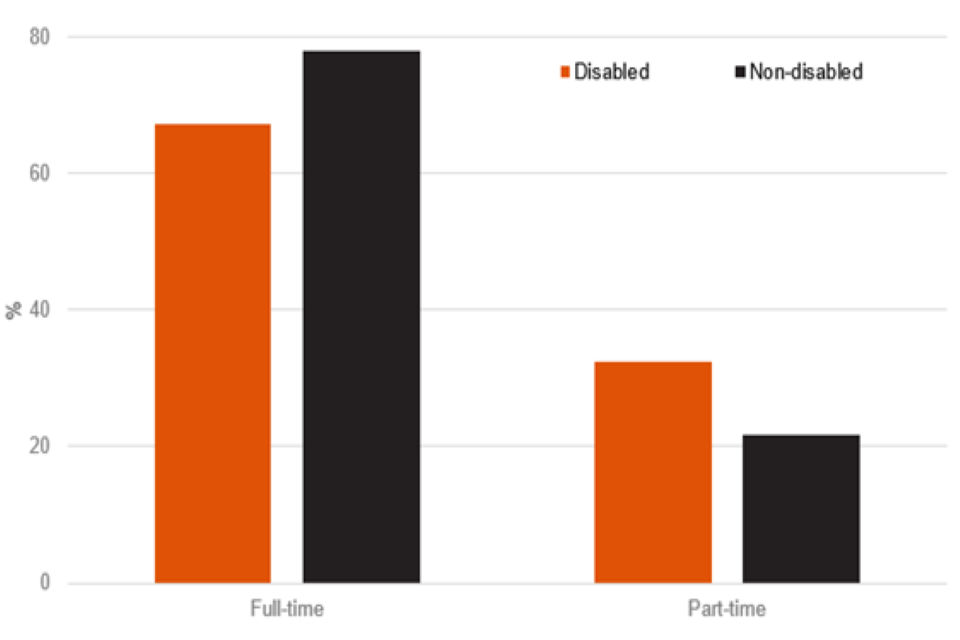
Source: Annual Population Survey – data and definitions can be found in supplementary data table EMP004
Disabled workers are more likely to be working part time, with 32.4% of disabled workers and 21.8% of non-disabled workers working part-time. Between 2013/2014 and 2022/2023 these proportions have decreased for both disabled and non-disabled workers. However, the proportion of workers working part-time has decreased more slowly (by 1.4 percentage points) for disabled workers than for non-disabled workers (by 2.8 percentage points, after rounding).
The split between full-time and part-time employment is based on respondents’ self-classification.
Disabled workers are more likely to be employed in the public sector
Figure 25: Proportion of people in employment by disability status and sector, employed people aged 16 to 64, UK, 2022/2023
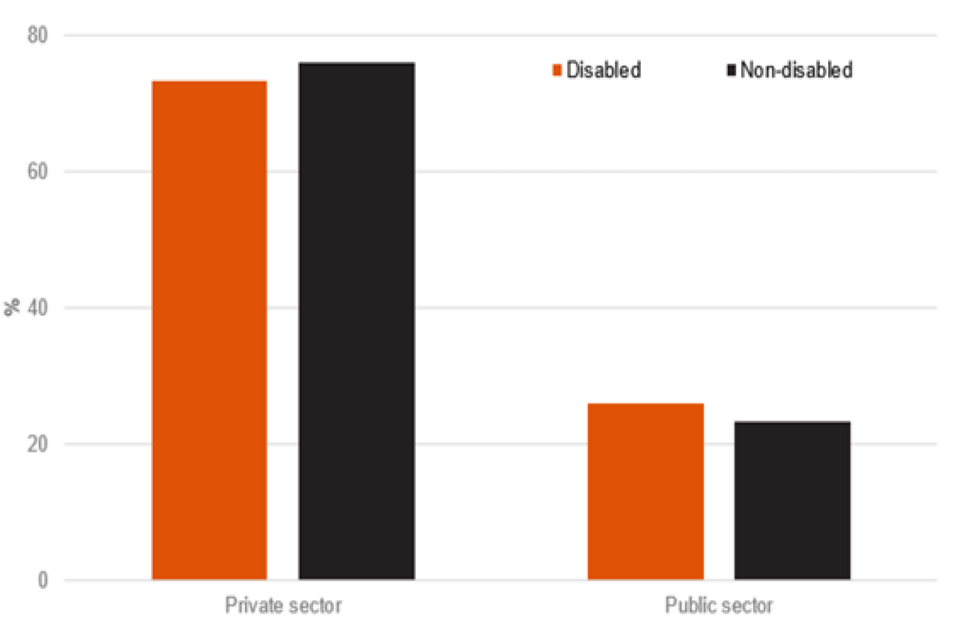
Source: Annual Population Survey – data and definitions can be found in supplementary data table EMP005
Disabled workers are less likely to be working in the private sector than non-disabled workers and consequently more likely to be working in the public sector. For both disabled and non-disabled workers around three times as many people work in the private sector compared to the public sector.
These patterns are related to the industries people work in (see supplementary data table EMP001). For example, disabled people are more likely to work in Human health and social work activities, Education and Public admin and defence; social security which are predominately public sector industries.
The proportion of disabled people working in the public sector remained relatively stable between 2014/2015 and 2019/2020 – 23.5% to 23.7%. In 2020/2021 – the first year of the coronavirus (COVID-19) pandemic – the proportion increased to 26.5%. In 2022/2023 the proportion was 26.0%, which is 2.3 percentage points above that seen prior to the pandemic.
Disabled employees are more likely to be working for small employers and less likely to be working for a large employer
Figure 26: Proportion of people in employment by disability status and employer size, employees aged 16 to 64, UK, 2022/2023
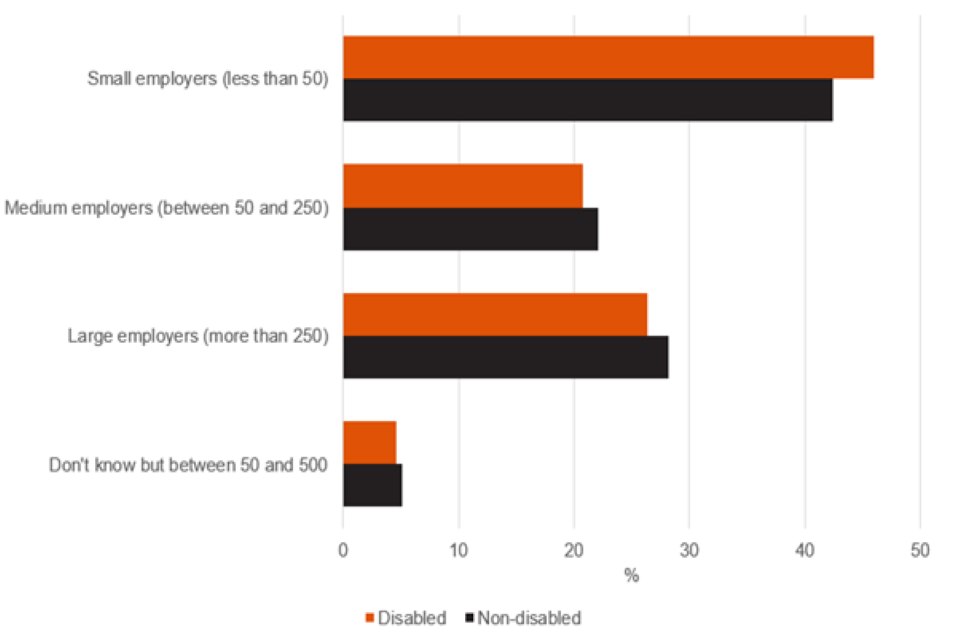
Source: Annual Population Survey – data and definitions can be found in supplementary data table EMP006
Disabled employees (excluding people who are self-employed) are more likely than non-disabled employees to be working for small employers and less likely to be working for a medium employer or a large employer.
There has been a shift since 2014/2015 with both disabled and non-disabled employees more likely to work for large employers and less likely to work for a small employer. Small employers however still make up the largest group – 43.0% of all employees in 2022/2023.
Disabled employees are more likely than non-disabled employees to be underemployed
Figure 27: Proportion of people who are underemployed by disability status, employed people aged 16 to 64, UK, April to June 2020 to April to June 2023
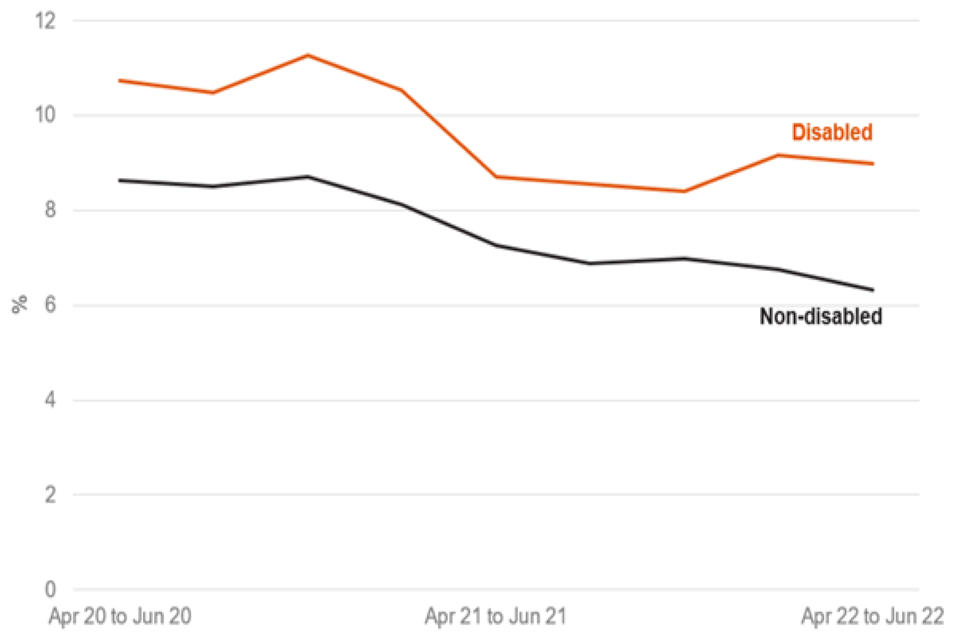
Source: Annual Population Survey – data and definitions can be found in supplementary data table EMP011
The underemployment rate for disabled workers in April to June 2023 was 9.8% compared to 6.8% for non-disabled workers. There has been a fall of 1.0 percentage point (from 10.7%) for disabled workers (this change was not statistically significant) and 1.8 percentage points (from 8.6%) for non-disabled workers compared to April to June 2020, which is the earliest comparable quarter available for this breakdown.
To be classed as underemployed, a person must either be looking for an additional job, looking for a new job with longer hours to replace their current (main) job, or wanting to work longer hours in their current job. In addition, they must also be available to start working longer hours within two weeks and their actual weekly hours worked must be 40 or less (for people aged under 18) or 48 or less (for people aged 18 and over).
8. Economic Inactivity
The next section looks at differences between disabled and non-disabled people who are in economic inactivity.
The number and percentage of economically inactive people classed as disabled has been rising since 2018/2019 – after falling for three years in a row. The number increased by 0.6 million between 2018/2019 and 2022/2023 from 3.4 million to 4.0 million. The percentage increased by 5.8 percentage points from 38.7% to 44.6% over the same period. In the last year, the number of economically inactive people who were disabled rose by 0.3m (or 2.9 percentage points), this was the largest increase since 2013/14.
This coincides with an increase in the number and percentage of working-age people who state the main reason for being economically inactive is long-term sickness, which reached a record-high of 2.6 million in April-June 2023.
A range of complex and interacting factors could be driving the rise in long-term sickness, as the main reason for being economically inactive, including NHS waiting lists, long COVID and changes in the demographics and health of the population.
The following Office for National Statistics (ONS) articles cover this in more depth: Half a million more people are out of the labour force because of long-term sickness and Rising ill-health and economic inactivity because of long-term sickness, UK.
In the second article the ONS say that “Long-term, self-reported ill health has been rising across the working-age population, especially since the onset of the coronavirus (COVID-19) pandemic. Also, between 2019 and 2022, the percentage of people who reported a long-lasting health condition that limits either the kind or amount of work they can do rose from 16.4% to 18.1%, and this rise in the work-limiting health conditions was the largest contributing factor to the rise in economic inactivity. For those individuals suffering with long-term health conditions who were in employment, the sickness absence rate in 2022 was 4.9%, the highest it has been since 2008 compared with 1.5% for those in employment without a long-term health condition.
Changes in the age composition of the population are one important contribution to long-term sickness volumes with the large number of “baby boomers” approaching retirement. It is estimated that around 40,000 extra people would be expected to become inactive because of long-term sickness between 2019 and 2022 as a result of these changes, although the actual change during this period was much larger (462,000).
The NHS referral to elective treatment waiting list in England, which increased from 4.6 million in January 2020 to 7.4 million in May 2023, may also have contributed to this increase. The Opinions and Lifestyle Survey on winter pressures found 33% of those inactive (excluding retired) were waiting for NHS treatment, of which 42% said it had “strongly impacted” their lives, 72% said it had affected their wellbeing and 50% said it had affected their mobility.”
However, analysis published by the Office for Budget Responsibility (OBR) in July 2023 states that “the rising NHS waiting list itself looks unlikely to have been a significant causal driver of rising long-term sick inactivity in recent year” for one reason being that “there appears to be limited correlation in waiting list trends by age and ‘treatment function’ between mid-2021 and the end of 2022 and concurrent changes in inactivity due to long-term sickness.”
Nearly three in every five economically inactive disabled people give long-term sickness as the main reason for being inactive
Figure 28: Proportion of economically inactive people by main reason and disability status, people aged 16 to 64, UK, 2022/2023
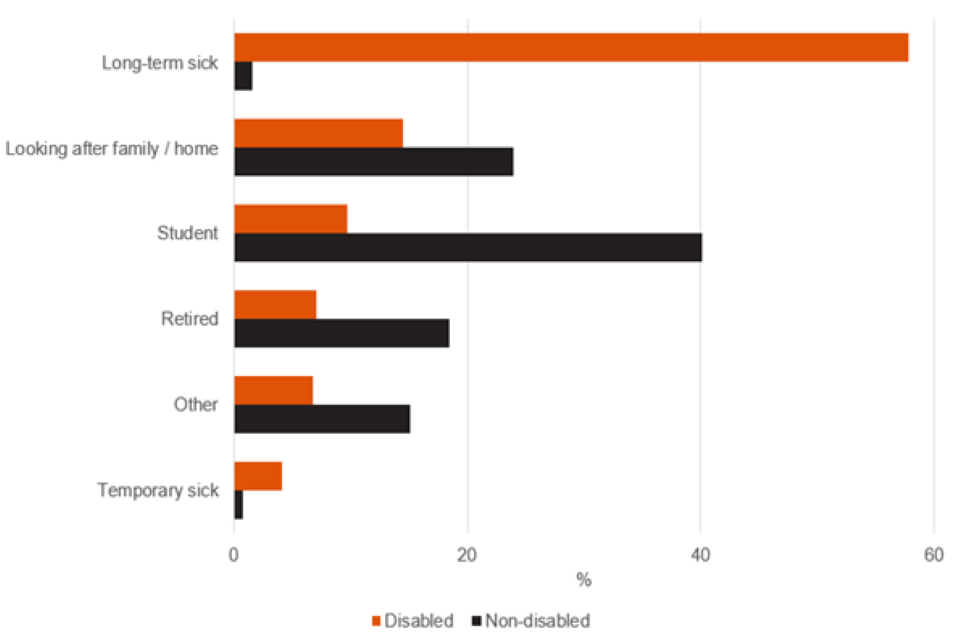
Source: Annual Population Survey – data and definitions can be found in supplementary data table EIA001
Long-term sickness is the main reason given by disabled people for being economically inactive (57.8% in 2022/2023). This has remained stable over the last nine years (57.4% in 2013/2014). The next three largest reasons given in 2022/2023 were looking after family / home (14.5%), being a student (9.7%) and retirement (7.1%).
Economically inactive non-disabled people were more likely to state their main reason for being inactive as being a student (40.1%), looking after family / home (23.9%) and retirement (18.5%), with only 1.6% stating long-term sickness.
Conversely, 96.1% of people who gave long-term sickness as their main reason for being economically inactive in 2022/2023 were disabled. This has remained stable at around 96% over the past nine years. This compares to looking after family / home (32.9% were disabled) and being a student (16.4% were disabled), which have increased by 11.8 and 7.4 percentage points respectively, and retirement which has decreased by 4.8 percentage points (23.9% were disabled).
For all economically inactive people the increase in the percentage classed as disabled between 2013/2014 and 2022/2023 was 8.4 percentage points.
Economically inactive people are more likely to want a job if they are disabled
Figure 29: Proportion of economically inactive people who want a job by disability status, economically inactive people aged 16 to 64, UK, 2013/2014 to 2022/2023
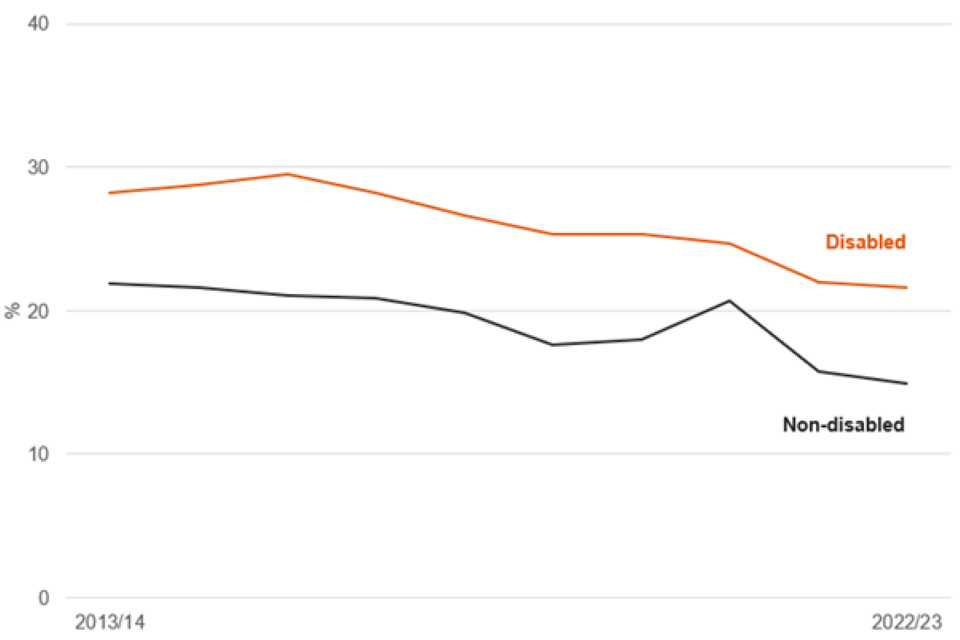
Source: Annual Population Survey – data and definitions can be found in supplementary data table EIA002
The proportion of economically inactive disabled people who wanted a job in 2022/2023 was 21.6%. This compares to non-disabled people where the equivalent figure was 14.9%. This may be explained by the reasons disabled and non-disabled people are more likely to give for being inactive (see Figure 28). Disabled people are less likely to be a student or retired, but these groups together, regardless of disability status, make up nearly half of all those who say they do not want a job (see supplementary data table EIA004 for figures by main reason for inactivity).
The proportions have generally fallen, for both disabled and non-disabled people, over the past nine years but the difference between the two is similar in 2022/2023 (6.7 percentage points) as it was in 2013/2014 (6.3 percentage points). Both rates remained stable in 2022/2023, with no change on the year.
This follows a fall between 2020/2021 and 2021/2022, which was larger than in any other year since at least 2013/2014. This was 2.7 percentage points for disabled people and 5.0 percentage points for non-disabled people (after rising during the first year of the coronavirus (COVID-19) pandemic).
Economically inactive disabled people are less likely to have had a job in the last two years
Figure 30: Proportion of economically inactive people by when left last job, age and disability status, people aged 16 to 64, UK, 2022/2023
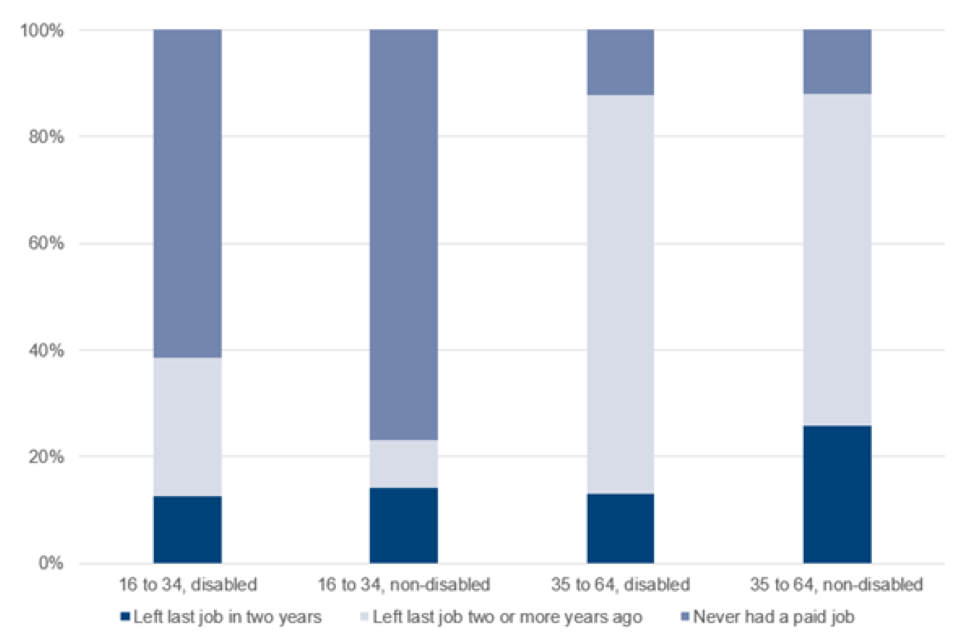
Source: Annual Population Survey – data and definitions can be found in supplementary data table EIA003
In 2022/2023, 58.8% of economically inactive disabled people had not had a job in the last two years compared to 33.6% of non-disabled people.
Economically inactive disabled people were less likely to have never had a paid job (26.8% compared to 45.9% for non-disabled people). However, they were less likely to be younger (30.5% are aged 16 to 34 compared to 57.1% of non-disabled people) and were less likely to give the main reason for being inactive as being a student (see Figure 28). This means that non-disabled people were more likely to still be in full-time education and may not yet have entered the labour market. This may partly explain why they are more likely to have never had a paid job.
For economically inactive people aged 16 to 34, disabled people were more likely to have not had a job in the last two years (25.7% compared to 8.9%) but less likely to have never had a paid job (60.5% v 76.0%) compared to non-disabled people. For the 35-to 64-year-old age group, disabled people were again more likely to have not had a job in the last two years (73.3% v 61.4%) and less likely to have had a job in the last two years (12.7% v 25.3%). Around one in ten of both disabled and non-disabled people aged 35 to 64 who are economically inactive have never had a paid job.
Most economically inactive disabled people give long-term sickness as their main reason for being inactive. Data specifically for this group can be found in supplementary data tables EIA012 to EIA021.
9. Flows
The next section focuses mainly on the movements, or flows, between employment status (in work or not in work) from one year to the next. People not in work will be either unemployed or economically inactive.
Employment status is measured a year apart so will not include movements within the year. For example, a person may be in employment when they complete the survey in the first year, move out of employment (and then back in) and be in employment when they are surveyed the following year. In this scenario the person would be classed as having remained in employment.
Estimates are generally averaged over more than one year to increase precision.
In general, disabled people are more likely to move out of work and less likely to move into work, compared to non-disabled people, over the course of a year.
-
On average, between 2014 and 2019, around 340,000 disabled workers moved out of work each year and 380,000 workless disabled people moved into work (includes people who were classed as disabled at the start of the year)
-
This trend was reversed in 2020 and 2021 but in 2022 480,000 workless disabled people moved into work compared to 450,000 disabled workers moving out of work
-
On average, between 2014 and 2022, disabled workers moved out of work at nearly twice the rate (8.9%) of non-disabled workers (5.0%). Workless disabled people moved into work at nearly one-third of the rate (10.0%) of workless non-disabled people (27.3%)
Nearly one in three people classed as being disabled one year were no longer classed as being disabled the next
Figure 31: Flows between disability and employment status, people aged 16 to 64 years, UK, 2014 to 2022
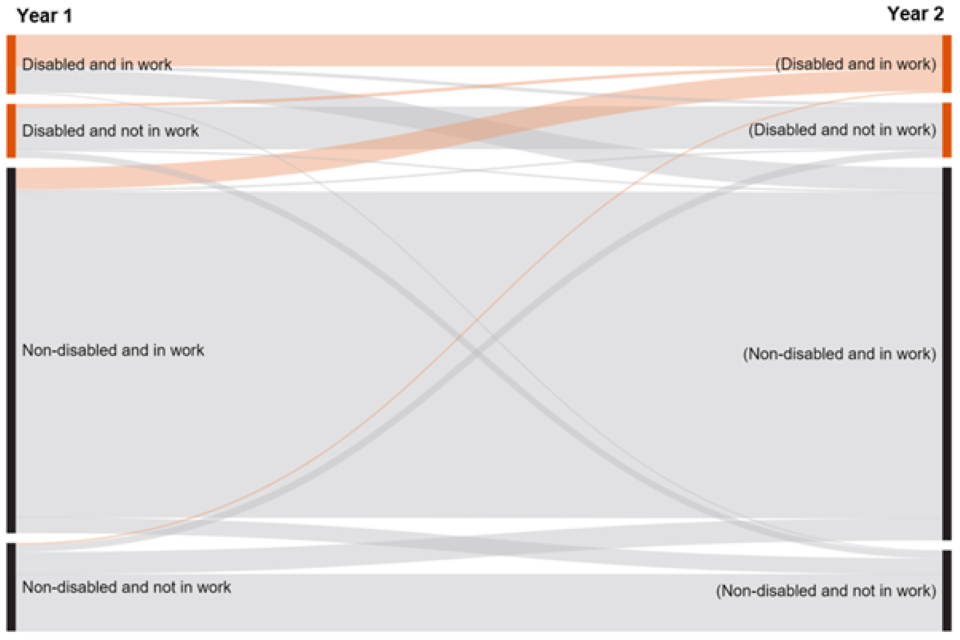
Source: Annual Population Survey – data and definitions can be found in supplementary data table FLW001
Figure 31 shows how people move between the different disability and employment states from one year to the next. This is taken as an average between 2014 and 2022 with the thickness of the line representing the number of people. By far the biggest group is non-disabled people who are in work one year, and still in work and classed as non-disabled the next.
Nearly one in three people classed as being disabled one year were no longer classed as being disabled the next. This suggests that disability is not static and that it can change. For disabled people in work one year, 91.1% are still in work the following year. Of these, 41.5% are no longer classed as being disabled. This compares to 13.8% for disabled people who are still out of work the following year which suggests that people are more likely to change their status from disabled to non-disabled if they are in work.
The orange lines in Figure 31 show the disability and employment status in year one of all the disabled people who were in work in year two. 58.5% of them are disabled people who have remained in work (52.2%) or moved into work (6.3%). The other 41.5% are non-disabled people who have remained in work (39.0%) or moved into work (2.5%) and are now classed as disabled.
Disability and employment status is measured approximately a year apart so will not include movements within the year. For example, a person may be in employment when they complete the survey in the first year, move out of employment (and then back in) and be in employment when they are surveyed the following year. In this scenario the person would be classed as having remained in employment. The same situation will apply to changes in disability status. Cases where the person moves from or to and unknown disability status are excluded from the data.
Disabled workers are twice as likely to move out of work if they are working part-time
Figure 32: Proportion of people moving out of work by disability status and working pattern, employed people aged 16 to 64 years, UK, 2014 to 2022
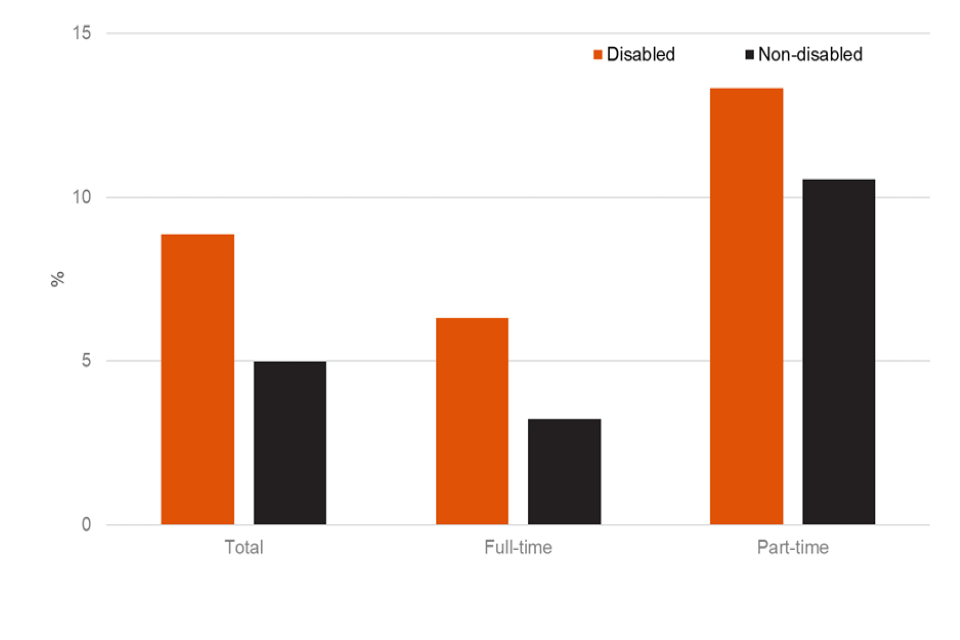
Source: Annual Population Survey – data and definitions can be found in supplementary data table FLW002
We know that disabled workers were more likely to be in part-time employment (see supplementary data table EMP004). Disabled workers in part-time employment were twice as likely (13.3%) to move out of work compared to those working full-time (6.3%) between 2014 and 2022.
A similar pattern can be seen for non-disabled workers but to an even greater extent. Non-disabled workers in part-time employment were three times (10.5%) more likely to move out of work than those in full-time employment (3.2%).
Unlike in Figure 31, disability status is measured in the first year regardless of whether it changes the following year.
Disabled people are more likely to move both in and out of work if their main health condition is a mental health condition
Figure 33: Proportion of flows by employment status and main health condition, disabled people aged 16 to 64, UK, 2014 to 2022
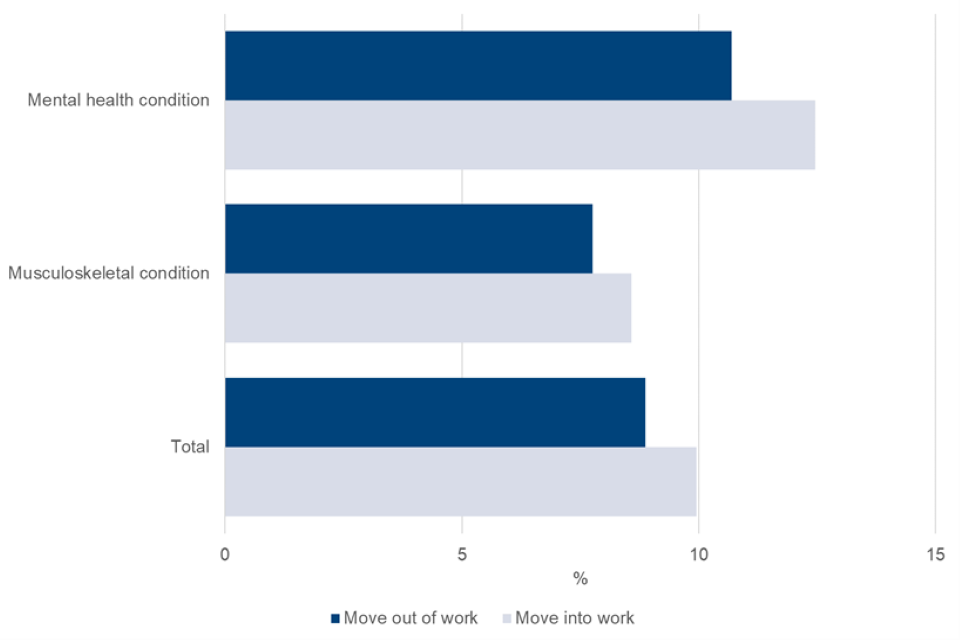
Source: Annual Population Survey – data and definitions can be found in supplementary data tables FLW003 and FLW004
Musculoskeletal (MSK) conditions include problems or disabilities connected with the arms, hands, legs, feet, back or neck. Mental health (MH) conditions include depression, bad nerves, anxiety, mental illness or other nervous disorders.
Data for all health conditions is provided in the supplementary tables should alternative breakdowns be required.
On average between 2014 and 2022, disabled people were more likely to move both in and out of work if their main condition was a mental health condition compared to those where the main condition was musculoskeletal.
-
12.5% of those not in work the previous year with a mental health condition moved into work compared to 8.6% for those with a musculoskeletal condition
-
10.7% of those in work the previous year with a mental health condition moved out of work compared to 7.8% for those with a musculoskeletal condition
This is not unexpected given disabled people with a mental health condition are more likely to be in the younger age groups (see supplementary data table POP002) and these age groups are more likely to move in and out of work (see supplementary data table FLW005).
Estimates for some health conditions are based on small sample sizes and therefore subject to a higher degree of uncertainty. The data for all health conditions can be found in supplementary data table FLW003. The equivalent data for main or secondary health conditions can be found in supplementary data table FLW004. Unlike in Figure 31 disability status is measured in the first year regardless of whether it changes the following year.
Additional flows data by age, gender and highest qualification can be found in supplementary data tables FLW005 to FLW007.
10. About these statistics
These statistics have been compiled using data from the Labour Force and Annual Population surveys which are produced by the Office for National Statistics (ONS). They follow the same definitions and UK coverage used in the ONS Labour Market Overview. They have been developed using guidelines set out by the UK Statistics Authority and are badged as Official Statistics.
Where to find out more
For more information see the Background information and methodology.
Office for Statistics Regulation
Our statistical practice is regulated by the Office for Statistics Regulation (OSR). OSR sets the standards of trustworthiness, quality and value in the Code of Practice for Statistics that all producers of official statistics should adhere to. You are welcome to contact us directly with any comments about how we meet these standards. Alternatively, you can contact OSR by emailing regulation@statistics.gov.uk or via the OSR website.
Statement of compliance with the Code of Practice for Statistics
The Code of Practice for Statistics (the Code) is built around three main concepts, or pillars:
-
Trustworthiness – is about having confidence in the people and organisations that publish statistics
-
Quality – is about using data and methods that produce assured statistics
-
Value – is about publishing statistics that support society’s needs for information
The following explains how we have applied the pillars of the Code in a proportionate way.
Trustworthiness
Labour Force Survey, Annual Population Survey data have been produced in line with the Code and are used in highly scrutinised National Statistics publications.
Quality
Several of the key series have been taken directly from a National Statistics publication (Labour Market Overview), produced by the Office for National Statistics (ONS). The data sources used for new analysis in this release are already used for similar analyses in National Statistics publications. The specific analyses included here have been quality-assured, including through peer-review, plausibility checks and validation against other published sources.
Value
This release provides a detailed picture of disability employment up to 2023. It provides important context on the government’s commitment to reduce the disability employment gap, a commitment reaffirmed in the 2023 Health and Disability White Paper, its previous goal to see one million more disabled people in work between 2017 and 2027, and the strategy set out in Improving lives: the future of work, health and disability in November 2017.
Making this information accessible provides ministers and stakeholders with an overview of disability employment, while helping to reduce the administrative burden of answering Parliamentary Questions, Freedom of Information requests and ad hoc queries.
By comparing high-level estimates from different data sources, this release also provides an evidence base drawing on several different sources, enabling a more rounded picture of broad trends.
Related Statistics
The following publications provide additional data, evidence and context on the topics of health, disability and employment.
Access to Work recipients: Statistics on the number of people who had Access to Work provision approved.
Adult Psychiatric Morbidity Survey: Provides data on the prevalence of both treated and untreated psychiatric disorder in the English adult population (aged 16 and over).
Adult Social Care Outcomes Framework (ASCOF): Measures how well care and support services achieve the outcomes that matter most to people.
Coronavirus and the social impacts on disabled people in Great Britain: Indicators from the Opinions and Lifestyle Survey on the social impact of the coronavirus (COVID-19) pandemic on disabled people in Great Britain.
Disability, England and Wales: Census 2021: Information on disability in England and Wales, Census 2021 data.
DWP benefits statistics: National and Official statistics on the main benefits administered by the DWP.
Economic labour market status of individuals aged 50 and over: This publication details the trends over time, and comparisons with 35 to 49-year-olds, in the economic labour market status of individuals aged 50 and over.
Family Resources Survey: An annual report that provides facts and figures about the incomes and living circumstances of households and families in the UK.
Health Survey for England: Monitors trends in the nation’s health and care for adults aged 16 and over, and children aged 0 to 15, living in private households in England.
Households below average income (HBAI) statistics: Statistics on the number and percentage of people living in low-income households in the UK.
Labour market status of disabled people: Labour market status (employment, unemployment and inactivity) of disabled people. This table is updated 4 times a year in February, May, August and November. These estimates are sourced from the Labour Force Survey, a survey of households.
NHS Talking Therapies Monthly Statistics including Employment Advisors: This statistical release makes available the most recent NHS Talking Therapies for anxiety and depression monthly data, including activity, waiting times, and outcomes such as recovery.
Outcomes for disabled people in the UK: Outcomes for disabled people across areas of life: education, employment, social participation, housing, well-being, loneliness and crime. Analysis by disability status and by age, sex, impairment type and severity, country and region based on survey data.
Personal Independence Payment: Includes numbers of claims in payment, new claim registrations, decisions and awards made.
Work and Health Programme: Statistics on people referred to and starting on the Work and Health Programme.
Contact information and feedback
Authors: Aniysa Ruhi, Samantha MacDonald-Wright, Thomas Mayor and Mark Burley
Lead Statistician: Alex Brown
For more information on disability employment statistics, contact the team at: team.workandhealthanalysis@dwp.gov.uk
Press enquiries should be directed to the DWP Press Office: 020 3267 5144
Pre-release access
In addition to staff who are responsible for the production and quality assurance of the statistics, up to 24-hour pre-release access is provided to Ministers and other officials. We publish the job titles and organisations of the people who have been granted up to 24-hour pre-release access to the latest disability employment statistics.
Next release
The next annual release of these statistics is expected in Autumn 2024. An exact publication date will be listed in the statistics release calendar.
ISBN: 978-1-78659-583-6