Statistical commentary: suicide prevention profile, February 2019 update
Updated 2 December 2025
Applies to England

© Crown copyright 2025
This publication is licensed under the terms of the Open Government Licence v3.0 except where otherwise stated. To view this licence, visit nationalarchives.gov.uk/doc/open-government-licence/version/3 or write to the Information Policy Team, The National Archives, Kew, London TW9 4DU, or email: psi@nationalarchives.gov.uk.
Where we have identified any third party copyright information you will need to obtain permission from the copyright holders concerned.
This publication is available at https://www.gov.uk/government/statistics/suicide-prevention-profile-updates/statistical-commentary-suicide-prevention-profile-february-2019-update
New in this update
New data on suicide rates for clinical commissioning groups (CCGs) and sustainability and transformation partnerships (STPs) have been added to the suicide prevention profile. The following indicators have been added for each CCG and STP in England:
- age-standardised suicide rate per 100,000 population for persons, males and females
- age-specific suicide rate per 100,000 population for males
- age-specific suicide rate per 100,000 population for females (STP only)
This update contains new data on female age-specific suicide rates by STP, replacing presentation of this data by region. STP is the lowest geographical level at which female age-specific suicide rates are presented in the profile.
For the full list of updated indicators see ‘recent updates’ section (February 2019) of the suicide prevention profile.
Main findings
Data on suicide rates is being provided by STP for the first time, so all values in these headlines are given at STP level unless otherwise stated. Values are in the format of ‘value (95% lower confidence interval (CI), 95% upper CI)’.
This update shows:
-
for the period 2015 to 2017, age-standardised suicide rates for persons across STPs ranged from 7.3 (6.4, 8.2) to 14.5 (12.6, 16.6) deaths per 100,000 population
-
for the period 2015 to 2017, male age-standardised suicide rates across STPs ranged from 11.7 (10.2, 13.4) to 22.3 (18.9, 26.2) deaths per 100,000 population
-
for the period 2015 to 2017, female age-standardised suicide rates across STPs ranged from 3.2 (2.3, 4.2) to 7.3 (5.5, 9.5) deaths per 100,000 population
-
the highest female age-specific suicide rate exists among females aged 35 to 64 years
Summary
Age-standardised suicide rates by STP: persons
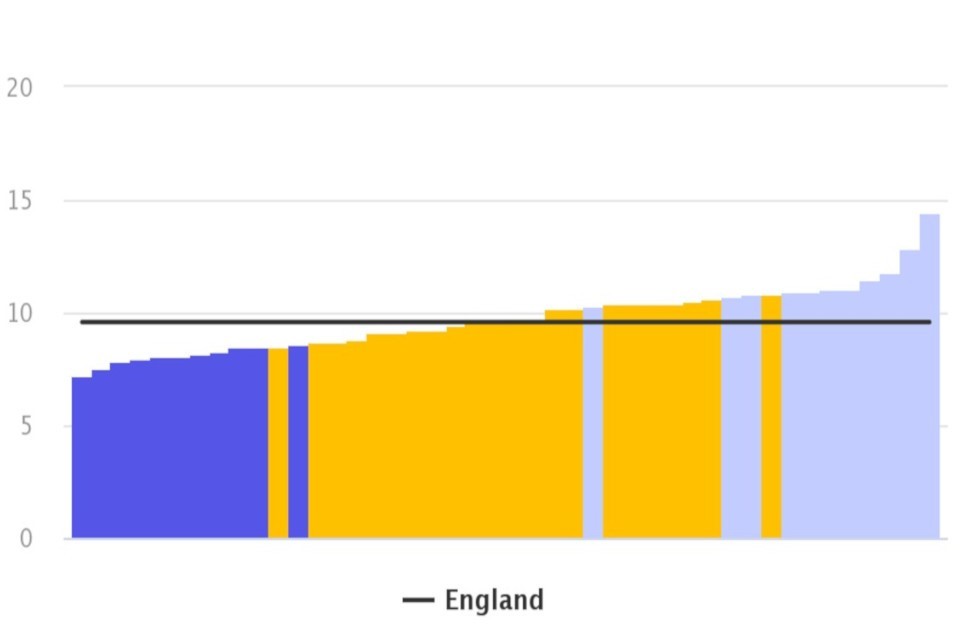
In England, for the period 2015 to 2017, there were between 107 to 701 registered suicides across STPs. The age-standardised suicide rate ranged from 7.3 (6.4, 8.2) to 14.5 (12.6, 16.6) deaths per 100,000 population (Figure 1).
Out of the 44 STPs in England, 11 STPs had a significantly higher age-standardised suicide rate than the England average.
Figure 1: age-standardised suicide rate: STPs and England, persons (10 years and over), for the period 2015 to 2017
Age-specific suicide rates: England, females (10 years and over), between 2011 to 2015 and 2013 to 2017
Source: Office for National Statistics (ONS) mortality statistics
Age-standardised suicide rates by STP: males and females
For the period 2015 to 2017, there were between 76 and 540 male registered suicides across STPs in England. The male age-standardised suicide rate ranged from 11.7 (10.2, 13.4) to 22.3 (18.9, 26.2) deaths per 100,000 population.
Over the same period, there were between 28 and 165 female registered suicides across STPs in England. The female age-standardised suicide rate ranged from 3.2 (2.3, 4.2) to 7.3 (5.5, 9.5) deaths per 100,000 population.
Age-specific suicide rates by STP: males
Variation in male age-specific suicide rates exists across STPs in England.
For the period 2013 to 2017 in males:
-
aged 10 to 34 years there were between 32 and 271 registered suicides, and the suicide rate ranged from 7.3 (6.1, 8.8) to 17.6 (12.5, 24.2) deaths per 100,000 population
-
aged 35 to 64 years there were between 64 and 578 registered suicides, and the suicide rate ranged from 13.5 (11.7, 15.5) to 30.0 (25.4, 35.0) deaths per 100,000 population
-
aged 65 years and over there were between 18 and 125 registered suicides, and the suicide rate ranged from 9.1 (6.5, 12.5) to 19.8 (15.1, 25.4) deaths per 100,000 population
Age-specific suicide rates: females
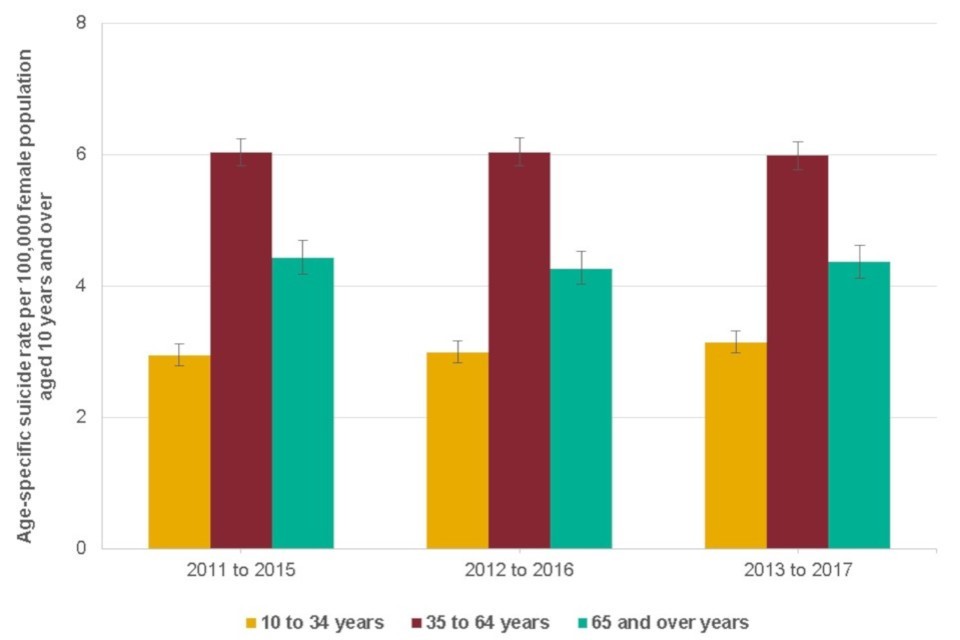
In England, 1,342 suicides were registered for females aged 10 to 34 years for the period 2013 to 2017, a rate of 3.1 (3.0, 3.3) deaths per 100,000 population.
Over the same time period, 3,175 suicides were registered for females aged 35 to 64 years, a rate of 6.0 (5.8, 6.2) deaths per 100,000 population. Additionally, for females aged 65 years and over, 1,157 suicides were registered, a rate of 4.4 (4.1, 4.6) deaths per 100,000 population.
The highest age-specific suicide rate exists among females aged 35 to 64 years (Figure 2).
Figure 2: age-specific suicide rates: England, females (10 years and over), between 2011 to 2015 and 2013 to 2017
Age-standardised suicide rate: STPs and England, persons (10 years and over), for the period 2015 to 2017
Source: Office for National Statistics (ONS) mortality statistics
Age-specific suicide rates by STP: females
Variation in female age-specific suicide rates exists across STPs in England.
For the period 2013 to 2017 in females:
-
aged 10 to 34 years there were between 9 and 78 registered suicides, and the suicide rate ranged from 1.8 (1.1, 2.7) to 5.7 (3.0, 10.0) deaths per 100,000 population
-
aged 35 to 64 years there were between 22 and 164 registered suicides and the suicide rate ranged from 3.7 (2.8, 4.7) and 9.4 (7.0, 12.3) deaths per 100,000 population
-
aged 65 years and over there were between 9 and 66 registered suicides and the suicide rate ranged from 2.2 (1.2, 3.7) to 7.9 (4.4, 13.1) deaths per 100,000 population
Background information
Suicide definition
This release is based on the National Statistics definition of suicide. This definition includes deaths from intentional self-harm for persons aged 10 years and over, and deaths where the intent was undetermined for those aged 15 years and over.
Deaths from an event of undetermined intent between the age of 10 and 14 years are not included. It is assumed that for older teenagers and adults that the harm was self-inflicted, however for younger children it is not clear whether this assumption is appropriate.
Quality and methodology
Due to the length of time it takes to complete a coroner’s inquest, it can take months or even years for a suicide to be registered. Coroners certify about a quarter of all deaths. Coroners can only certify cause of death following a post-mortem by a pathologist, an inquest, or both. Training for coroners is organised through the Ministry of Justice.
The process of referral to a coroner and how referred deaths are dealt with varies between coroners’ areas. ‘Short form’ conclusions, such as accident or misadventure, natural causes, suicide and homicide, make up the majority of all conclusions.
Alternatively, ‘narratives’ can be used by a coroner or jury to express their conclusions about the cause of death following an inquest. In recent years, there has been a large increase in the number of narrative conclusions returned by coroners in England and Wales.
Differences in how coroners across the UK operate, in the past and present, make comparison and the identification of important trends more complex.
For further information refer to:
The suicide prevention profile
The suicide prevention profile has been produced to help develop understanding at a local level and support an intelligence-driven approach to suicide prevention. It collates and presents a range of publicly available data on suicide, associated prevalence, risk factors and service contact among groups at increased risk.
It offers planners, providers and stakeholders with the means to profile their area and benchmark against similar populations.
Data is presented in the following domains:
- suicide data
- related risk factors
- related service contacts
The domains group data by geography (Clinical Commissioning Group (CCG), Sustainability and Transformation Partnership (STP), county, unitary authority or district) and within that, they are ordered by topic. For example, the ‘related service contacts’ domain presents data on primary care, improving access to psychological therapies (IAPT), specialist care and emergency care.
For more publicly available data and information relating to suicides in the UK see Suicides in the UK Statistical bulletins produced by the Office for National Statistics (ONS).
View the suicide prevention profile
Responsible statisticians: Arvinder Kaur Duggal, Gabi Price
Product lead: Cam Lugton, Julia Verne
For queries relating to this publication, please contact: mhdnin@phe.gov.uk