Police powers and procedures: Stop and search, arrests and mental health detentions, England and Wales, year ending 31 March 2026
Published 1 October 2026
Applies to England and Wales

© Crown copyright 2026
This publication is licensed under the terms of the Open Government Licence v3.0 except where otherwise stated. To view this licence, visit nationalarchives.gov.uk/doc/open-government-licence/version/3 or write to the Information Policy Team, The National Archives, Kew, London TW9 4DU, or email: psi@nationalarchives.gov.uk.
Where we have identified any third party copyright information you will need to obtain permission from the copyright holders concerned.
This publication is available at https://www.gov.uk/government/statistics/stop-and-search-arrests-and-mental-health-detentions-march-2026/police-powers-and-procedures-stop-and-search-arrests-and-mental-health-detentions-england-and-wales-year-ending-31-march-2026
Frequency of release: Annual
Forthcoming releases: Home Office statistics release calendar
Home Office responsible statistician: Jodie Hargreaves
Press enquiries: 0300 123 3535
Public enquiries: policingstatistics@homeoffice.gov.uk
Privacy information notice: Home Office Crime and Policing Research and Annual Data Requirement (ADR) data – Privacy Information Notices
1.1 Overview of Police powers and procedures statistical bulletins
Prior to September 2024, the ‘Police powers and procedures’ statistical bulletin was published as 2 reports. Given the volume and variety of topics covered, a decision has been made to split the release into 3 separate statistical bulletins, with an additional bulletin on police protests powers (totalling 4 bulletins).
This release is the first of the now 4 annual publications on police powers and contains statistics on the use of the powers of stop and search, arrest and detentions under the Mental Health Act by the police in England and Wales, up to the year ending 31 March 2026.
Stop and search statistics contain information from the 43 territorial police forces in England and Wales, and the British Transport Police (BTP), including data on the:
- change in the use of stop and search in the years ending March 2025 and March 2026
- number of stop and searches carried out under a range of legislative powers, including; section 1 of the Police and Criminal Evidence Act 1984 (PACE) and associated legislation, section 60 of the Criminal Justice and Public Order Act 1994, section 47A (previously section 44) of the Terrorism Act 2000, section 11 of the Public Order Act 2023 and section 342E of the Sentencing Act 2020
- reason for conducting a search
- outcomes following stop and search
- weapons found from stop and search, including analysis on type of weapon found (that is, bladed article, firearm, other offensive weapon)
- ethnicity, sex and age of persons searched
- analysis of where stop and searches take place within police force areas (also referred to as ‘hotspot analysis’)
- whether force was used in a stop and search, including new analysis on the type of force used
- analysis on the amount of clothing removed from persons searched
- analysis on whether an outcome was linked by ethnic group
- stop and searches involving a full strip search, including their location, whether a supervisor was consulted and whether an appropriate adult was present for children being fully strip searched
- new analysis on authorisations under section 60 of the Criminal Justice and Public Order Act 1994
Arrest statistics contain information from 43 territorial police forces in England and Wales on a financial-year basis, including data on the:
- number of arrests for notifiable offences
- reason for which persons were arrested
- ethnicity, sex and age group of those arrested
Detentions under the Mental Health Act 1983 statistics contain information from the 43 territorial police forces in England and Wales, and British Transport Police, on a financial year basis, including data on the:
- number of detentions under sections 135 and 136 of the Mental Health Act 1983
- age-group, sex and ethnicity of persons detained
- type of place of safety used to detain individuals, and the reason for using a police station (where applicable)
- method of transportation used to transport an individual to a place of safety, and the reason for using a police vehicle (where applicable)
The second part of this statistical series, ‘Police protest powers’, is scheduled for publication in late 2026. This release will contain statistics on the use of powers under sections 12, 14 and 14ZA of the Public Order Act 1986 (as amended by the Police, Crime, Sentencing and Courts Act 2022).
The third part of this statistical series ‘Roads policing powers’ is scheduled for publication in early 2027. This release will contain data on:
- roadside breath tests for alcohol
- fixed penalty notices and other outcomes for motoring offences
The fourth part of this statistics series, ‘Police powers and procedures: Police custody and bail, England and Wales’, is scheduled for publication in early 2027. This release will contain statistics on the use of other police powers under the Police and Criminal Evidence (PACE) Act 1984 including:
- pre-charge bail, released under investigation and voluntary attendance
- the use of police custody and the number of strip searches and intimate searches conducted in custody
1.2 Main findings
Including searches under all relevant legislation, in the year ending March 2026 police in England and Wales conducted 586,591 stop and searches in total, an increase of 10.9% compared with the year ending March 2025 (up 57,494 from 529,097).
The number of arrests following searches under all legislation increased by 9,202 (up 11.5% to 88,944) in the year ending March 2026. This equated to 15.2% of all searches resulting in arrest, which compares to 15.1% in the year ending March 2025 , and remains below the peak arrest rate (17.1%) in the year ending March 2017 and year ending March 2018.
There were, 739,703 arrests carried out by 42 territorial police forces in England and Wales (excludes Derbyshire Constabulary who were unable to provide data). This was an increase of 2.1% compared with the year ending March 2025, in which there were 724,275 arrests. 19 forces carried out more arrests in the year ending March 2026 than the year ending March 2025, while 23 forces carried out fewer.
There were 32,465 detentions under section 136 of the Mental Health Act 1983 in the year ending March 2026. Excluding Cumbria Police, who were unable to provide data in the year ending March 2026, this was a 2.7% increase from the previous year.
1.3 Accredited Official Statistics status
These official statistics were independently reviewed by the Office for Statistics Regulation (OSR) the regulatory arm of the UK Statistics Authority (UKSA). They comply with the standards of trustworthiness, impartiality, quality and value in Code of Practice for Statistics and should be labelled ‘Accredited Official Statistics’.
The statistics in this release were originally assessed as National Statistics in 2012.
On 30 July 2024 the OSR wrote to the Home Office to confirm that the stop and search statistics can continue to be labelled as Accredited Official Statistics (following the expansion of the data from aggregate to record-level), highlighting the improvements that have been made to the analysis and bulletin. They also made several recommendations which have been addressed in this bulletin.
The arrests statistics and mental health detentions statistics were most recently assessed by the OSR in 2020 and were assessed as continuing to meet National Statistics designation.
Where new data requirements have been added to the statistical collections covered in this bulletin and are deemed to need further data quality development, these have been labelled as Official Statistics in development.
The Home Office worked closely with the UK Statistics Authority to improve information on the quality and limitations of the various datasets, and the ways in which the Home Office engages with users of the statistics. This is documented in the user guide, which is published alongside this release.
1.4 Accountability statement
Our statistical practice is regulated by the OSR which sets the standards of trustworthiness, quality and value in the Code of Practice for Statistics that all producers of official statistics should adhere to. You are welcome to contact us directly via policingstatistics@homeoffice.gov.uk with any comments about how we meet these standards. Alternatively, you can contact OSR by emailing regulation@statistics.gov.uk or via the OSR website.
2.1 Stop and search - data quality and introduction
2.1.1 Data quality: stop and search
Whilst this data has been labelled as Accredited Official Statistics, there are some data quality issues which users should be aware of when interpreting the data. The user guide provides further information on the quality assurance checks on the data, as well as details relating to definitions, legislation and procedure around stop and search.
Force data provision
Data presented here has been provided to the Home Office by 43 territorial police forces in England and Wales and the British Transport Police (BTP). Since the year ending March 2010, BTP have been providing data to the Home Office. Data on total searches before this period is therefore not directly comparable with more recent years. However, as BTP typically only makes up just over 1.5% of all stop and searches each year, not including them only has a marginal effect on the longer-term time series.
Excluded force data
For some years, certain forces were not able to provide all the requested breakdowns of the data. Such cases have been outlined in the relevant table notes. To make sure data is comparable over time, some forces may not be included in annual comparisons. These cases have been highlighted.
Ethnicity analysis
Although the ethnicity analysis in this commentary focusses only on aggregated ethnic groups (White, Black, Asian, Mixed or Other), the accompanying open data breaks data down into the 19+1 SDE groups (such as, White British, White Irish, other White).
Self-defined ethnicity data (SDE)
Reliable self-defined ethnicity (SDE) data is essential for identifying racial disparities in the use of police powers. Without accurate ethnicity information, it becomes difficult to assess whether stop and search powers are being applied fairly.
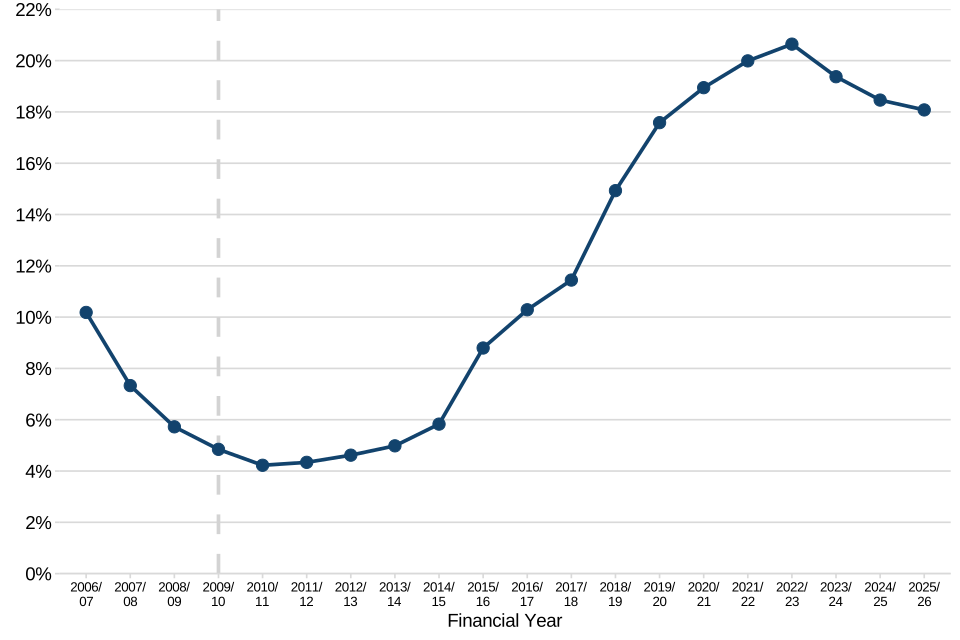
Around a fifth (18%) of stop and search records do not include SDE data in the year to March 2026, which is stable against the previous year. This is an increase from a low of 4% in the year to March 2011, but reduced by 3 percentage points since the peak of 21% in the year to March 2023.
Missing ethnicity data may occur where an individual declines to provide their ethnicity or where the information is not collected by the officer. Under PACE guidelines, individuals are not legally required to disclose their ethnicity. There are also a range of operational circumstances in which officers may be unable to collect this information, including public order incidents, emergency situations, capacity or welfare concerns, or where language barriers prevent an individual from understanding the request. The Home Office are exploring options for expanding data collection to better understand the circumstances in which SDE is not recorded.
Whilst SDE is the preferred option, where this is not available, officer-observed ethnicity helps to fill the gap and allows for analysis based on more complete data. However, the impact of this is that the officer-observed ethnicity categories are not as detailed as the self-defined categories, with no distinct ‘Mixed’ option when officer-observed ethnicity is recorded, which means some detail is lost. Furthermore, action has been taken to ensure SDE remains the preferred option and is captured wherever possible.
Figure 1.1: Proportion of stop and searches where SDE was not stated or unknown, England and Wales, year ending March 2007 to year ending March 2026
Source: ‘Stop and search open data tables, year ending 31 March 2007 to year ending 31 March 2020’; ‘Stop and search open data tables, year ending 31 March 2021 to year ending 31 March 2026’, Home Office
Notes:
- Data from the year ending March 2010 onwards includes the British Transport Police (BTP). Data taken before this is not directly comparable with more recent years.
In 2025, the Home Office wrote to chief constables to encourage immediate and sustained action around data completion. The Home Office is committed to engage with police forces to reduce the proportion of stop and search records without SDE, understand reasons for missing data, and improve data recording.
Age of persons stopped and searched data
Since April 2020, the Home Office has collected data on the age of persons stopped and searched. Police forces are asked to review any searches where the age of person stopped and searched is recorded as 9 or under, however this may not always be possible. In the year ending March 2026 there were 164 stop and searches where the age was recorded as 9 or under (less than 0.1% of the total number of stop and searches). Any records in which the age of the person stop and searched was recorded as ‘0’ are reported as unknown values in this publication. The age of the person stopped and searched was unknown for 4.6% of searches.
Reason for arrest data
Since April 2020, the Home Office has also collected data on reason for arrest following a stop and search. The aim of collecting this data is to understand how effectively the police are using stop and search powers, for example if the reason for arrest is aligned with the reason for search, it would be implied that this was a successful search. Data quality checks showed that some forces will, by default, provide the same reason for arrest as the reason for search, or they record all reasons for arrest as “other”. This data has been presented in the summary tables as ‘Official Statistics in development’ to denote that there are known data quality issues.
Outcome linked data
Given the known issues around the quality of the data, statistics in this release on outcomes and whether the outcome was linked to the reason for the search (formerly referred to as ‘Best Use of Stop and Search’ data) are Official Statistics, and not Accredited Official Statistics. Further details can be found in section 6.2 of the user guide that accompanies this publication.
Whether force was used in a stop and search
The Home Office has collected data on whether force was used during a stop and search since the year ending March 2023 and further information on the type of force used since the year ending March 2025. Given the partial nature of the data presented in this section, these statistics are ‘Official Statistics in development’ and any conclusions drawn should be done so with caution.
Whether clothing was removed in a stop and search
The Home Office has collected data on the extent of clothing removal during a stop since the year ending March 2024. Given the partial nature of the data presented in this section, these statistics are ‘Official Statistics in development’ and any conclusions drawn should be done so with caution.
Whether body worn video was used in a stop and search
The Home Office has collected data on whether body worn video was used during a stop since the year ending March 2024. Given the partial nature of the data presented in this section, these statistics are ‘Official Statistics in development’ and any conclusions drawn should be done so with caution.
Additional information on full strip searches following a stop
Since the year ending March 2025, the Home Office has collected data on where a full strip search took place (police station, educational establishment, home address or other location out of public view), as well as whether a supervisor was consulted as part of a full strip search, and whether an appropriate adult was present for full strip searches of children. Given the partial nature of the data presented in this section, these statistics are ‘Official Statistics in development’ and any conclusions drawn should be done so with caution.
Information on authorisations under section 60 of the Criminal Justice and Public Order Act
For the first time in the year ending March 2026, the Home Office have collected voluntary data on authorisations under section 60 of the Criminal Justice and Public Order Act. Information was received from 10 forces, with details including how many authorisations were made, what their durations were, the general location covered and the rank of the authorising officer. Given the partial nature of the data presented in this section, these statistics are ‘Official Statistics in development’ and any conclusions drawn should be done so with caution.
Person ID
Information on person identification is also collected from police forces on a voluntary basis. A person ID should relate to a unique individual. The purpose of collecting this data is to understand the extent to which people are repeatedly stopped and searched. However, analysis of this data has shown that for a large proportion of records, person ID is either missing or has not been recorded correctly (for example, it is clear from demographic information that the same person ID has been used for different individuals). There are operational difficulties with recording this data as when an individual is stopped and searched they are not required to provide personal information.
2.1.2 Introduction to stop and search
This section presents the latest statistics on stop and searches conducted by the territorial police forces in England and Wales (and the British Transport Police) under different legislative powers. These are:
- section 1 of the Police and Criminal Evidence (PACE) Act 1984 and associated legislation[footnote 1]
- section 60 of the Criminal Justice and Public Order Act (CJPOA) 1994
- section 47A (previously section 44) of the Terrorism Act (TACT) 2000
- section 342E of the Sentencing Act 2020
- section 11 of the Public Order Act 2023
These powers allow police to search persons and vehicles without a warrant in specific situations. Details of the above legislation and the legislation associated with section 1 of PACE are included in the user guide.
This section includes statistics on the:
- change in the use of stop and search in the years ending March 2025 and March 2026
- number of stop and searches carried out under a range of legislative powers, including; section 1 of the Police and Criminal Evidence Act 1984 (PACE) and associated legislation, section 60 of the Criminal Justice and Public Order Act 1994, section 47A (previously section 44) of the Terrorism Act 2000, section 342E of the Sentencing Act 2020 and section 11 of the Public Order Act 2023
- reason for conducting a search
- outcomes following stop and search
- weapons found from stop and search
- ethnicity, sex and age of persons searched
- police use of force in a stop and search
- level of clothing removal in stop and searches
- whether body worn video was used during a stop and search
- whether an outcome was linked by ethnic group
In this chapter, the majority of percentages are presented to one decimal place, in order to provide more detail regarding year-on-year changes in the data.
2.2 Main results - stop and search
Searches
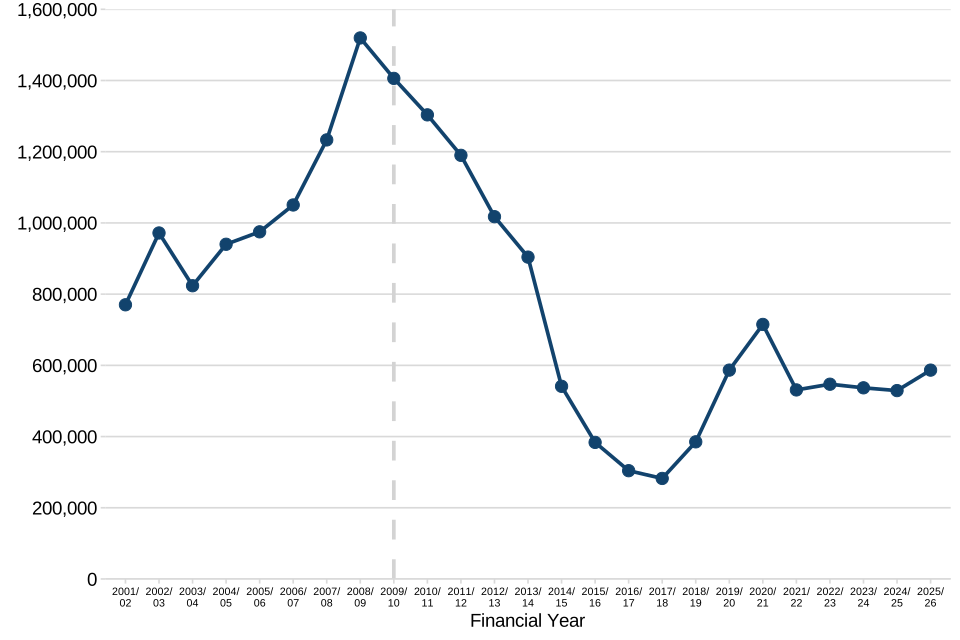
In total, including searches under all relevant legislation, police in England and Wales conducted 586,591 stop and searches in the year ending March 2026, an increase of 10.9% compared with the year ending March 2025 (up 57,494 from 529,097). The number of stop and searches in the year ending March 2025 was 61.4% lower than the peak number (1,519,561) in the year ending March 2009.
Figure 2.1: Number of stop and searches under all relevant legislation, year ending March 2002 to year ending March 2026, England and Wales
Source: Stop and search summary data tables, year ending 31 March 2026; table SS_01, Home Office
Notes:
- Data collected before the year ending March 2010 does not include the British Transport Police (BTP). Due to this, stop and search data before the year ending March 2010 is not directly comparable with more recent years. BTP usually makes up between 1.0% and 3.0% of all stop and search across England and Wales each year.
There were 580,068 stop and searches conducted under section 1 PACE by police in England and Wales (including British Transport Police). This is an increase of 56,891 (10.9%) compared with the year ending March 2025.
Searches for drugs, criminal damage, stolen property and offensive weapons increased by 15.1%, 13.9%, 6.5% and 3.3%, respectively, in the year ending March 2026. However, searches for firearms were unchanged from last year, and there was a decrease in ‘going equipped’ searches (down 6.0%) (see section 2.4 for a full breakdown).
Police in England and Wales conducted 6,340 stop and searches under section 60 of the Criminal Justice and Public Order Act in anticipation of violence, an increase of 13.6% compared with the year ending March 2025 (up from 5,580).
Almost half (44.6%) of stop and searches (where age and sex was known) in the year ending March 2026 were of males aged between 18 and 34, while this group makes up 10.8% of the overall population. Males aged 18 to 34 had the highest rate of stop and search, at 36.2 stop and searches per 1,000 population in the year ending March 2026. Note, more detailed age group breakdowns are available in the accompanying data tables.
All ethnic groups (based on SDE), saw a small increase in disparity rates[footnote 2] compared with the year ending March 2025. Individuals from a Black or Black British background have the highest disparity rate, at a rate 4.1 times higher than that of those from a White ethnic group across England and Wales.
Based on a combination of SDE and officer-observed ethnicity (where SDE was not stated) the disparity rate for Black people was 5.3, up from 4.9 in the year ending March 2025.
Where the information was provided, 98.4% of searches had either no clothing removed or outer clothing only removed, 0.5% of searches involved the removal of more than outer clothes without exposing intimate parts and 1.1% of searches were a full strip search. These proportions are similar to the previous year.
Outcomes following searches
The number of arrests following searches under all legislation increased by 9,202 (up 11.5% to 88,944) in the year ending March 2026. This equated to 15.2% of all searches, compared with 15.1% in the year ending March 2025, and it remains below the peak arrest rate (17.1%) in the year ending March 2017 and year ending March 2018.
Of the 580,068 searches under section 1 PACE (and associated legislation), 88,715 led to an arrest. This number of arrests is 11.6% higher than the year ending March 2025. The proportion of searches resulting in an arrest increased slightly, from 15.2% to 15.3%.
In 64.0% of stop and searches under section 1 PACE, the outcome was recorded as needing ‘no further action’, down from 66.4% in the year ending March 2025. Across all relevant legislation, 64.3% of searches resulted in ‘no further action’.
People who self-defined their ethnicity as ‘Mixed or Other’ (or, if they did not state their ethnicity, were perceived by the officer to belong to the Other ethnic group) had an arrest rate following a stop and search of 17.9%. Black people had an arrest rate of 16.1%, White people had an arrest rate of 15.0%, and people who self-defined or were perceived to be of Asian ethnicity had the lowest arrest rate (13.4%).
2.3 Trends in stop and search by legislation
2.3.1 Section 1 PACE and associated legislation
In this section we refer to ‘section 1 PACE’ searches, which includes other legislation such as searches conducted under section 23 Misuse of Drugs Act (1971). For examples of other legislation included under section 1 searches see the user guide.
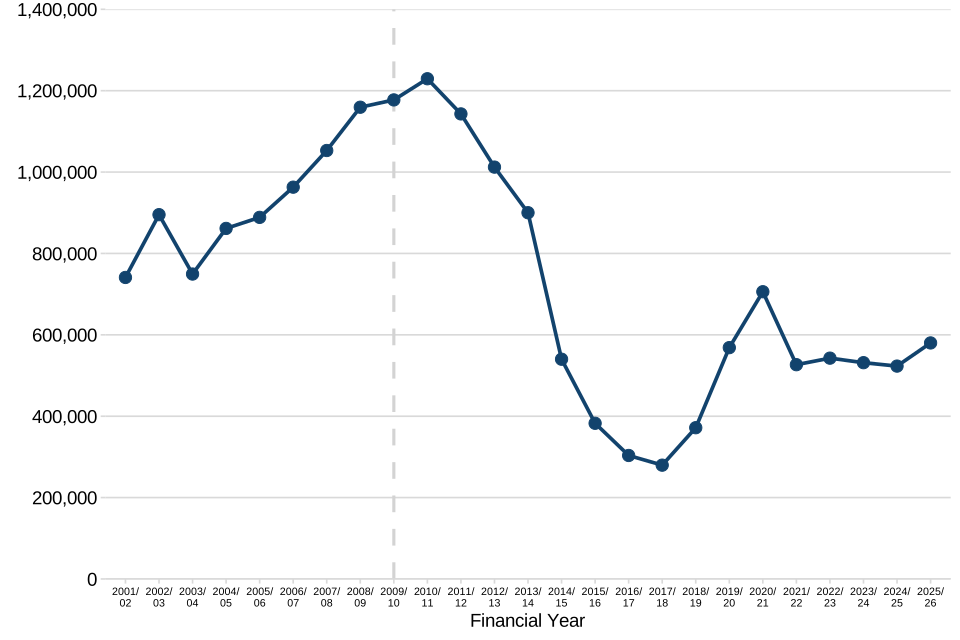
In the year ending March 2026 there were 580,068 stop and searches conducted under section 1 PACE by police in England and Wales (including British Transport Police). The number of searches under section 1 PACE in the year ending March 2026 increased by 56,891 (or 10.9%) compared with the year ending March 2025 (523,177).
The Metropolitan Police, who account for 24.3% of searches, saw an increase of 16.5% in the year ending March 2026, up from 121,148 to 141,088. This pattern was not observed in all forces - 17 of the 44 police forces in England and Wales (including BTP) had a lower number of stop and searches under section 1 PACE in the year ending March 2026 than the year ending March 2025.
Looking at longer-term changes, the number of stop and searches under section 1 PACE conducted in the year ending March 2026 was 52.8% below the peak recorded in the year ending March 2011 (when there were 1,229,324). The rate of reduction between the year ending March 2011 and the year ending March 2018 in stop and searches accelerated following the then Home Secretary’s decision in 2014 to re-focus the use of such powers. Between the year ending March 2018 and year ending March 2021, the number of stop and searches began to increase again[footnote 3]. The number of searches conducted was relatively stable between the year ending March 2022 and year ending March 2025, before increasing by 10.9% in the year ending March 2026.
Figure 2.2: Number of stop and searches under section 1 PACE and associated legislation, year ending March 2002 to year ending March 2026, England and Wales
Source: Stop and search summary data tables, year ending 31 March 2026; table SS_02, Home Office
Notes:
- Data collected before the year ending March 2010 does not include the British Transport Police (BTP). Due to this, stop and search data before the year ending March 2010 is not directly comparable with more recent years. BTP usually makes up between 1.0% and 3.0% of all stop and search across England and Wales each year.
2.3.2 Section 60 of the Criminal Justice and Public Order Act
Section 60 of the Criminal Justice and Public Order Act (CJPOA) 1994 enables officers to conduct ‘no suspicion’ stop and searches for dangerous instruments or offensive weapons for a limited time within a specified area, in anticipation of violence occurring in that area. This will often follow a major incident or from intelligence gathered by the police. Further details can be found in the user guide.
From April 2019, under a pilot scheme agreed by the then Home Secretary, some changes were made to the conditions under which a section 60 search could be carried out. The changes, aimed to make it easier for the police to use such powers when they judged it necessary to do so, included:
- reducing the rank of an authorising officer from senior officer to inspector
- relaxing the grounds from a reasonable belief that serious violence will take place to a belief that it may take place
A phased approach was taken, with 7 forces joining the pilot from 1 April 2019, whilst the remaining 37 forces joined from August 2019. Three further changes were made at that time:
- increasing the length of time the initial Section 60 order can be in place from 15 to 24 hours
- reducing the rank of officer who can extend the order for up to a further 24 hours from senior officer to superintendent
- removing the requirement for forces to communicate to local communities in advance, where practicable, where a Section 60 order is in place
In July 2021, as part of the Beating Crime Plan, the then Home Secretary announced a permanent relaxation of all 5 voluntary conditions outlined above.
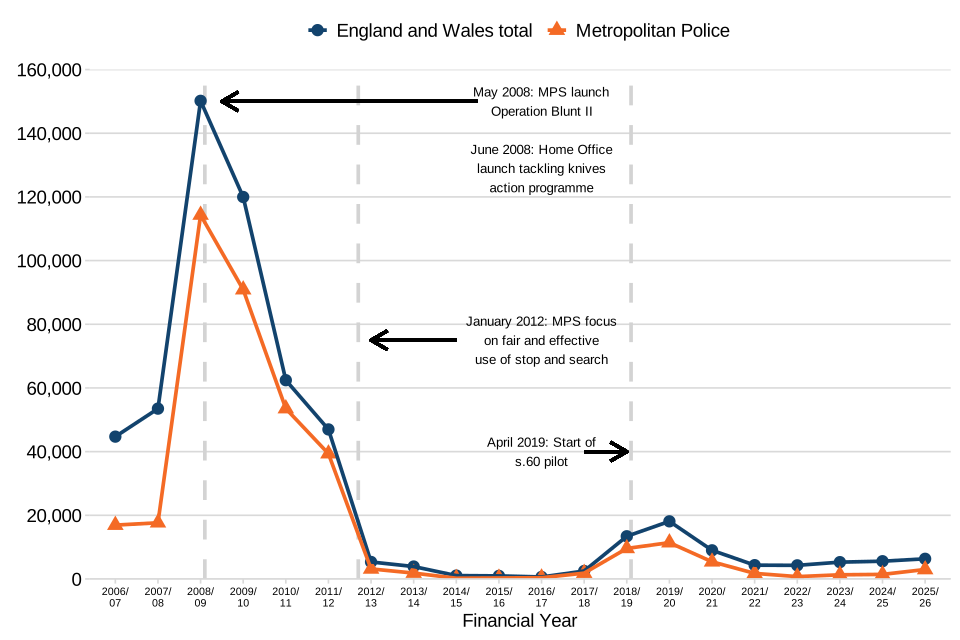
In the year ending March 2026, police in England and Wales carried out 6,340 stop and searches under section 60 CJPOA, a 13.6% increase compared with the year ending March 2025 (when 5,580 such searches were undertaken) (figure 2.3).
The Metropolitan Police Service increased their number of searches under section 60 CJPOA from 1,437 to 2,974 in the year ending March 2026. Greater Manchester Police also conducted more searches under section 60 CJPOA in the year ending March 2026, up by 40.6% from 875 to 1,230. However, Merseyside Police conducted fewer searches under section 60 CJPOA in the year ending March 2026, down 41.7% from 1,810 to 1,056.
Figure 2.3: Stop and searches under section 60 CJPOA, year ending March 2007 to year ending March 2026, England and Wales
Source: ‘Stop and search open data tables, year ending 31 March 2007 to year ending 31 March 2020’; ‘Stop and search open data tables, year ending 31 March 2021 to year ending 31 March 2026’, Home Office
Notes:
- Data from the year ending March 2010 onwards includes the British Transport Police (BTP). Data taken before this is not directly comparable with more recent years.
The number of forces in England and Wales making at least one stop and search under section 60 powers increased from 22 out of 44 (including BTP) in the year ending March 2025 to 25 out of 44 and year ending March 2026.
Three police forces accounted for 83.0% of searches under section 60 CJPOA in the year ending March 2026. The Metropolitan Police Service (MPS) had the highest number of section 60 stop and searches in England and Wales, accounting for 46.9% of the total in the year ending March 2026 (2,974 out of 6,340). Greater Manchester Police accounted for 19.4% (1,230 out of 6,340) and Merseyside Police accounted for 16.7% (1,056 out of 6,340).
The proportion of section 60 searches that resulted in an arrest in the year ending March 2026 was 3.5%, compared with 3.6% in the year ending March 2025. This remains much lower than the arrest rate following searches under section 1 of PACE (15.3% in the year ending March 2026).
Following a recommendation made to the Home Office by His Majesty’s Inspectorate of Constabulary and Fire and Rescue Services in their Report on the Criminal Justice Alliance’s super-complaint - Section 60 of the Criminal Justice and Public Order Act 1994 and independent community scrutiny of stop and search (Recommendation 6), the Home Office has started to collect voluntary data on authorisations under section 60.
In the year ending March 2026, this information was received from 10 police forces out of the 25 that conducted searches under section 60. However, its should be noted that officers can conduct searches under section 60 in support of operations by police forces outside their own police force area. For example, in the year ending March 2026, the 6 stop and searches carried out by West Mercia officers were done so in support of an authorisation made by West Midlands Police.
The 10 police forces that data was received from provided information on 41 authorisations. In terms of duration, 6 authorisations were for less than 12 hours, 15 were for 12 hours to less than 24 hours, 14 were for 24 hours to less than 36 hours and 6 were for 36 hours or more to 48 hours.
In terms of the rank of authorising officer, 31 out of 41 authorisations were made by inspectors, 2 by chief inspectors and 8 by superintendents.
In terms of volume of searches per authorisation, there were 17 authorisations which had between one and 10 searches, 9 which had between 11 and 25 searches, 2 which has between 26 and 50 searches, 8 that had between 51 and 100 searches and 3 with more than 100 searches. There were also 2 authorisations under which no searches were made.
Police forces provided text-based descriptions of the areas covered by authorisations. These commonly covered a whole town or city centre.
2.3.3 Section 47A (previously section 44) of the Terrorism Act 2000
Section 47A (as amended by the Protection of Freedoms Act 2012) of the Terrorism Act 2000 (TACT) allows the police to use stop and search powers when there is reasonable suspicion an act of terrorism will take place, and only when such powers are considered necessary to prevent such an act taking place. This must be authorised by a senior officer, at least at the rank of assistant chief constable, and the area and duration of the authorisation must be no greater than is necessary to prevent such an act. Section 47A of TACT stop and search powers replaced similar powers under section 44 of TACT on 18 March 2011. Further information on these searches can be found in the user guide.
In the last 8 years, stop and search powers under section 47A of TACT were not used. In the year ending March 2018, there were 149 stop and searches under section 47A of TACT, details of which can be found in the bulletin from that year.
2.4 Reason for search under section 1 PACE legislation
There are several reasons why the police may carry out a section 1 PACE stop and search, such as having reasonable grounds to suspect that an individual is carrying drugs or a weapon. Any further arrests from a PACE search may not be related to the first reason for the search; for example, an officer may suspect that an individual is carrying drugs but arrest them if they are found to be carrying a weapon. As a result, while arrest rates give an overall picture of the number of searches leading to arrests, they do not give insight into arrest rates for specific offence categories. More information on how frequently arrests (and other outcomes) are linked to the first reason for the search can be found in the link between search reason and outcome section. The data quality section also includes information on data collected on reason for arrest. Reason for arrest data is provided in the Stop and search summary data tables, year ending 31 March 2026, table SS_54 as ’Official Statistics in development’.
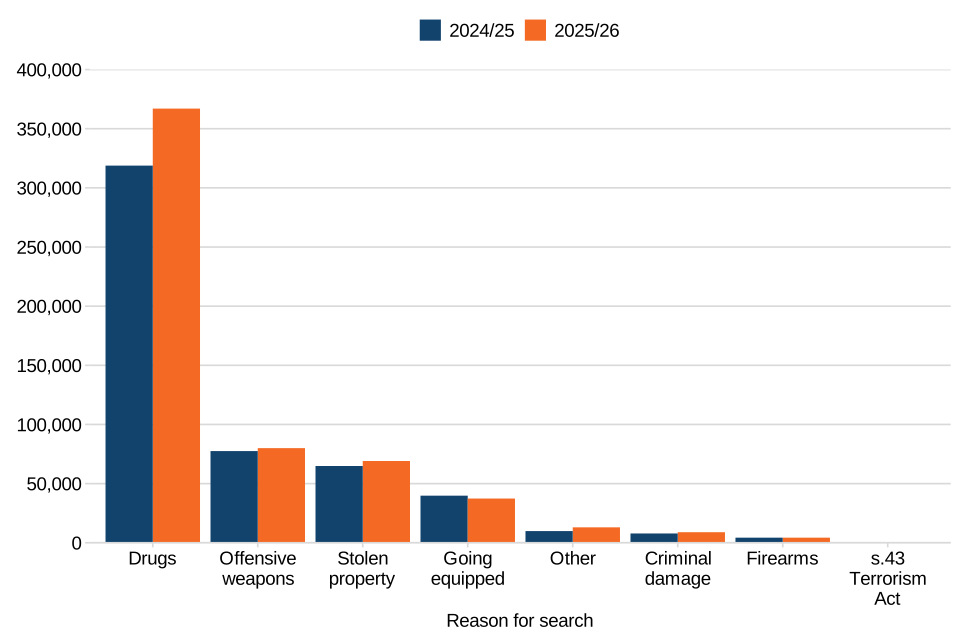
As in previous years, the most common reason for carrying out a PACE stop and search was on suspicion of drug possession. These made up 63.3% of all stop and searches in the year ending March 2026, a slightly higher proportion than the year ending March 2025 (60.9%) (table 2.1). The proportion and number of drugs searches steadily increased between the year ending March 2018 and year ending March 2021, but then reduced between then and the year ending March 2024. The peak in the year ending March 2021 may have been affected by proactive searches for drugs during national lockdowns throughout the COVID-19 pandemic.
The proportion of searches on people suspected to be in possession of an offensive weapon, stolen property or going equipped for stealing decreased slightly in the year ending March 2026 (table 2.1).
Table 2.1: Proportion of Section 1 PACE stop and searches, year ending March 2020 to year ending March 2026, England and Wales
| Reason for search | Year ending March 2020 |
Year ending March 2021 |
Year ending March 2022 |
Year ending March 2023 |
Year ending March 2024 |
Year ending March 2025 |
Year ending March 2026 |
|---|---|---|---|---|---|---|---|
| Drugs | 62.6 | 68.7 | 64.7 | 61.2 | 59.7 | 60.9 | 63.3 |
| Offensive weapons | 16.1 | 12.2 | 15.7 | 15.9 | 16.0 | 14.8 | 14.6 |
| Stolen property | 10.2 | 8.0 | 9.3 | 10.3 | 11.4 | 12.4 | 10.5 |
| Going equipped | 7.3 | 7.1 | 6.5 | 7.6 | 8.2 | 7.6 | 7.2 |
| Other | 2.1 | 2.3 | 1.6 | 2.4 | 2.2 | 1.9 | 2.1 |
| Criminal damage | 0.8 | 0.8 | 1.1 | 1.5 | 1.5 | 1.5 | 1.3 |
| Firearms | 0.8 | 0.7 | 0.9 | 1.0 | 1.0 | 0.8 | 0.8 |
| s.43 Terrorism Act 2000 | 0.1 | 0.1 | 0.1 | 0.1 | 0.0 | 0.0 | 0.0 |
Source: ‘Stop and search open data tables, year ending 31 March 2007 to year ending 31 March 2020 and ’Stop and search open data tables, year ending 31 March 2021 to year ending 31 March 2026’, Home Office
Notes:
- The ‘other’ search category includes reasons such as fireworks, drones or unmanned aircraft and suspicion-led searches for items related to protest related offences.
- Due to rounding, percentages may not add up to 100.
There were differing trends in the volume of stop search for different search reasons in the year ending March 2026. Whereas searches for drugs (up 15.1%), items related to criminal damage (up 13.9%), stolen property (up 6.5%) and offensive weapons (up 3.3%) increased, the number of searches for firearms remained broadly unchanged and there was a decrease in searches for items related to ‘going equipped’ (down 6.0%) (figure 2.4).
Figure 2.4: Section 1 PACE stop and searches by reason for search, the year ending March 2025 compared with the year ending March 2026, England and Wales
Source: Stop and search summary data tables, year ending 31 March 2026; table SS_03, Home Office
Notes:
- The ‘other’ search category includes searches for reasons such as fireworks, drones or unmanned aircraft and searches for items related to protest related offences.
- In the year ending March 2025 there were 120 searches under s.43 of the Terrorism Act, and in the year ending March 2026 there were 230 searches.
2.5 Outcomes from stop and search
It should be noted that, for this data collection, only one outcome (the principal outcome) per stop and search is recorded and subsequent sanctions are not included. For example, if an arrest is made following a stop and search and, subsequently, a caution is also issued, only the arrest will be counted. For further information about how outcomes are recorded and for detail on data quality issues, please see the user guide.
2.5.1 Trends in arrest rates
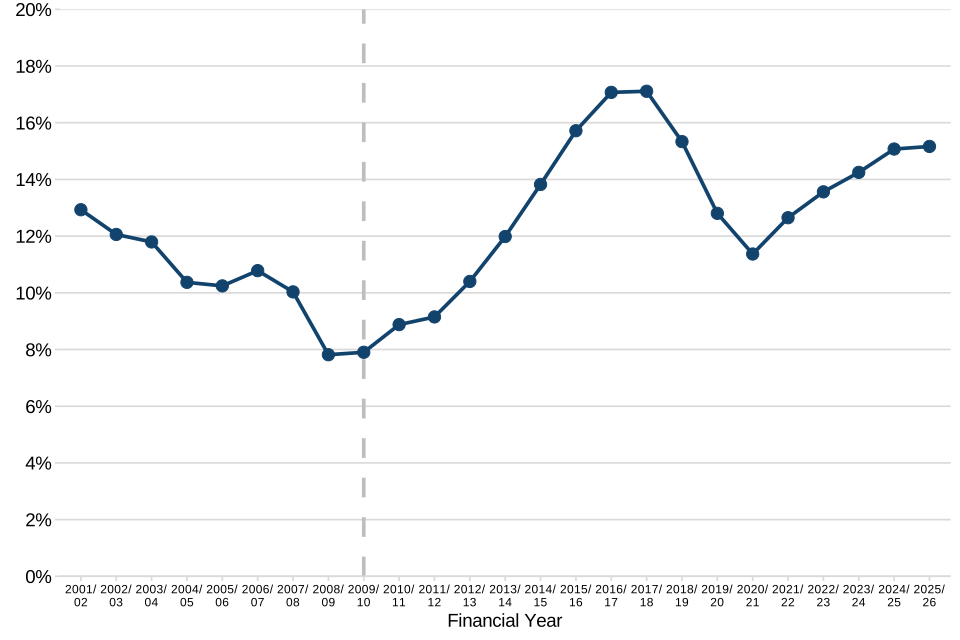
The number of arrests following searches under all legislation increased by 9,202 (up 11.5% to 88,944) in the year ending March 2026. This equated to 15.2% of all searches, compared with 15.1% in the year ending March 2025. The arrest rate has increased each year since the year ending March 2021, when it was 11.4%, however it remains below the peak of the arrest rate (17.1%) in the year ending March 2017 and year ending March 2018.
Figure 2.5: Arrest rate under all stop and search legislation, year ending March 2002 to year ending March 2026, England and Wales
Source: Stop and search summary data tables, year ending 31 March 2026; table SS_21, Home Office
Notes:
- Data collected before the year ending March 2010 does not include the British Transport Police (BTP). Due to this, stop and search data before the year ending March 2010 is not directly comparable with more recent years. BTP usually makes up between 1.0% and 3.0% of all stop and search across England and Wales each year.
The number of arrests following a section 1 PACE search increased by 9,194 (11.6%) in the year ending March 2026. The total number of section 1 PACE searches increased by 56,891 (10.9%) over the same time period. This led to a small rise in the arrest rate, up from 15.2% in the year ending March 2025 to 15.3% in the year ending March 2026.
Arrests under section 60 CJPOA account for a very small proportion of all arrests following a stop and search (225 out of 88,944 arrests or 0.3%). The arrest rate in the year ending March 2026 for section 60 searches was 3.5%, compared with 3.6% in the year ending March 2025.
Arrest is just one possible outcome following a stop and search. Data on other outcomes from stop and search can be found in the next section (2.5.2).
2.5.2 All outcomes resulting from a stop and search
Since the year ending March 2017, police forces have reported on a wider range of outcomes including:
- arrests
- cautions
- summons
- penalty notices for disorder
- cannabis or khat warnings
- community resolutions
- no further action
Since the year ending March 2021, the Home Office have expanded the list of outcomes to also include:
- voluntary attendance
- verbal warning or words of advice
- seizure of property
- guardian intervention
- other action
In years prior to the year ending March 2021, the new options would have been classed as ‘no further action’. Therefore, comparisons with previous years on the proportion of searches that resulted in ‘no further action’ should be interpreted with caution. A full breakdown of stop and search outcomes is available in the Stop and search open data tables, year ending 31 March 2021 to year ending 31 March 2026 accompanying this publication.
This data includes searches under section 1 Police and Criminal Evidence Act (PACE), section 60 of the Criminal Justice and Public Order Act 1994, section 342E of the Sentencing Act and Section 11 of the Public Order Act. In 64.3% of stop and searches the outcome was recorded as needing ‘no further action’. In a further 15.2% the initial outcome was an arrest and an alternative outcome was given in the remaining 20.5% of cases. These proportions are all similar to the year ending March 2025 (table 2.2).
Table 2.2: Proportion of outcomes following a stop and search, in the year ending March 2025 and the year ending March 2026, England and Wales
| Outcome | Proportion in Year ending March 2025 |
Proportion in Year ending March 2026 |
|---|---|---|
| Arrest | 15.1 | 15.2 |
| Community resolution | 8.9 | 10.1 |
| Summons | 1.3 | 1.7 |
| Verbal warning or words of advice | 1.9 | 2.5 |
| Penalty notice for disorder | 0.7 | 0.7 |
| Khat or cannabis warning | 0.4 | 0.3 |
| Other action | 1.9 | 2.2 |
| Seizure of property | 1.2 | 1.5 |
| Voluntary attendance | 1.7 | 1.2 |
| Caution | 0.3 | 0.3 |
| Guardian intervention | 0.0 | 0.0 |
| No further action | 66.8 | 64.3 |
Source: Stop and search outcomes summary data tables, year ending 31 March 2026, table SSO_01; Home Office
Notes:
- Includes British Transport Police.
- The Metropolitan Police include fixed penalty notices within penalty notice for disorder outcomes, which may have an impact this value.
If the outcomes introduced in the year ending March 2021 are considered to be ‘no further action’ (as they would have been before that year), then 71.7% of searches in the year ending March 2026 resulted in ‘no further action’, a similar proportion as in the year ending March 2024 (73.3%).
2.5.3 Link between outcome and reason for a stop and search
This section excludes cases where an object was found but the link between the reason for search and outcome is unknown, or where it’s unknown whether an object was found.
In the year ending March 2026, 24.2% of stop and searches resulted in an outcome that was linked to the reason for the search, a slight increase compared with the year ending March 2025 (23.9%). However, this varied by the reason for search. For example, 29.2% of drugs searches resulted in a linked outcome, whereas just 1.7% of searches under Section 60 of the Criminal Justice and Public Order Act 1994 resulted in a linked outcome. This lower rate for Section 60 searches reflects the fact that they are undertaken to try and resolve violent situations quickly in a specific area, without reasonable grounds to suspect the people being searched.
Table 2.3: Proportion of stop and search where the outcome of the stop was linked to the reason for the stop and search, by reason for stop, year ending March 2026, England and Wales
| Reason for search | Outcome linked to reason for search | Outcome not linked | Nothing found |
|---|---|---|---|
| Drugs | 29.2 | 3.7 | 67.0 |
| Stolen property | 26.0 | 8.0 | 65.9 |
| Firearms | 13.2 | 9.5 | 77.3 |
| Offensive weapons | 12.1 | 7.5 | 80.4 |
| Criminal damage | 10.0 | 6.1 | 83.9 |
| Going equipped | 9.4 | 11.4 | 79.2 |
| S.43 (Terrorism) | 1.9 | 8.8 | 89.3 |
| Items in connection with protest related offences: suspicion-led | 18.2 | 16.5 | 65.3 |
| Drone or unmanned aircraft | [z] | [z] | [z] |
| Other | 26.2 | 7.1 | 66.7 |
| Total Section 1 PACE | 24.5 | 5.4 | 70.1 |
| S.60 (Violence) | 1.7 | 6.5 | 91.7 |
| Serious violence reduction order | 1.1 | 4.9 | 94.0 |
| Items in connection with protest related offences: suspicion-less | [z] | [z] | [z] |
| Total | 24.2 | 5.4 | 70.3 |
Source: Stop and search open data tables, year ending 31 March 2021 to year ending 31 March 2026, Home Office
Notes:
- Proportion calculations do not include cases where an object was found however the link between the reason for search and outcome is unknown, or where it’s unknown whether an object was found.
- The ‘other’ search category includes searches under Section 1 PACE that do not fall into other categories.
- Due to rounding, percentages may not add up to 100.
- Percentages are not shown for search categories where the total number of stop and searches was less than 50. These are represented by [z] values.
2.5.4 Weapons found from stop and search – Official statistics in development
The Home Office stop and search data collection was expanded in the year ending March 2021 so that police forces can provide more detailed information on whether an offensive weapon or firearm was found in a stop and search encounter. Previously, data was only collected on whether an offensive weapon was found from a search conducted under section 60 of the Criminal Justice and Public Order Act. Furthermore, in the year ending March 2024, the collection was expanded to include information on whether the weapon found was a bladed article, firearm or other type of offensive weapon.
Due to the differences in how forces record property found during a stop and search, caution should be taken when interpreting these statistics. Furthermore, although the data collected may indicate that a firearm and offensive weapon were found during a stop and search of an individual, it does not show the volume of weapons found in a single search. Therefore, the figures presented below are likely to be and undercount of the actual number of weapons found and should be treated with caution. See the user guide for more information on the data quality issues of these statistics.
In the year ending March 2026, 16,587 (2.8%) of stop and searches resulted in an offensive weapon or firearm being found. Of these, 4,065 (24.5%) were when the initial search reason was for drugs, equating to 1.1% of all drugs searches. Searches carried out for firearms and offensive weapons had the highest find rate at 15.1% (647) and 12.1% (9,673) respectively. A full breakdown of all search reasons and force breakdown can be found in the Stop and search summary data tables, year ending 31 March 2026; tables SS_43 and SS_46.
At least partial data on the specific type of offensive weapon found was provided by 43 of the 44 police forces (including BTP) in the year ending March 2026. Of the 16,587 stop and searches in which an offensive weapon or firearm were found, a more specific description was given in 11,069 searches (66.7%). Of those records with a more detailed description (excluding those 5,518 cases where a description was not given), there were 6,878 searches in which a bladed article was found (62.1%), 858 (7.8%) in which a firearm was found and 3,759 (34.0%) in which another type of offensive weapon was found. Given the incomplete nature of this dataset, the number of bladed articles, firearms and other offensive weapon types found should be treated with caution.
A year earlier, in the year ending March 2025, 36 forces were able to provide information on the type of offensive weapon found. When comparing data in the year ending March 2025 and year ending March 2026 for these 36 forces, there has been a 19.4% increase in searches in which a bladed article was found (up from 3,472 to 4,147). However, there was a 17.7% decrease in searches in which a firearm was found (down from 384 to 316). Lastly, there has been a 15.6% increase in searches in which any other type of offensive weapon was found (up from 2,215 to 2,560).
Table 2.4: Number of stop and searches in which a bladed article, firearm or other offensive weapon was found years ending March 2025 and March 2026, in comparative forces (36 out of 44)
| Year | Year ending March 2025 |
Year ending March 2026 |
Percentage change |
|---|---|---|---|
| Bladed article found | 3,472 | 4,147 | 19.4% |
| Firearm found | 384 | 316 | -17.7% |
| Other offensive weapon found | 2,215 | 2,560 | 15.6% |
Source: Stop and search summary data tables, year ending 31 March 2026, table SS_47, Home Office
Notes:
- Includes data for 36 police forces who provided data for all weapon types: Avon and Somerset, Bedfordshire, British Transport Police, Cambridgeshire, Cheshire, City of London, Cleveland, Cumbria, Derbyshire, Devon and Cornwall, Dorset, Dyfed-Powys, Essex, Greater Manchester, Hampshire, Hertfordshire, Humberside, Kent, Lancashire, Leicestershire, Lincolnshire, Norfolk, North Wales, North Yorkshire, Northamptonshire, Nottinghamshire, South Yorkshire, Staffordshire, Suffolk, Surrey, Sussex, Thames Valley, Warwickshire, West Mercia, West Midlands and Wiltshire. These 36 forces accounted for 58.6% of searches in the year ending March 2025 and 57.9% of searches in the year ending March 2026.
2.6 Demographics of persons stop and searched
2.6.1 Ethnicity of persons searched
When a stop and search is undertaken, the person being searched is asked by the police which ethnic group they consider themselves to belong to. This is a measure of “self-defined” ethnicity rather than “officer observed” and is the preferred measure of ethnicity. For the purpose of analysis, the 19 ethnicity categories as defined by the ONS 2021 Census, were grouped into the following categories, which are available in the Stop and search open data tables:
- Asian (or Asian British)[footnote 4]
- Black (or Black British)
- Mixed
- White
- Other Ethnic Group
- Not stated
Additionally, officer-observed ethnicity may also be recorded as one of the following:
- Asian
- Black
- White
- Other
Since the year ending March 2021, the Home Office have collected stop and search data on both the “officer observed” ethnicity and the “self-defined” ethnicity of the person searched, for individual records. This means that if the SDE of the person searched was not stated, officer-observed ethnicity can be used as a replacement for analytical purposes. However, one limitation of this approach is that there is no ‘mixed’ category in the options for ‘officer-observed ethnicity’. For the purposes of analysis, the ‘mixed’ and ‘other’ ethnic groups are combined in any analysis where officer-observed ethnicity is used in place of SDE, where the latter is ‘not stated’.
This section begins by examining the ethnicity of people stopped and searched using the traditional method, based solely on SDE. The latter section uses the combined approach, in which when the SDE of the person searched was not stated, officer-observed ethnicity is used instead. The approach is an attempt to reduce uncertainty in disparity rates based solely on SDE, caused by the growing proportion of records in which this information is not stated (18.1% in the year ending March 2026). This combined approach is only possible for data in the latest 6 reporting years.
It is important that a ‘like-for-like’ approach is used when making comparisons between years. That is, when assessing the trend in disparity rates, users should not use the rate based on the combined approach for the latest year and compare it to the rate based on the traditional approach for the previous year. It is advisable to use the traditional approach when making long-terms comparisons, however the newer (combined) approach can be used for the most recent 6 years. We are working with forces to improve SDE data quality.
SDE of persons searched
The MPS consistently make up a large proportion of all stop and searches in England and Wales (24.6% in the year ending March 2026) and also has a larger proportion of ethnic minorities (not including White minorities) within its resident population (46%) compared to the rest of England and Wales (13% - excluding MPS)[footnote 5]. Table 2.5 presents the data for the MPS area separately, as well as distinct England and Wales totals, with one including and one excluding the MPS area. Table 2.4 shows that stops of individuals who define themselves as Black, Asian and Other minority ethnic groups make up a larger proportion of all stops in the MPS area when compared with forces in the rest of England and Wales.
Table 2.5: Proportion of stop and searches by self-defined ethnic group, year ending March 2026, England and Wales (E&W) and the MPS area
| Legislation | Police force areas | Asian | Black | Mixed | White | Other | Not stated |
|---|---|---|---|---|---|---|---|
| All searches | E&W excl. MPS | 9.3 | 6.6 | 3.3 | 64.7 | 1.9 | 14.2 |
| All searches | MPS | 10.6 | 25.0 | 4.9 | 25.7 | 4.0 | 29.8 |
| All searches | England and Wales | 9.7 | 11.2 | 3.7 | 54.9 | 2.4 | 18.1 |
| Population | E&W excl. MPS | 7.3 | 2.4 | 2.4 | 88.6 | 1.4 | - |
| Population | MPS | 20.7 | 13.5 | 5.7 | 53.7 | 6.3 | - |
| Population | England and Wales | 9.3 | 4.0 | 2.9 | 81.7 | 2.1 | - |
Sources: Stop and search summary data tables, year ending 31 March 2026, table SS_24 and table P_1, Home Office
Notes:
- Does not include vehicle only searches.
- Includes searches under section 1 PACE and associated legislation, section 60 of the Criminal Justice and Public Order Act 1994, section 342E of the Sentencing Act and Section 11 of the Public Order Act.
- Due to rounding, percentages may not add up to 100.
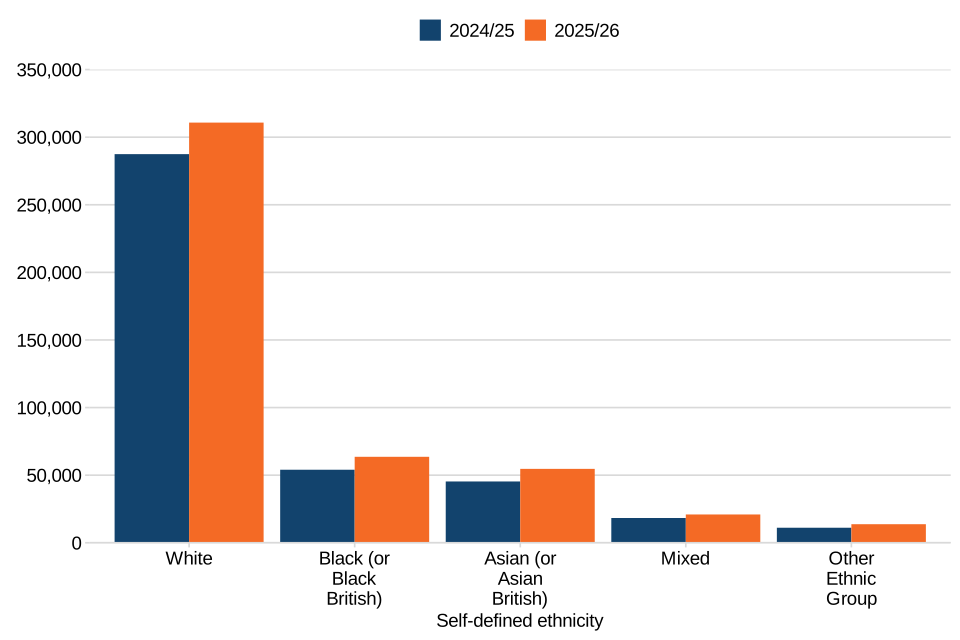
The largest percentage increase in the number of searches was seen for people who self-defined as being from an Other Ethnic Group, an increase of 2,650 (23.9%), from 11,101 to 13,751 in the year ending March 2026. There were similar increases in searches of people who self-defined their ethnicity as Asian or Asian British (up 20.6% from 45,336 to 54,673), Black or Black British (up 17.7% from 54,021 to 63,567) and those who self-defined as Mixed (up 14.2% from 18,319 to 20,917). There was a relatively smaller percentage increase in the number of searches of people who self-defined as White (up 8.1% from 287,462 to 310,772).
Figure 2.6: Number of stop and searches by SDE, the year ending March 2025 compared with the year ending March 2026, England and Wales
Source: Stop and search summary data tables, year ending 31 March 2026; table SS_16, Home Office
Notes:
- Includes searches under section 1 PACE and associated legislation, section 60 of the Criminal Justice and Public Order Act 1994, section 342E of the Sentencing Act and Section 11 of the Public Order Act.
- Includes British Transport Police.
Caution should be taken when interpreting search rates at the national level because force areas vary in their ethnic composition (and in their level of missing ethnicity data); an average national figure presumes that all stop and searches and ethnic groups are spread evenly across forces, whereas these differ considerably between forces. Furthermore, even within a PFA there can be significant variation in terms of the distribution of different ethnic groups, which may be hidden by the force level averages. One notable example of this is the Metropolitan Police PFA[footnote 6] which is made up of several boroughs where ethnic minorities (not including White minorities) make up the majority of the resident population, and others where they form a minority of the resident population. For this reason, more insightful analysis is possible at smaller geographical levels than PFA. See section 2.8 and Annex A.2 for more information on stop and search ‘hotspots’.
It’s important to note that population figures are based on residential estimates and do not account for transient populations - such as commuters or tourists - who regularly move in and out of an area without living there. This can significantly affect interpretation in places with large working or visitor populations. Furthermore, when calculating rates, individuals who have not provided their ethnicity are excluded. In the year ending March 2026, the level of missing ethnicity data (self-defined) was 18.1%. While the proportion of missing ethnicity data in the latest year is an improvement on the year ending March 2025 (18.5%), the year ending March 2024 (19.4%) and year ending March 2023 (20.6%), it is still significantly higher than March 2011, when SDE was not stated for just 4.2% of searches. This adds further uncertainty to the trends discussed below. To improve this level of uncertainty, we have repeated this analysis using officer-observed ethnicity where SDE is not stated – see the ‘Combined disparity measure’ section below for more detail.
The following analysis compares the overall rate of stop and search per 1,000 population for each ethnic group based on SDE (using the 2021 5+1 Census categories) against the relative rate at which people from each ethnicity are stopped and searched in comparison to White individuals. A relative rate of less than one indicates a lower likelihood, whilst a relative rate greater than one indicates a higher likelihood. For example, a relative rate of 2 would mean that a group is stopped twice as much as the White group.
Traditional disparity measure
In the year ending March 2026, people identifying as Black or Black British were searched at a rate 4.1 times that of those from a White ethnic group across England and Wales. This is a slight increase when compared with the year ending March 2025, when Black people were searched at a rate 3.8 times that of White people. However, the rate in the year ending March 2026 was lower the year ending March 2022 (4.8) and year ending March 2021 (5.5).
In the year ending March 2026, people identifying as Asian or Asian British were searched at a rate 1.6 times that of the White ethnic group. In the year ending March 2026, people identifying as Mixed were searched at a rate 1.9 times that of White people, and people from Other ethnic groups 1.7 times (table 2.6).
Table 2.6: Comparison of the rate at which people were searched relative to individuals who self-define their ethnicity as White, year ending March 2011 to year ending March 2026, England and Wales
| Year | Asian (or Asian British) | Black (or Black British) | Mixed | Other ethnic group |
|---|---|---|---|---|
| Year ending March 2011 |
2.0 | 6.5 | 1.8 | 1.6 |
| Year ending March 2012 |
1.8 | 5.9 | 1.8 | 1.5 |
| Year ending March 2013 |
1.5 | 4.4 | 1.6 | 1.3 |
| Year ending March 2014 |
1.4 | 4.1 | 1.5 | 1.3 |
| Year ending March 2015 |
1.3 | 4.4 | 1.6 | 1.4 |
| Year ending March 2016 |
1.8 | 6.5 | 2.1 | 1.8 |
| Year ending March 2017 |
2.0 | 8.4 | 2.4 | 2.0 |
| Year ending March 2018 |
2.3 | 9.5 | 2.8 | 2.4 |
| Year ending March 2019 |
2.5 | 9.7 | 2.7 | 2.7 |
| Year ending March 2020 |
2.5 | 8.9 | 2.6 | 2.9 |
| * | * | * | * | * |
| Year ending March 2021 |
1.8 | 5.5 | 1.7 | 1.2 |
| Year ending March 2022 |
1.6 | 4.8 | 1.7 | 1.2 |
| Year ending March 2023 |
1.4 | 4.1 | 1.7 | 1.3 |
| Year ending March 2024 |
1.3 | 3.7 | 1.7 | 1.4 |
| Year ending March 2025 |
1.4 | 3.8 | 1.8 | 1.5 |
| Year ending March 2026 |
1.6 | 4.1 | 1.9 | 1.7 |
Source: Stop and search summary data tables, year ending 31 March 2026; table SS_18, Home Office
Notes:
- Includes searches under all relevant legislation.
- Population breakdowns used to calculate the disparity figures are based on the 2011 Census for all years up to the year ending March 2020, and the 2021 Census for the latest 6 years. Therefore, caution should be taken when comparing between these periods.
Combined disparity measure
Self-defined and officer-observed ethnicity of people searched
As shown in table 2.5, in the year ending March 2026, SDE was ‘not stated’ for approximately one in every 5 searches of people (18.1%). This increases the uncertainty in the figures presented above. Table 2.7 presents the data in a different way; where the SDE of the person searched is not stated, officer-observed ethnicity is used instead. This reduces the proportion of stops with unknown ethnicity from 18.1% to 1.6%.
Table 2.7: Proportion of stop and searches by ethnic group, combined disparity measure, year ending March 2026, England and Wales (E&W) and the MPS area
| Legislation | Police force area(s) | Asian | Black | Mixed or Other | White | Not stated |
|---|---|---|---|---|---|---|
| All searches | E&W excl. MPS | 11.6 | 8.9 | 6.1 | 71.8 | 1.6 |
| All searches | MPS | 14.7 | 38.2 | 11.1 | 34.3 | 1.6 |
| All searches | England & Wales | 12.4 | 16.3 | 7.3 | 62.4 | 1.6 |
| Population | E&W excl. MPS | 7.3 | 2.4 | 3.8 | 86.6 | - |
| Population | MPS | 20.7 | 13.5 | 12.1 | 53.7 | - |
| Population | England & Wales | 9.3 | 4.0 | 5.0 | 81.7 | - |
Source: Stop and search summary data tables, year ending 31 March 2026; table SS_25, Home Office
Notes:
- Does not include vehicle only searches.
- Includes searches under all relevant legislation.
- Table uses officer-observed ethnicity in place of SDE for records where SDE is ‘not stated’.
- Due to rounding, percentages may not add up to 100.
Looking at the data in this way increases the disparity rates for people from ethnic minorities (not including White minorities), especially for Black people. This suggests that SDE is more likely to be ‘not stated’ or missing when the person searched was from an ethnic minority group. This is further shown by the fact that when looking at the data by SDE only, the MPS has a higher number of White people stop and searched (36,469) than Black people stop and searched (35,479). However, using the combined ethnicity measure, the opposite is true, with 54,220 Black people stop and searched compared with 48,659 White people stop and searched.
Using officer-observed ethnicity in place of SDE (when the latter is ‘not stated’) the disparity for ethnic minorities (not including White minorities) in the year ending March 2026 was 2.6 (compared with 2.2 using the measure solely using SDE data). This compares with a disparity of 2.4 in the year ending March 2025.
There was a relatively larger increase in the disparity rate when looking at the differential for Black people, who had a disparity of 5.3 using this methodology. This disparity compares with 4.1 using the measure solely based on SDE data. A relatively smaller increase is seen in the differential for Asian people, who had a disparity of 1.8 using this methodology (compared with 1.6 using the measure solely based on SDE data). To see how this compares with the previous 5 reporting years, see the Stop and search summary data tables, year ending 31 March 2026; table SS_19.
Disparity rates by reason for search
The following analysis uses a combination of SDE and officer-observed ethnicity. Disparity rates for England and Wales overall for searches under section 60 of the Criminal Justice and Public Order Act should be interpreted with caution, due to the localised nature of section 60 searches.
There is some variation in the disparity rates depending on the reason why searches were conducted. For offensive weapon searches (under section 1 PACE) and searches under section 60 of the Criminal Justice and Public Order Act, Black people were searched at a rate 7.3 and 22.7 times that of White people (compared with a disparity of 5.3 for all stop and searches). However, searches of Black people for articles to commit criminal damage had a rate 1.4 times that of White people (table 2.8).
Asian and ‘other or mixed’ individuals were less likely than White individuals to be stopped and searched for reasons of criminal damage (0.5 and 0.9 respectively).
Table 2.8: Stop and search disparity, compared with the White ethnic group, by reason for search, year ending March 2026, England and Wales
| Reason for search | Asian (or Asian British) | Black (or Black British) | Other Ethnic Group or Mixed |
|---|---|---|---|
| Stolen property | 1.2 | 6.5 | 2.4 |
| Drugs | 2.0 | 5.0 | 1.9 |
| Firearms | 2.4 | 5.7 | 1.7 |
| Offensive weapons | 1.8 | 7.3 | 2.3 |
| Going equipped | 1.1 | 2.7 | 1.4 |
| Criminal damage | 0.5 | 1.4 | 0.9 |
| Other | 1.6 | 2.6 | 1.8 |
| s.60 CJPOA | 3.8 | 22.7 | 3.5 |
| All stop and search | 1.8 | 5.3 | 1.9 |
Source: Stop and search summary data tables, year ending 31 March 2026; table SS_41, Home Office
Notes:
- Figures in the table show the disparity between the ethnic group shown and the White ethnic group.
- Ethnic group is based on a combination of SDE and officer-observed ethnicity.
- The ‘other’ search category includes searches for reasons such as fireworks, drones or unmanned aircraft and searches for items related to protest related offences.
Outcomes by self-defined and officer-observed ethnicity
Table 2.9 shows the outcome rates for each ethnic group. If the SDE of the person searched was ‘not stated’, then the officer-observed ethnicity is used instead.
People who self-defined their ethnicity as either ‘Mixed or Other’ (or perceived by the officer to belong to one of those ethnic groups, if not stated) had the highest arrest rate, at 17.9%. Black people had an arrest rate of 16.1%, White people had an arrest rate of 15.0%, and people who self-defined or were perceived to be of Asian ethnicity had the lowest arrest rate (13.7%).
Table 2.9: Proportion of outcomes following a stop and search by ethnic group, year ending March 2026, England and Wales
| Outcome | Asian | Black | Mixed or Other | White | Not known | All person searches |
|---|---|---|---|---|---|---|
| Arrest | 13.7 | 16.1 | 17.9 | 15.0 | 12.8 | 15.1 |
| Community resolution or cannabis warning | 12.4 | 10.6 | 11.5 | 10.2 | 7.5 | 10.6 |
| Penalty notice for disorder | 1.3 | 1.5 | 1.0 | 0.4 | 0.4 | 0.7 |
| Summons | 1.4 | 1.3 | 1.5 | 1.9 | 1.0 | 1.7 |
| Other | 6.8 | 4.6 | 6.3 | 8.1 | 6.7 | 7.2 |
| No further action | 64.6 | 66.0 | 61.8 | 64.5 | 71.7 | 64.7 |
Source: Stop and search outcomes summary data tables, year ending 31 March 2026; table SSO_11, Home Office
Notes:
- Due to rounding, percentages may not sum to 100.
- Does not include vehicle only searches.
- Cannabis warnings and community resolutions are grouped as many police forces no longer issue cannabis warnings.
- ‘Other’ outcomes include caution, voluntary attendance, verbal warning, seizure of property, guardian intervention or other action.
- Ethnic group is based on a combination of SDE and officer-observed ethnicity.
- The Metropolitan Police include fixed penalty notices within penalty notice for disorder outcomes, which may have an impact on the breakdown of those outcomes by ethnic group.
Resultant arrest by reason for search and ethnicity
The proportion of searches which result in an arrest differs by the reason for search, however differences between ethnic groups were on the whole small, with a few exceptions.
Searches for stolen property and firearms resulted in some of the higher arrest rates. People belonging to the Mixed or Other ethnic group had a high arrest rate following searches for stolen property (27.5%). Black and White people had the similar arrest rates for stolen property searches, at 24.3% and 24.7% respectively. Over a fifth (22.9%) of searches of people belonging to the Mixed or Other ethnic group for firearms resulted in an arrest, a higher proportion compared to all other groups.
Table 2.10: Proportion of searches resulting in an arrest, by search reason and ethnic group, year ending March 2026, England and Wales
| Reason for search | Asian or Asian British | Black or Black British | Mixed or other | White | Unknown | All person searches |
|---|---|---|---|---|---|---|
| Criminal damage | 13.4 | 15.7 | 15.7 | 9.2 | 11.9 | 10.1 |
| Drugs | 11.8 | 13.8 | 14.8 | 12.5 | 10.8 | 12.7 |
| Firearms | 19.3 | 18.3 | 22.9 | 20.9 | 14.0 | 20.2 |
| Going equipped | 15.4 | 19.6 | 21.8 | 18.9 | 16.4 | 18.8 |
| Offensive weapons | 17.2 | 18.3 | 21.2 | 18.1 | 15.4 | 18.2 |
| Other | 10.9 | 9.4 | 13.3 | 10.4 | 7.2 | 10.4 |
| Stolen property | 21.8 | 24.3 | 27.5 | 24.7 | 21.0 | 24.6 |
| Anticipation of violence (section 60 CJPOA) | 2.7 | 4.2 | 4.5 | 3.0 | 3.5 | 3.6 |
| Terrorism Act 2000 section 43 | 22.4 | 10.8 | 12.8 | 20.0 | 0.0 | 17.4 |
| Total | 13.4 | 16.1 | 17.9 | 15.0 | 12.8 | 15.1 |
Source: Stop and search open data tables, year ending 31 March 2021 to year ending 31 March 2026, Home Office
Notes:
- Ethnic group is based on a combination of SDE and officer-observed ethnicity.
- Users should note that the underlying search volumes for some ethnic groups may be small and therefore comparisons should be made with caution.
- The ‘other’ search category includes searches for reasons such as fireworks, drones or unmanned aircraft, searches for items related to protest related offences and searches of people with serious violence reduction orders.
Outcome linked by ethnicity
If the SDE of the person searched was ‘not stated’, then the officer-observed ethnicity is used instead.
Overall, an object was found (the ‘find rate’) in 29.4% (162,472) of stops and searches of persons (excluding vehicle only searches and where it was not known whether an object was found or whether the outcome was linked), of which 24.0% (132,835) were linked to the original reason for search.
Table 2.11 shows the ‘find rate’ by ethnic group.
Table 2.11: Proportion of stop and search by whether the outcome of the stop was linked to the reason for the stop and search, by ethnic group, year ending March 2026, England and Wales
| Ethnic group | Find rate | Outcome linked to reason for search | Outcome not linked | Nothing found |
|---|---|---|---|---|
| Asian or Asian British | 29.6 | 24.6 | 5.1 | 70.4 |
| Black or Black British | 29.7 | 23.3 | 6.4 | 70.3 |
| Mixed or Other | 32.2 | 26.1 | 6.1 | 67.8 |
| White | 29.1 | 24.0 | 5.1 | 70.9 |
| All person searches | 29.4 | 24.0 | 5.4 | 70.6 |
Source: Stop and search open data tables, year ending 31 March 2021 to year ending 31 March 2026, Home Office
Notes:
- Proportion calculations do not include cases where an object was found however the link between the reason for search and outcome is unknown, or where it’s unknown whether an object was found.
- Due to rounding, percentages may not add up to 100.
- Ethnic group is based on a combination of SDE and officer-observed ethnicity.
2.6.2 Age of persons searched
Since the year ending March 2021, police forces have supplied data on the age and sex of people stopped and searched. During a stop and search, the person stopped may provide their date of birth or, where this information is refused or not provided, an officer may estimate the person’s age.
The following analysis excludes records where the age of the person searched was not known, and vehicle-only searches.
Of all stop and searches of persons in the year ending March 2026, 52.0% were on people aged between 16 and 30 years old (280,555 out of 539,758 searches). Of these, 51,967 were aged between 16 and 17 (9.6% of the total), 76,697 were 18 to 20 (14.2% of the total) and 151,891 were 21 to 30 (28.1% of the total). Between the year ending March 2021 and year ending March 2026, there has been a steady decrease in the proportion of people aged between 16 and 30 being stopped and searched, down from 65.2% in the year ending March 2021 to 52.0% in the year ending March 2026. Conversely, the proportion of people aged 31 and over has increased from 28.4% to 39.1% over the same period.
Table 2.12: Proportion of stop and searches by age group, year ending March 2021 to year ending March 2026, England and Wales
| Age group | Proportion in year ending March 2021 | Proportion in year ending March 2022 | Proportion in year ending March 2023 | Proportion in year ending March 2024 | Proportion in year ending March 2025 | Proportion in year ending March 2026 |
|---|---|---|---|---|---|---|
| 9 or under | <0.1 | <0.1 | <0.1 | <0.1 | <0.1 | <0.1 |
| 10 to 12 | 0.3 | 0.6 | 0.7 | 0.8 | 0.8 | 0.8 |
| 13 to 15 | 6.1 | 7.8 | 9.2 | 9.2 | 8.6 | 8.2 |
| 16 to 17 | 10.6 | 10.7 | 11.2 | 10.8 | 10.2 | 9.6 |
| 18 to 20 | 19.4 | 17.1 | 16.2 | 14.9 | 14.4 | 14.2 |
| 21 to 30 | 35.1 | 32.7 | 30.0 | 28.8 | 28.6 | 28.1 |
| 31 to 40 | 16.8 | 17.7 | 18.0 | 19.2 | 19.6 | 19.8 |
| 41 to 51 | 8.3 | 9.4 | 10.0 | 11.2 | 11.8 | 12.7 |
| 51 to 60 | 2.8 | 3.4 | 3.9 | 4.3 | 4.8 | 5.3 |
| 61 years and over | 0.5 | 0.6 | 0.7 | 0.8 | 1.0 | 1.2 |
Source: Stop and search open data tables, year ending 31 March 2021 to year ending 31 March 2026, Home Office
Notes:
- There were 42 searches of those aged 9 or under recorded in the year ending March 2021, 70 in the year ending March 2022, 65 in the year ending March 2023, 101 in the year ending March 2024, 206 in the year ending March 2025 and 164 in the year ending March 2026.
- Due to rounding, percentages may not add up to 100.
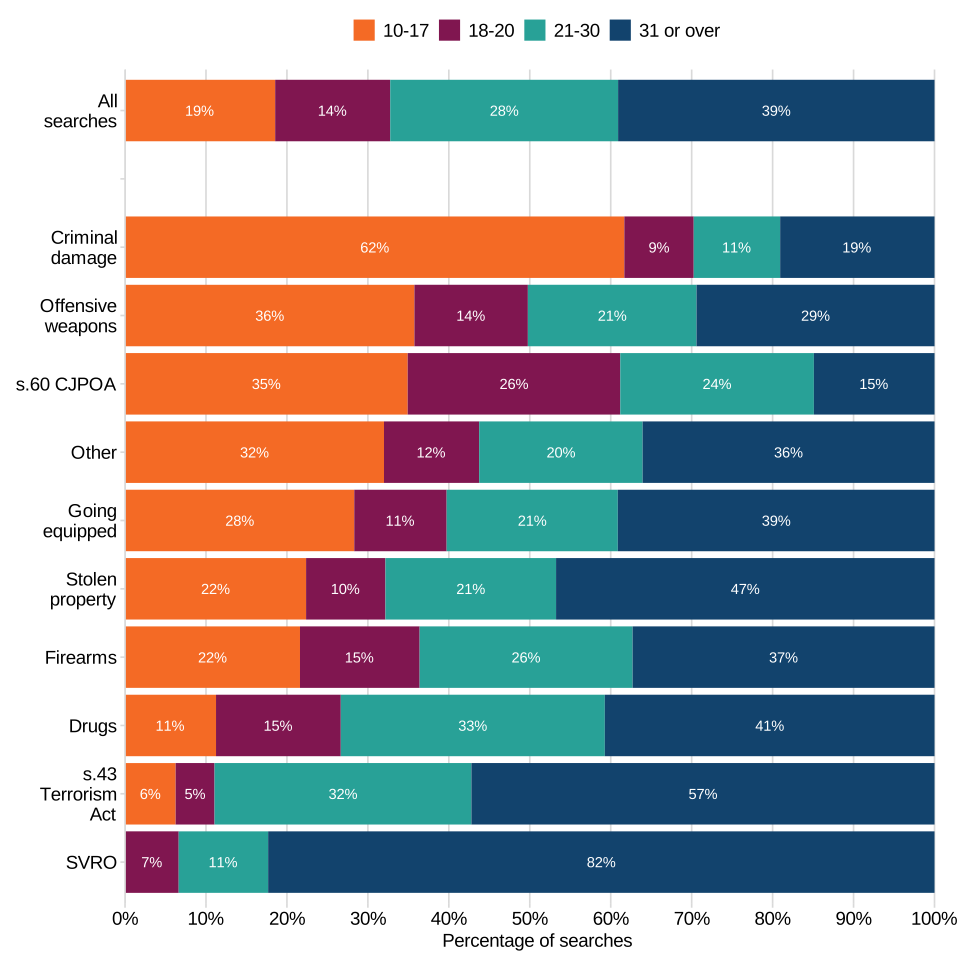
There were some differences in the age of people searched depending on the reason for search. For example, people aged between 10 and 17 made up 61.6% of criminal damage searches, but only 11.2% of drug searches. In contrast, people aged 31 and above made up more than half (57.2%) of section 43 TACT searches, 46.7% of searches for stolen property and 39.1% of searches for going equipped, but only 19.0% of searches for criminal damage (figure 2.7).
Figure 2.7: Proportion of stop and search by age of person searched and reason for search, year ending March 2026, England and Wales
Source: Stop and search summary data tables, year ending 31 March 2026; table SS_30, Home Office
Notes:
- Excludes vehicle only searches and searches where the age of the person searched was not known. Searches with a recorded age of 9 and under (164 searches out of 539,758 searches where the age of the person searched was provided), are not displayed in the figure, but are included in the total used to calculate proportions for the categories that are displayed.
- By law, Serious Violence Reduction Orders (SVROs) can only be given to persons aged 18 or over. In the year ending March 2026, there were 181 searches of people recorded where the reason for search was given as them having a SVRO.
- The ‘other’ search category includes searches for reasons such as fireworks, drones or unmanned aircraft and searches for items related to protest related offences.
Resultant arrest rate of persons searched by age
The analysis described in the section above shows that most stop and search is carried out on younger people (aged below 31) with 18.5% of all searches carried out on those aged 10 to 17, 14.2% on those aged 18 to 20 and 28.1% on those aged 21 to 30. The remaining 39.1% is carried out on people aged 31 and over.
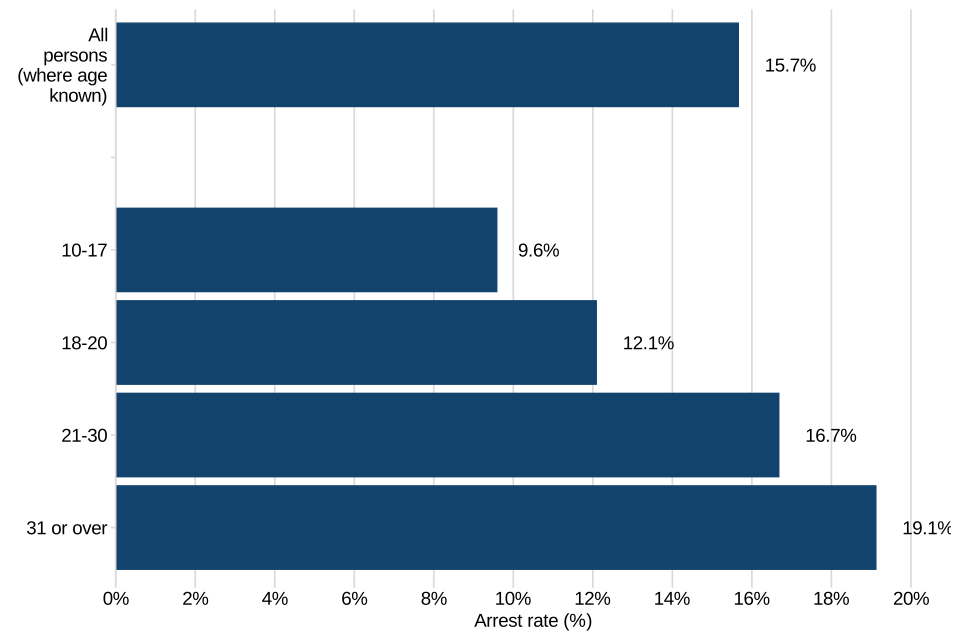
Arrest rates however are lower for the younger age groups, as shown in figure 2.8 below. Just 9.6% of searches on 10 to 17 year olds resulted in an arrest, compared with 12.1% of 18 to 20 year olds, 16.7% of 21 to 30 year olds and 19.1% of those aged 30 and over.
This is likely because younger age groups are dealt with more informally through warnings or community resolutions. The Code of Practice for youth conditional cautions states ‘Youth conditional cautions provide an opportunity, in appropriate cases, to achieve an early, positive response for those young people who are willing to admit their offending and to comply with certain conditions’.
Figure 2.8: Proportion of stop and searches resulting in arrest by age, year ending March 2026, England and Wales
Sources: Stop and search summary data tables, year ending 31 March 2026, table SS_30 and SS_31, Home Office
2.6.3 Sex of persons searched
In this report, we refer to sex rather than gender of people stopped and searched. ‘Sex’ can be considered to refer to whether someone is male or female based on their physiology, with ‘gender’ representing a social construct or sense of self that takes a wider range of forms. However, in reality, the data collected is likely to be a mixture of sex and gender data, depending on force recording systems and practices.
The stop and search data collection gives 4 options to describe the person being searched: female, male, other and unknown.
The following analysis excludes both records where the sex of the person searched was not known and records of vehicle-only searches.
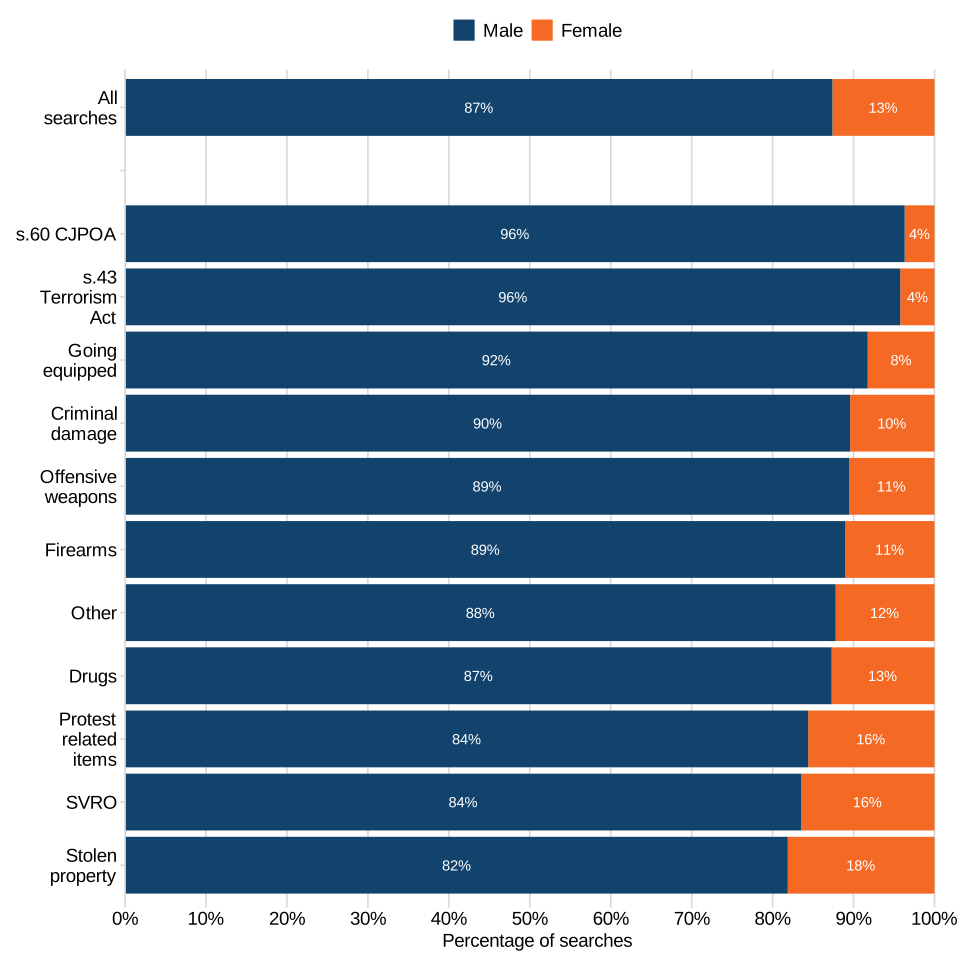
The majority (87.4%) of searches were of males and 12.6% of females. There were a small number of searches (less than 0.1%) of people of ‘other’ sex (220 out of 537,606 searches of people where the sex was recorded), which includes cases recorded by forces as neither male nor female.
There is some variation in the sex of person searched by the reason for search (figure 2.9). For example, females accounted for 18.1% of searches for stolen property, but only 4.2% of searches under section 43 of the Terrorism Act 2000 and 3.7% of searches in anticipation of violence under section 60 CJPOA.
Figure 2.9: Proportion of stop and search by sex of person searched and reason for search, year ending March 2026, England and Wales
Source: Stop and search open data tables, year ending 31 March 2021 to year ending 31 March 2026, Home Office
Notes:
- Excludes vehicle-only searches, and searches where the sex of the person searched was ‘other’ or not known.
- The ‘other’ search category includes searches for reasons such as fireworks and drones or unmanned aircraft.
There was also a small difference in the arrest rate between males and females. 16.2% of searches of males resulted in arrest, slightly higher than the arrest rate for females (12.3%).
2.6.4 Ethnicity, sex and age of persons searched
This section takes a more in-depth look at the sex, age and ethnicity of persons searched, and how the profile of people stopped and searched compares with the population of England and Wales. Stop and search figures in this section include only those with a known age where the sex of the person searched was recorded as male or female. These figures are the number of stop and search incidents rather than number of unique individuals stopped and searched, that is, multiple searches on the same people are counted as separate incidents. Therefore, the rates in this section do not strictly refer to the proportion of the population (or sub-populations) that experienced stop and search in the year ending March 2026. Population rates quoted are based on the 2021 Census.
The following analysis only includes records where the age and sex of the person searched was provided (520,759 records out of the total 586,591 stop and searches in the year ending March 2026) and excludes vehicle-only searches.
Figure 2.10 shows the age and sex of persons searched compared with the population of England and Wales. This shows that stop and search is largely conducted on young males. For example, 16.6% and 44.6% of stop and searches in the year ending March 2026 were on males aged between 10 to 17 and 18 to 34 respectively, whilst these groups make up 4.9% and 10.8% of the overall population. These groups had the highest rate of stop and search, at 36.2 stop and searches per 1,000 population for males aged 18 to 34 and 29.8 stop and searches per 1,000 population for males aged 10 to 17 in the year ending March 2026.
In contrast, females aged between 10 to 17 and 18 to 34 made up only 1.9% and 5.7% of stop and search, respectively despite being 4.6% and 11.1% of the overall population. The proportion of searches of females is lower than their proportion of the population at every age group. For males, only those aged 9 and under, or over 49 were a lower proportion of stop and search than their proportion of the population.
Figure 2.10: Proportion of stop and search by age and sex of person compared with the population, year ending March 2026, England and Wales
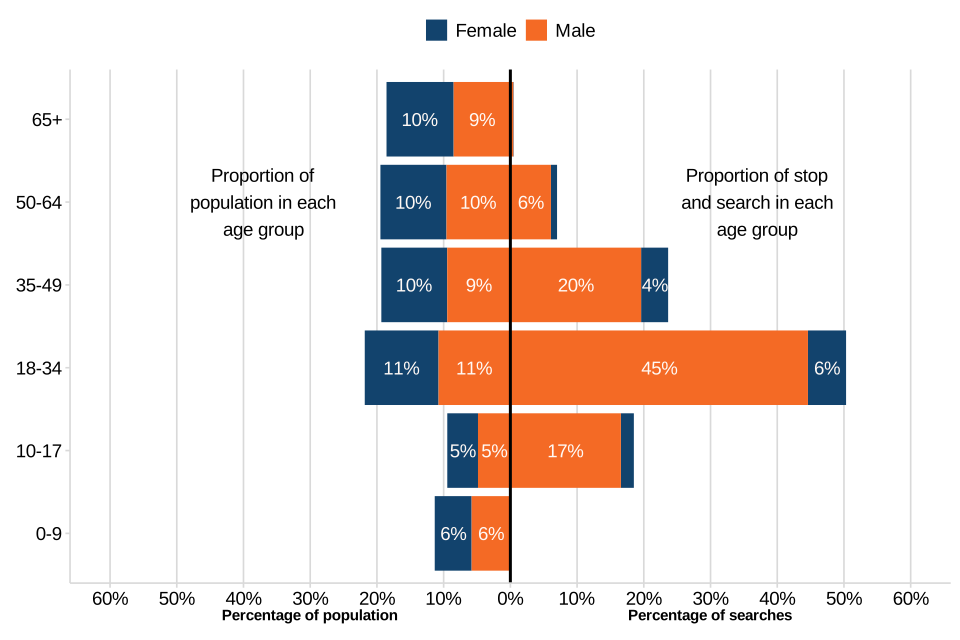
Source: Stop and search summary data tables, year ending 31 March 2026; table SS_32 and table P_2, Home Office
Notes:
- Excludes vehicle-only searches, searches where the sex of the person searched was ‘other’ or not known and searches where the age of the person searched was not known.
Figures 2.11 to 2.14 show the age and sex of people stopped and searched in the year ending March 2026, split by whether the ethnicity of the person searched was White (including White minorities) or another ethnic group, and how that compares with the population of England and Wales within those ethnic groups. Where the SDE of the person searched is not stated, the officer-observed ethnicity is used instead. Searches where both the SDE and officer-observed ethnicity are unknown are not included in the stop and search proportions. Different scales have been used for charts, so comparisons should be made with caution.
Figure 2.11: Proportion of stop and search conducted on White people, by age and sex of person, compared with the population, year ending March 2026, England and Wales
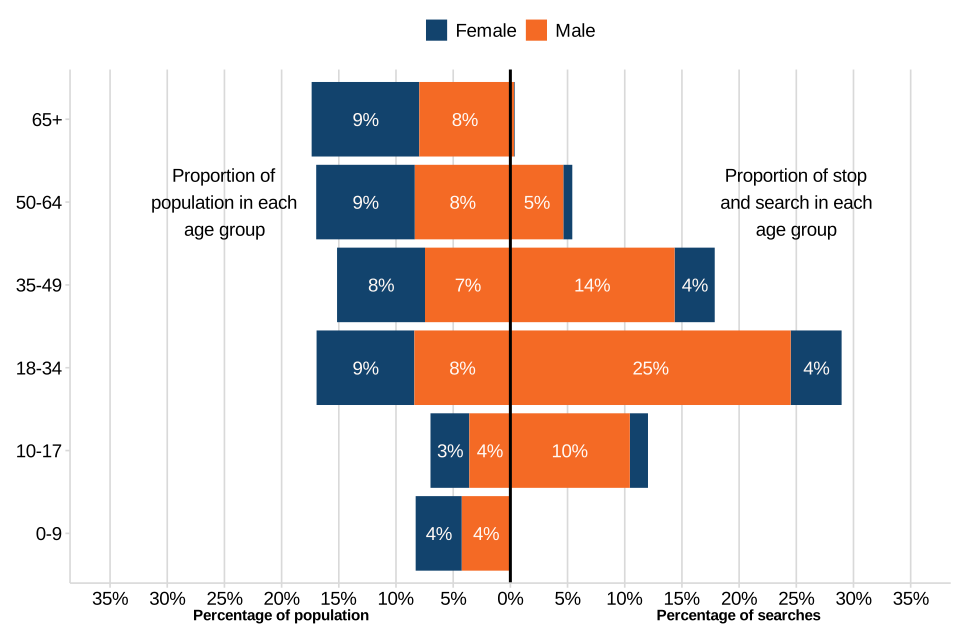
Source: Stop and search summary data tables, year ending 31 March 2026; table SS_33 and table P_2, Home Office
Notes:
- Excludes vehicle only searches, searches where the sex of the person searched was ‘other’ or not known and searches where the age of the person searched was not known.
Figure 2.12: Proportion of stop and search conducted on Black people by age and sex of person compared with the population, year ending March 2026, England and Wales
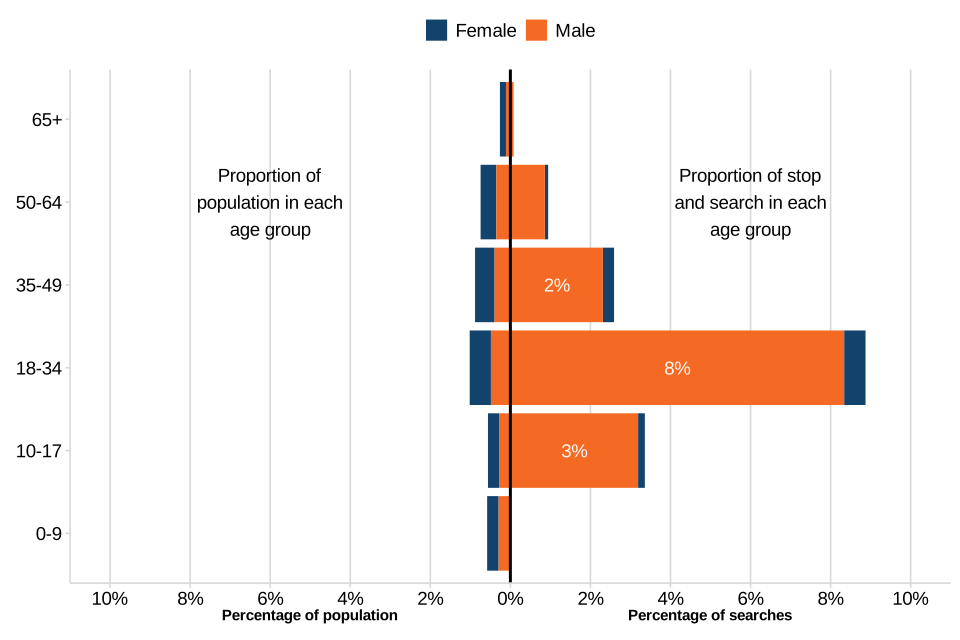
Source: Stop and search summary data tables, year ending 31 March 2026; table SS_34 and table P_2, Home Office
Notes:
- Excludes vehicle only searches, searches where the sex of the person searched was ‘other’ or not known and searches where the age of the person searched was not known.
Figure 2.13: Proportion of stop and search conducted on Asian people, by age and sex of person compared with the population, year ending March 2026, England and Wales
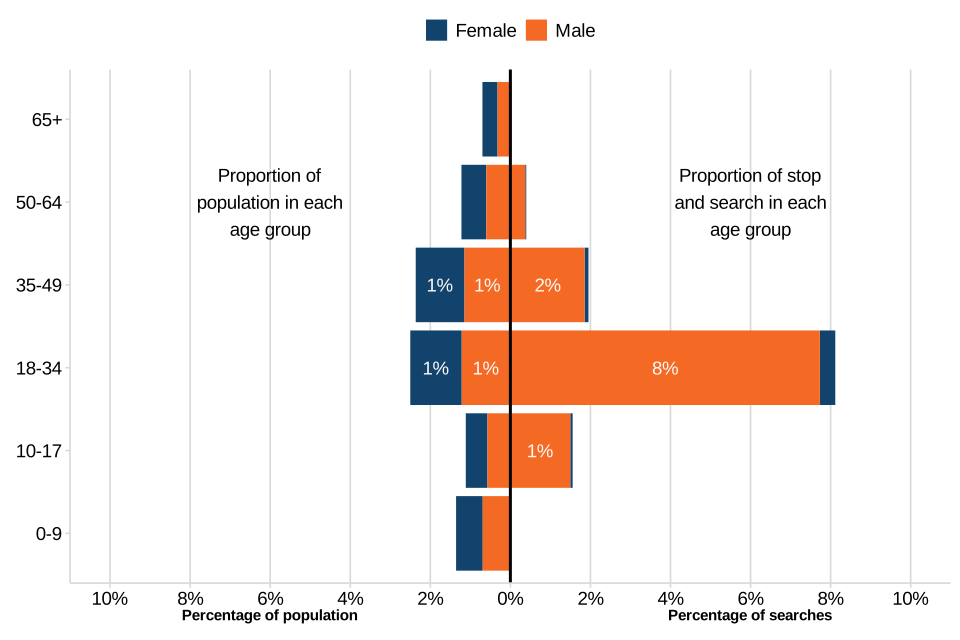
Source: Stop and search summary data tables, year ending 31 March 2026; table SS_35 and table P_2, Home Office
Notes:
- Excludes vehicle only searches, searches where the sex of the person searched was ‘other’ or not known and searches where the age of the person searched was not known.
Figure 2.14: Proportion of stop and search conducted on people from a Mixed or Other ethnic background, by age and sex of person compared with the population, year ending March 2026, England and Wales
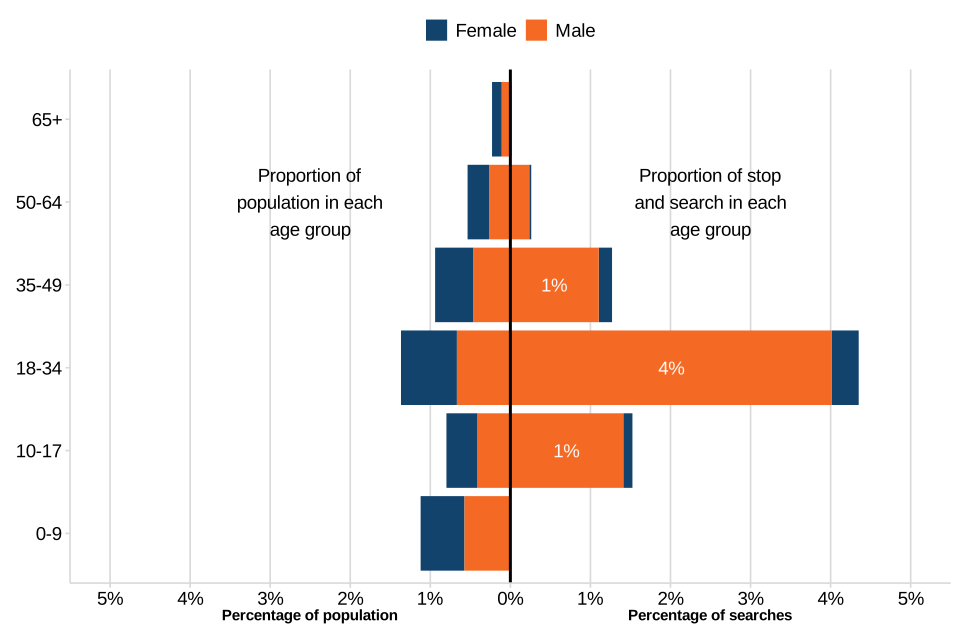
Source: Stop and search summary data tables, year ending 31 March 2026; table SS_36 and table P_2, Home Office
Notes:
- Excludes vehicle only searches, searches where the sex of the person searched was ‘other’ or not known and searches where the age of the person searched was not known.
Males aged 18 to 34 were overrepresented across all ethnic groups, with those who were Black showing the highest disparity, accounting for 8.3% of stop and search in the year ending March 2026 (42,894 stop and searches out of 514,600 where age, sex and ethnicity were provided), despite only making up 0.5% of the population. White males aged 18 to 34 accounted for 24.5% of stop and search but only made up 8.4% of the population. Looking at these as rates per 1,000 population, Black males aged 18 to 34 were stopped at a rate of 148.2 times per 1,000 population, compared with their White counterparts who were stopped at a rate of 25.2 times per 1,000 population.
Resultant arrest rate by age and ethnicity
Looking at how the arrest rate differs across age groups between the different ethnic groups shows that in the 10 to 17 age category Black people and people from the Mixed or Other Ethnic groups have the highest resultant arrest rate (13.4%). For each other age group, people of Mixed or Other ethnicity had the highest arrest rate, with an arrest rate of 15.3 in the 18 to 20 age category, 19.3% in the 21 to 30 age category and 22.6% for people aged 31 and over. Black people had the second highest arrest rate across each of the adult age categories, and Asian people the lowest arrest rates. However, for children aged between 10 and 17, White people had the lowest arrest rate (7.9%)
Figure 2.15: Proportion of stop and searches resulting in arrest by age and ethnicity, year ending March 2026, England and Wales
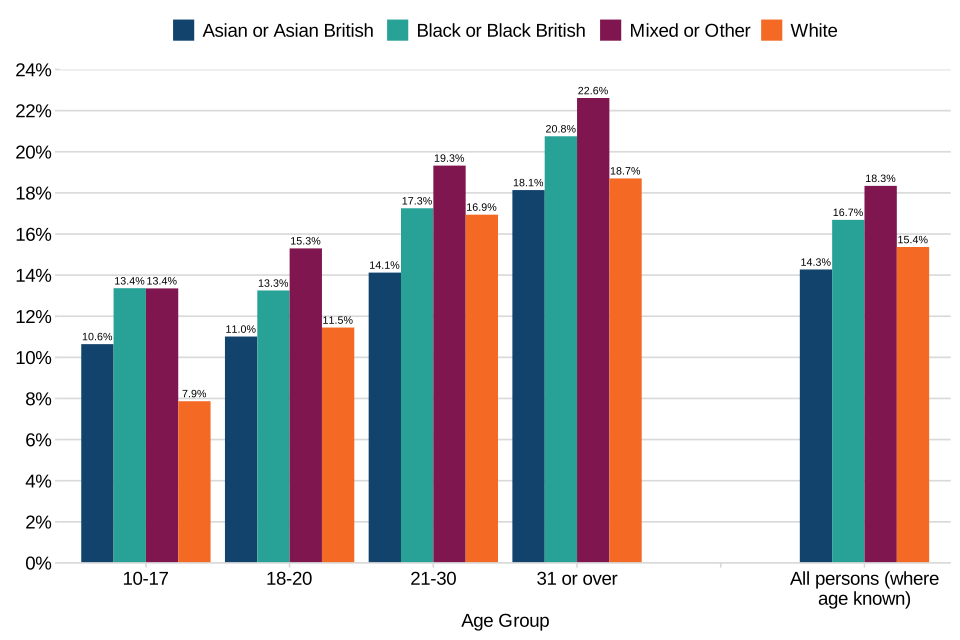
Source: Stop and search summary data tables, year ending 31 March 2026; table SS_37, Home Office
2.7 Stop and search by police force area (PFA)
2.7.1 Headline trends in stop and search by PFA
The MPS continued to account for a large proportion of all stop and searches[footnote 7] conducted in England and Wales (24.6% in the year ending March 2026). This proportion had been reducing in recent years, but has increased slightly from 23.2% in the year ending March 2025. However, the proportion of searches that the MPS accounted for in the year ending March 2026 is below each year between the year ending March 2021 and March 2024, in which the proportion ranged from 44.3% to 25.5%.
When looking at the use of stop and search in different police forces, a traditional approach is to list rates of stop and search per head of resident population, using population figures produced by the Office for National Statistics (ONS). This allows for more meaningful comparisons between areas than only considering the volume of searches in an area. However, calculating the rate based on the resident population has several limitations, such as not including the number of commuters and tourists in areas with a noticeable increase of non-residents. Additionally, looking at the rate across the PFA as a whole masks variation within the area (see Annex A.2 for analysis of stop and search within PFAs). Lastly, looking at the overall population within a PFA ignores that the evidence shows that stop and search is particularly concentrated on young men (see sections 2.6.2 and 2.6.3 – Age and sex of persons stopped and searched).
PFA analysis to compare overall rates per 1,000 population and disparity rates for each ethnic group compared with the White group can be found in section 2.6.1 (Ethnicity of persons searched).
In England and Wales, there were 9.5 stop and searches per 1,000 population in the year ending March 2026. Merseyside Police had the highest rate at 38.8 per 1,000 population[footnote 8], followed by Greater Manchester Police, which had a rate of 23.5 per 1,000 population. The Metropolitan Police Service PFA had a rate of 15.8 per 1,000 population (figure 2.16). The rate of stop and searches per 1,000 people in Merseyside has remained stable in the last 5 years, whereas the rate of stop and searches per 1,000 people in the Metropolitan Police Service PFA has decreased from 35.8 per 1,000 people down to 15.8 per 1,000 people.
Figure 2.16: Stop and searches per 1,000 population, year ending March 2026, England and Wales
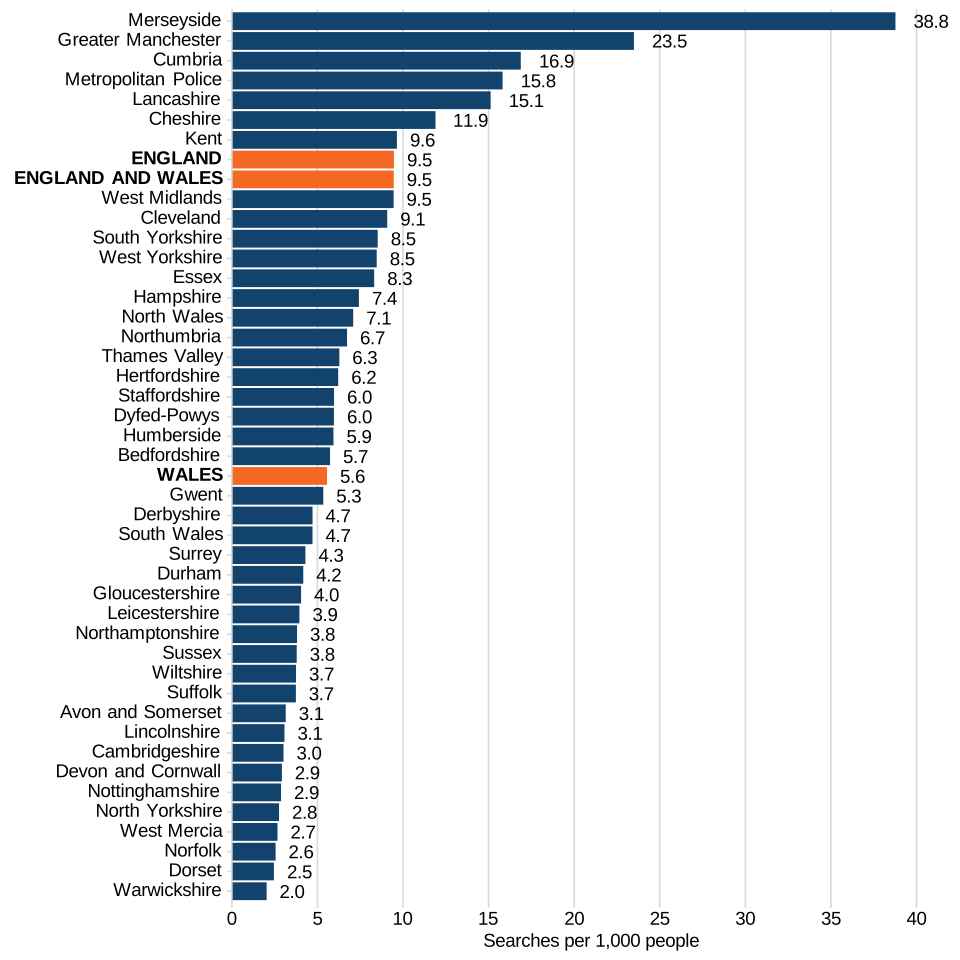
Source: Stop and search summary data tables, year ending 31 March 2026; table SS_20, Home Office
Notes:
- Includes searches under section 1 PACE and associated legislation, section 60 of the Criminal Justice and Public Order Act 1994, section 342E of the Sentencing Act and Section 11 of the Public Order Act.
2.7.2 Resultant arrest rates by police force area
Searches conducted under all relevant legislation resulted in a 15.2% arrest rate in England and Wales for the year ending March 2026 (figure 2.17). Stop and searches by City of London Police resulted in the highest arrest rate (26.6%) followed by Sussex (25.7%).
Figure 2.17: Arrest rate following a stop and search, England and Wales, year ending March 2026
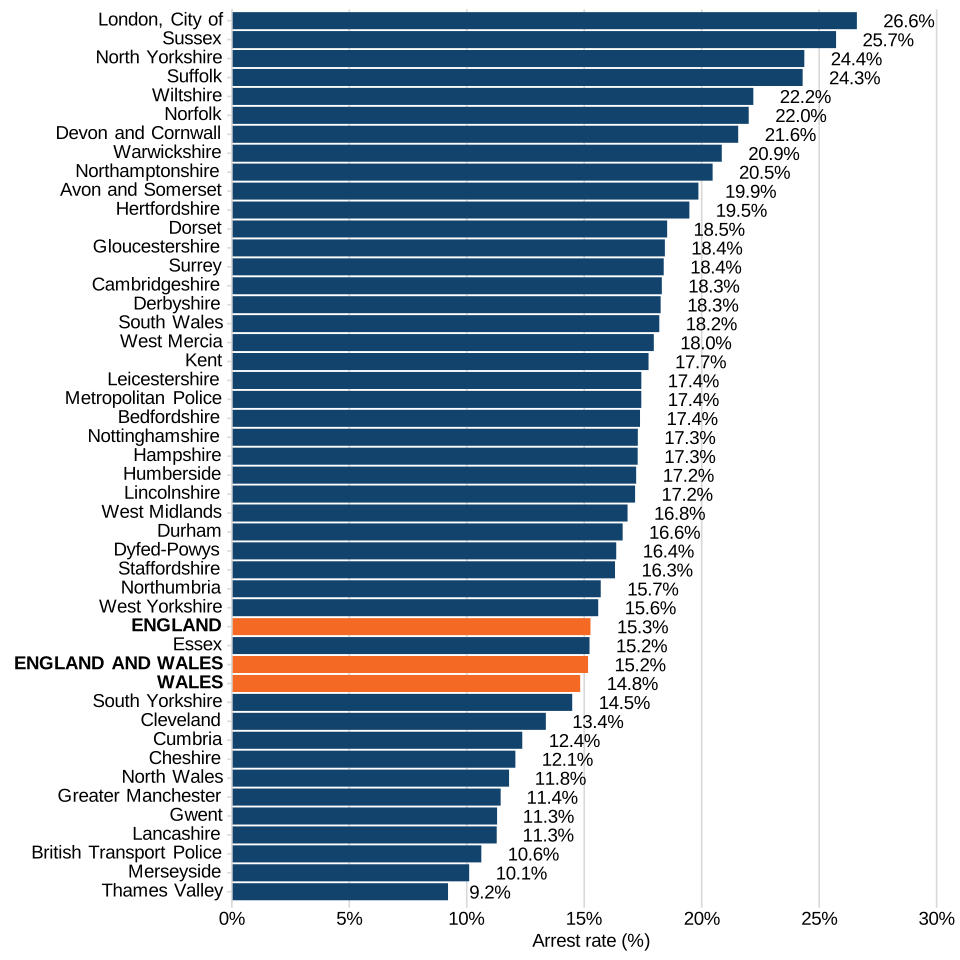
Source: Stop and search summary data tables, year ending 31 March 2026; table SS_20, Home Office
Notes:
- Includes searches under section 1 PACE and associated legislation, section 60 of the Criminal Justice and Public Order Act 1994, section 342E of the Sentencing Act and Section 11 of the Public Order Act.
While an arrest is one possible outcome of a stop and search, there are other outcomes that could show a successful search, including the issuing of police cautions, cannabis or khat warnings, community resolutions and summonses. These are included in the stop and search outcomes section (section 2.5).
2.7.3 All outcomes following a stop and search by police force area
Figure 2.18 shows the outcome rate for each PFA in the year ending March 2026. The figures are broken down by searches that resulted in action being taken as part of the old outcome framework (which included arrest, summons, caution, khat or cannabis warning, penalty notice for disorder or a community resolution), or as part of the new outcome framework (voluntary attendance, verbal warning or words of advice, seizure of property, guardian intervention or other action). Due to inconsistencies in how police forces have applied the new outcome framework, the figures should be interpreted with caution.
Based only on the old outcome framework, Sussex Police had the highest percentage of searches where action was taken (43.2%). Overall (across both frameworks), South Yorkshire Police had the highest proportion of searches where action was taken (56.6%).
Figure 2.18: Outcome rate following a stop and search, year ending March 2026, England and Wales
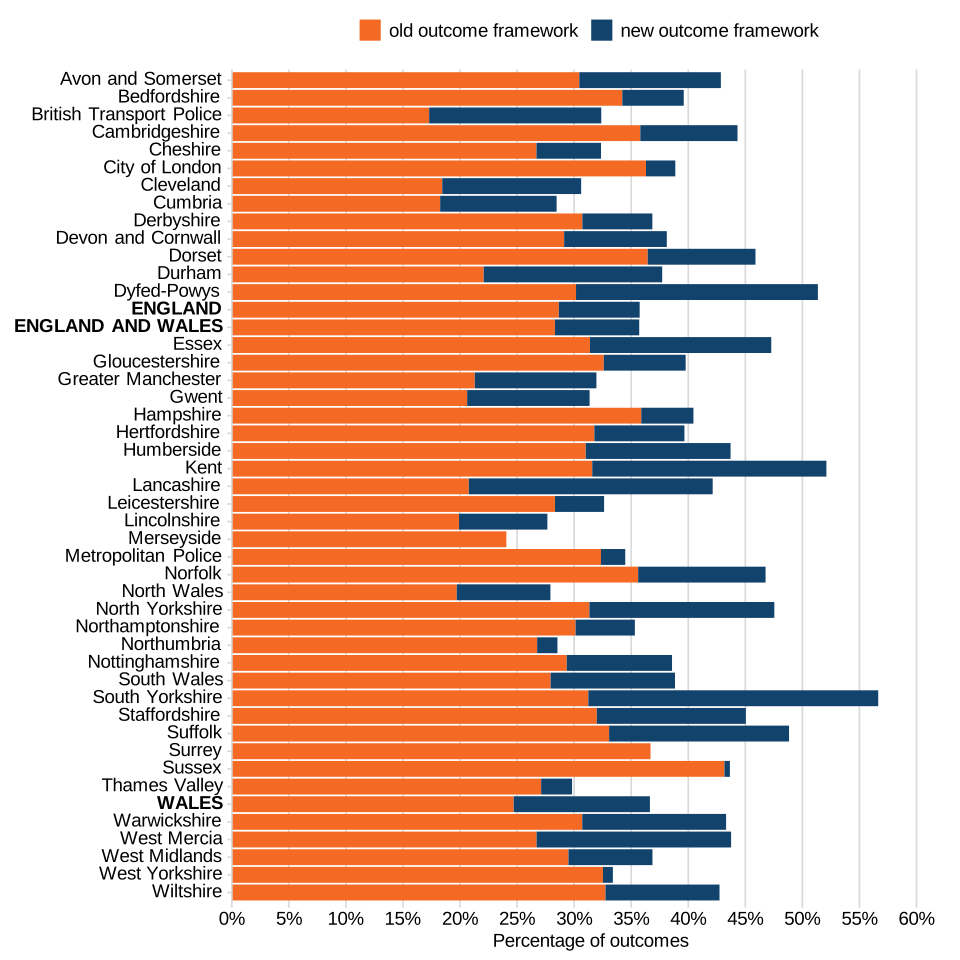
Source: Stop and search outcomes summary data tables, year ending 31 March 2026; table SSO_10, Home Office
2.8 Stop and search hotspots
The Home Office stop and search data collection was expanded in April 2020 to include more detailed information on the locations where stop and search take place (6 digit x and y coordinates), meaning that hotspots (areas of high stop and search activity hotspots within a PFA) can be identified. The location data provided should reflect the exact location of the stop and search, however there may be a small number of records where this is not the case, for example if there are signal issues with mobile devices or the location was only recorded on a paper form instead of a mobile device.
This section contains information on stop and search hotspots conducted by the Metropolitan Police Service (MPS) in London, as well as Greater Manchester Police, Merseyside Police, West Midlands Police, Cumbria Police, North Yorkshire Police, Suffolk Police and Dyfed-Powys Police. These areas have been selected as they provided good quality x and y co-ordinate data and allow comparisons to be made between areas with large urban centres with more rural areas.
The analysis shows that there is a high amount of variation in the number of stop and searches in the individual LSOAs within a PFA, with a large proportion of stop and searches occurring in a relatively small number of LSOAs. This is further illustrated by figures A5 to A12 in Annex A.2.
London, comprising the MPS and City of London PFAs, is comprised of 4,994 LSOAs. When ordering the LSOAs in descending order relating to the number of searches within each LSOA, analysis demonstrates that 25.0% of searches conducted by the MPS in the year ending March 2026 took place in just 113 LSOAs (2.3% of the total number of LSOAs).
Table 2.13 shows the percentage of LSOAs within a PFA that 25%, 50% and 75% of searches take place in. This shows a consistent pattern between areas, where about half of stop and search takes place in the top 5% to 11% of LSOAs.
Table 2.13: Percentage of LSOAs that 25.0%, 50.0% and 75.0% of stop and search occurs in within selected PFAs, year ending March 2026
| Police force area | 25.0% | 50.0% | 75.0% |
|---|---|---|---|
| Metropolitan Police | 2.3% | 10.4% | 29.7% |
| Greater Manchester Police | 1.5% | 8.6% | 26.5% |
| Merseyside | 1.5% | 6.9% | 22.5% |
| West Midlands | 1.3% | 7.7% | 25.2% |
| Cumbria | 2.8% | 9.4% | 27.6% |
| North Yorkshire | 1.8% | 8.2% | 23.2% |
| Suffolk | 1.6% | 5.3% | 18.5% |
| Dyfed-Powys | 3.3% | 10.8% | 27.5% |
Source: Stop and search data collection, Home Office
2.9 Whether force was used in a stop and search – Official Statistics in development
A ‘use of force’ incident is defined as a situation in which a police officer uses any restraint tactics such as handcuffing, equipment such as a baton, or equipment such as TASER®. For a full list of tactics please see the user guide.
During a stop and search, a police officer may deem it necessary to use a force tactic.
Given the partial nature of the data presented in this section, these statistics are ‘Official Statistics in development’ and any conclusions drawn should be done so with caution. In the year ending March 2026, 42 of 44 police forces provided data on whether force was used during a stop and search encounter, accounting for 94.7% (555,258) of the total number of stop and searches in the year ending March 2026 (Gloucestershire and West Midlands Police were not able to supply this data for the year ending March 2026). Figures should be interpreted with caution, as they may reflect differences in recording standards between forces, and ability to link up stop and search records with use of force records, which may be held on different systems.
Where the information was provided, force was used in 31.1% of stop and searches (173,107 of 555,258 searches where the information was available). The Metropolitan Police Service had the highest number searches in which force was used (62,318 out of 144,063). Northamptonshire Police had the highest proportion of searches in which force was used (58.7%), followed by Bedfordshire Police (57.9%).
Data has been published for the first time in this release on the type of force tactic that forces used during the search. This information was received from 25 out of 44 police forces.
Officers may use more than one force tactic during a stop and search, meaning that the percentages in this section total to more than 100%. Where the type of force used was known (110,218 records out of 173,107, or 63.7% of records), 104,766 searches in which force was used involved handcuffing or other restraint (95.1% of searches in which the force was used and the tactic was known), 4,465 used unarmed skills (4.1%), 126 used firearms (0.1%), 613 used less lethal weapons (0.6%), 359 used ‘other equipment’ (0.3%) and for 6,729 records the tactic was recorded as ‘other’[footnote 9] (6.1%).
Where handcuffs were used and it was known whether they were used compliantly or not, 36,950 out of 41,231 were recorded as compliant (89.6%) and 4,281 were recorded as non-compliant (10.4%).
2.10 Whether clothing was removed during the stop and search – Official Statistics in development
Following the case of Child Q, a 15-year-old girl who was strip searched by police at school, since the year ending March 2024, we have requested additional data from police forces across England and Wales on the removal of clothing as part of a stop and search interaction. This is to better reflect the operational picture of the extent to which a More Thorough Search (MTS) or an Exposes Intimate Parts (EIP) search takes place following a standard stop and search interaction.
Given the partial nature of the data presented in this section, these statistics are ‘Official Statistics in development’ and any conclusions drawn should be done so with caution.
Police forces have provided data on the level of clothing removed from an individual during a stop and search, with 4 potential options:
- No clothing removed.
- Removal of outer clothes only (jacket, outer coat, gloves).
- Removal of more than outer clothes.
- Full strip search involving exposure of intimate parts.
Due to their recording systems West Yorkshire, Norfolk and Suffolk were unable to distinguish between searches in which no clothing was removed and searches where only outer clothing was removed. For that reason, this analysis groups those 2 categories together. For the first time, information on the level of clothing removal has also been added to stop and search open data. Separate summaries of the data by police force and by sex, age and ethnicity is also available in the stop and search summary data tables SS_48 and SS_49.
Where the information was provided, 98.4% of searches (546,026) had either no clothing removed or outer clothing only removed, 0.5% of searches (2,665) involved the removal of more than outer clothes without exposing intimate parts and 1.1% of searches (6,375) were a full strip search involving the exposure of intimate parts.
Young adults were more likely have clothing removed during a stop and search than younger teenagers or older adults. People aged 21 to 30 were fully stripped in 1.6% of stop and search encounters (of that age group), compared with 1.3% for adults aged 31 and over and 0.3% for children aged 10 to 17.
The rate of being fully stripped during a stop and search was 1.2% for both males and females, and the proportion of searches where more than outer clothing removed was 0.5% for males and 0.4% for females.
The following analysis is based on a combination of SDE and officer-observed ethnicity if the former was ‘not stated’. Black or Black British people had the highest rate of being fully stripped in a stop and search (1.3% of stop and searches), compared with 1.1% for Asian or Asian British people, 1.2% for people of Mixed or Other ethnicity and 1.1% for White people.
There were some small differences in the rates of clothing removal depending on the reason for search. For example, a slightly higher proportion of searches for drugs resulted in a full strip search (1.8% of drug searches compared with 1.1% across all search reasons). However, searches for stolen property, items related to criminal damage or for going equipped for theft resulted in a lower rate of being people being fully strip searched (0.1% or lower across all 3 search reasons).
There were also some differences in outcome rates depending on the level of clothing removed in a search. For example, for searches in which a person was fully strip searched, the resultant arrest rate was 29.8%, compared with 15.3% for overall searches in which clothing removal information was known.
Additionally, since the year ending March 2025, police forces have provided voluntary data on the location of stop and searches that involved a full strip search, with 4 potential options:
- Police station.
- Educational establishment.
- Home address.
- Other location out of public view.
Thirty-four police forces provided at least partial information in the year ending March 2026, accounting for 5,380 out of 6,375 stop and searches that involved a full strip search (84.4%). Of those 5,380, the location of the strip search was provided for 4,771 stop and searches (88.7%).
Where information was provided, 76.4% of full strip searches took place at a police station (3,643 out of 4,771), 9.7% took place at a person’s home address (461 out of 4,771) and 13.9% took place at another location out of public view (665 out of 4,771). Two full strip searches took place at an educational establishment.
Furthermore, since the year ending March 2025, police forces have provided voluntary data on whether a supervisor was consulted as part of a stop and search that involved a full strip search. Thirty-two police forces provided at least partial information in the year ending March 2026, accounting for 4,196 out of 6,375 stop and searches that involved a full strip search (65.8%). Of those searches, information on whether a supervisor was consulted was provided for 3,776 stop and searches (90.0%).
Where information was provided, a supervisor was consulted as part of a full strip search in 72.0% of instances (2,719 out of 3,776).
Lastly, since the year ending March 2025, police forces have provided voluntary data on whether an appropriate adult was present for the full strip search of a child. Of the 44 forces, 6 did not conduct any full strip searches of children. Of the remaining 38 forces, 31 provided at least partial information on whether an appropriate adult was present for the full strip search of a child. Of those 31 forces, which accounted for 269 full strip searches of children in the year ending March 2026, information on whether an appropriate adult was present was provided for 253 stop and searches (94.1%).
Where the information was known, an appropriate adult was present for 84.6% of stop and searches of children that involved a full strip search (214 out of 253).
2.11 Whether body worn video was used during the stop and search – Official Statistics in development
The statistics presented in this section are designated as ‘Official Statistics in development’ and any conclusions drawn should be done so with caution.
In the year ending March 2026, all police forces provided at least partial data on whether the officer conducting a stop and search used their body worn video. Where the information was provided, 97.5% of stop and searches (570,489) involved the use of a body worn video device.
2.12 Stop and search additional data sources
Quarterly figures for stop and searches conducted in Great Britain under the Terrorism Act 2000 appear in the Home Office series Operation of police powers under the Terrorism Act 2000.
Users should note that there is some minor variation in the figures reported between this statistical release and those in the Operation of Police Powers under the Terrorism Act (TACT) statistical release for the Metropolitan Police Service’s use of section 43 powers. Differences between the 2 sources can in part be explained by the difference in the date of data extraction and updates made to records following each release, with those reported in the TACT release superseding those reported in the police powers and procedures release.
During data quality checks for the year ending March 2023 police powers and procedures publication, analysts from the Home Office and the MPS identified that a small number of searches had been incorrectly recorded under section 47a legislation. As agreed with the MPS, these searches were reclassified as section 43 searches for the police powers and procedures publication. However, following publication, the MPS further reclassified some of these searches under a different search type and these were subsequently revised in the TACT publication.
Analysts from the 2 Home Office teams and analysts from the MPS work together to ensure the 2 releases are better aligned and will revise figures in future releases if necessary. The slight discrepancy in the number of section 43 searches is often due to data extracted from force systems at different times, and has negligible impact on the trends reported in this publication.
MOJ publishes an Ethnicity and the Criminal Justice System series that includes data supplied by the Home Office on stop and search. The latest publication was released in November 2025.
The Metropolitan Police Service publishes a dashboard on the use of stop and search by the force. Other forces may publish similar reports.
The Home Office also publishes annual figures on police use of force incidents in England and Wales.
3.1 Arrests - data quality and introduction
3.1.1 Data quality: Arrests
Missing data
In the year ending March 2026, Derbyshire Constabulary were not able to provide data due to data quality issues. They have also withdrawn their data for the year ending March 2025 due to similar concerns, and are working towards being able to provide accurate data in the next publication.
In this commentary, Derbyshire has been excluded from time series comparisons.
Revisions
The figures presented are correct at the time of publication and include revisions submitted by forces for the previous years.
For this publication, 3 forces revised their data for the year ending March 2025 (table 3.1):
- Dorset Police identified an error in the ethnicity classifications of their year ending March 2025 submission; they have revised their data, resulting in an increase of 10 arrests
- Leicestershire Police identified an error in the methodology used; they have revised their data resulting in a decrease of 36 arrests
- Thames Valley Police identified they had been overcounting arrests in previous returns; they revised their data for the year ending March 2025, resulting in a decrease of 15,399 arrests (from 41,807 to 26,408 – 36.8%)
Excluding Derbyshire, this resulted in an overall decrease of 15,425 arrests (2.1%) to the year ending March 2025 data, from 739,700 to 724,275.
Table 3.1: Revisions to arrests data, year ending March 2025
| Police Force | Old figure | New figure | Change (number) | Change (percentage) |
|---|---|---|---|---|
| Dorset | 5,460 | 5,470 | +10 | 0.2% |
| Leicestershire | 12,791 | 12,755 | -36 | -0.3% |
| Thames Valley | 41,807 | 26,408 | -15,399 | -36.8% |
| All forces (excluding Derbyshire) | 739,700 | 724,275 | -15,425 | +2.1% |
Source: Arrests open data, Home Office
Methodology
Where a person has been arrested for one or more notifiable offence on the same occasion, forces are asked to record the arrest against the offence with the highest maximum penalty (the primary arrest). Some police forces use alternative methods to select the primary arrest, for example the offence flagged as the “main” offence on the arrest record, or the offence with the highest Crime Harm Index.
In this collection, an arrest is counted for each occasion a person is arrested, provided that the arrest is for an offence which is not related to an offence for which the person has already been subject to arrest during the same year. However, some forces are not able to link separate arrests for connected offences if a new arrest record was created for the second arrest. Therefore, there may be some instances in the dataset where arrests for connected offences may be counted more than once.
The Home Office does not collect data on outcome following arrest.
3.1.2 Introduction to arrests
This section includes data on the police power of arrest. In line with police recorded crime statistics, the arrest collection covers only arrests for notifiable offences[footnote 10] carried out by police in England and Wales. Further, in this collection, an arrest is counted for each separate occasion a person is arrested, provided that the offences are not linked. If the arrest is connected, or if a person has been arrested for one or more notifiable offences at the same time, only one arrest is counted and the offence with the highest maximum penalty should be recorded. Therefore, it does not provide a measure of all arrests made by the police.
The Home Office requests data from the 43 territorial police forces in England and Wales on arrests made during the financial year. The Home Office does not receive data on arrests from the British Transport Police (BTP).
Figures on arrests reported to the Home Office reflect police activity and do not indicate total levels of crime committed by offenders. For example, the number of arrests for drug offences is greatly dependent on police activities and priorities and does not give a reliable indication of trends in the level of drug offending. Data on crime in England and Wales is available here: Crime and justice - Office for National Statistics. Additionally, not all suspects of crime are arrested and, instead, may be invited to voluntarily attend an interview. Latest data on voluntary attendance covers the period to March 2025, and is available here: Police custody and pre-charge bail, year ending March 2025. Data on voluntary attendance for the year ending March 2026 is scheduled for publication in early 2027.
In this chapter, figures are presented to one decimal place.
Further detail on data quality and interpreting figures can be found in section 3.1.1.
3.2 Main results - Arrests
In the year ending 31 March 2026, 739,703 arrests were made in England and Wales. Excluding Derbyshire who were unable to provide data, this was an increase of 2.1% from the 724,275 arrests in the year ending 31 March 2025, and the highest number of arrests since the year ending 31 March 2017. Of those arrested, 83.6% (617,175) were male.
As with previous years, Violence against the person offences accounted for almost half of all arrests (45.7%). Compared to the year ending March 2025, small increases ranging from 1% to 6% were seen in most offence groups, except from public order and criminal damage and arson where there were small decreases, and miscellaneous crimes against society where there was a larger increase of 15.0%.
Whilst the number of arrests of people aged 21 and over has increased by 3.0% in the year ending March 2026, the arrests of people aged 10 to 17 decreased by 5.2%, and arrests of those aged 18 to 20 remained stable (a change of 0.1%). This is in line with the longer-term shift towards an older age profile of people arrested.
Of the 42 forces in England and Wales which provided data, 19 carried out more arrests in the year ending March 2026 than the year ending 31 March 2025, while 23 forces carried out fewer. As with previous years, the Metropolitan Police had the greatest number of arrests (108,993 or 14.7% of total arrests).
3.3 Trends in the number of arrests
In the year ending March 2026 there were 739,703 arrests carried out by territorial police forces in England and Wales. Excluding Derbyshire, this was an increase of 2.1% from the 724,275 arrests in the year ending March 2025, and is the highest number of arrests since the year ending March 2017.
In the decade between the years ending March 2008 and March 2018 the number of arrests halved (from 1,452,308 to 682,915). Following this period, the number of arrests declined at a slower rate until reaching its lowest number in the year of the COVID-19 pandemic ending March 2021. Arrests have then been increasing every year since, and are now 16.3% higher than when they were at their lowest 5 years ago (figure 3.1).
In the year ending March 2026, 83.6% of people arrested were male. The proportion of people arrested who were male has remained relatively stable between 83% and 85% of arrests.
Figure 3.1: Number of arrests, by sex, year ending March 2007 to year ending March 2026, England and Wales excluding Derbyshire Constabulary
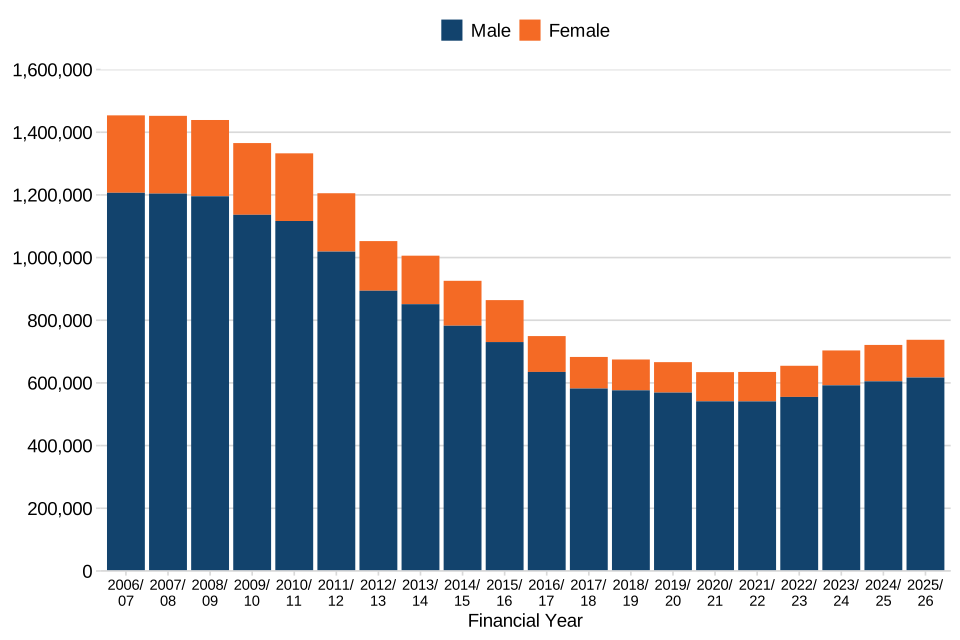
Source: Arrests summary data tables, year ending 31 March 2026; table A.01, Home Office
Notes:
- Excludes Derbyshire Constabulary, who were unable to provide data in the year ending March 2026.
- In the years ending March 2021 onwards ‘other’ and ‘unknown’ sex were also collected, however these make up just 2,055 arrests (0.3% of total arrests) in the year ending March 2026.
Trends in police recorded crime data may be impacted by levels of reporting to the police and changes in police recording practices. We have therefore not drawn comparisons between longer-term crime and arrests trends in this bulletin.
3.4 Arrests by offence group
Offence data is collected in 10 broader categories:
- criminal damage and arson
- drug offences
- fraud offences
- miscellaneous crimes against society
- possession of weapons offences
- public order offences
- robbery
- sexual offences
- theft offences
- violence against the person
A breakdown of the offences included in each category are listed within the Home Office counting rules notifiable offences list.
In the year ending March 2026, Northumbria Police were not able to identify the offence group of 271 arrests, due to a transition to a new data management system. They are working on resolving this issue for future publications.
Almost half of all arrests made by police in England and Wales were connected with violence against the person offences (45.7%). The next most common offence group was theft, which was 14.9% of all arrests (figure 3.2). The proportion of arrests in each offence group has changed compared to the year ending March 2016 (when the offence groupings changed). The proportion of all arrests for violence against the person offences has risen from 34.7% 10 years ago, however this has become more stable in the last 5 years, at around 46%. Conversely, the proportion of arrests accounted for by theft offences decreased from 22.0% of all arrests in the year ending March 2016 to 12.4% in the year ending March 2022, although this has been rising again in the last few years as the number of arrests for theft offences has increased.
Figure 3.2: Proportion of arrests in each offence group, year ending March 2026, England and Wales excluding Derbyshire Constabulary
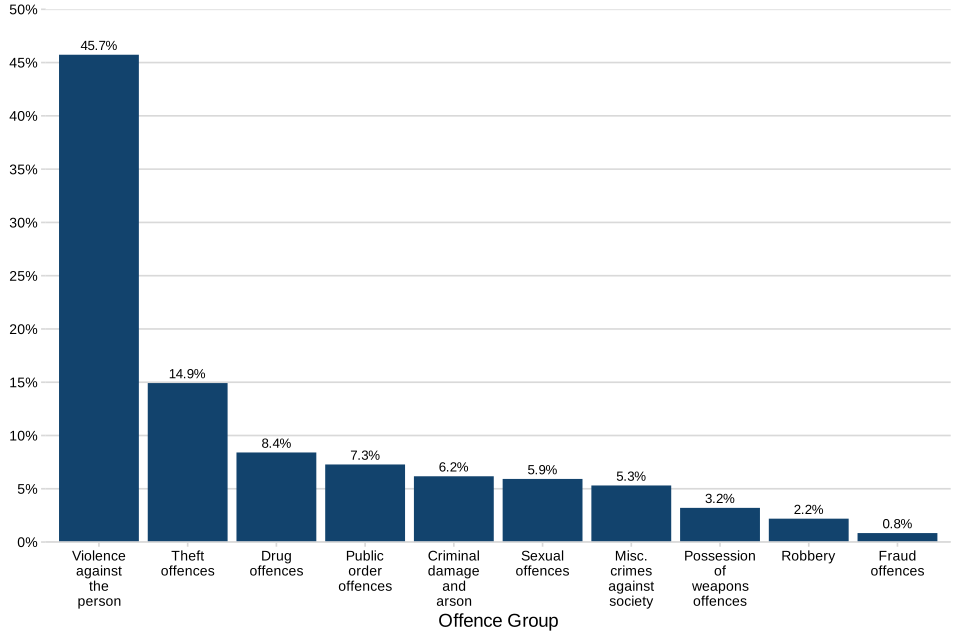
Source: Arrests summary data tables, year ending 31 March 2026; table A.02, Home Office
Notes:
- Excludes Derbyshire Constabulary, who were unable to provide data in the year ending March 2026.
- Does not include 271 arrests where the offence group was unknown.
A comparison of the arrests series to the recorded crime series (excluding fraud from both series) shows a difference in the distribution of offence groupings (figure 3.3 below). The greatest difference was for theft, which accounted for 15.0% of arrests and 31.3% of police recorded crime.
Direct comparisons between the 2 series should be made with caution since arrests relate to persons (suspects) and recorded crime relates to offences. For example, one offence may be committed by multiple offenders and therefore may generate several arrests.
Conversely an offender may be arrested for committing 2 or more recorded crimes (such as shoplifting and possession of drugs) but only one arrest will be recorded. In addition, some crimes take longer to investigate than others and therefore some arrests reported in this year’s collection may relate to crimes recorded in a previous year.
Figure 3.3: Offence group breakdowns of persons arrested and police recorded crime, year ending March 2026, England and Wales
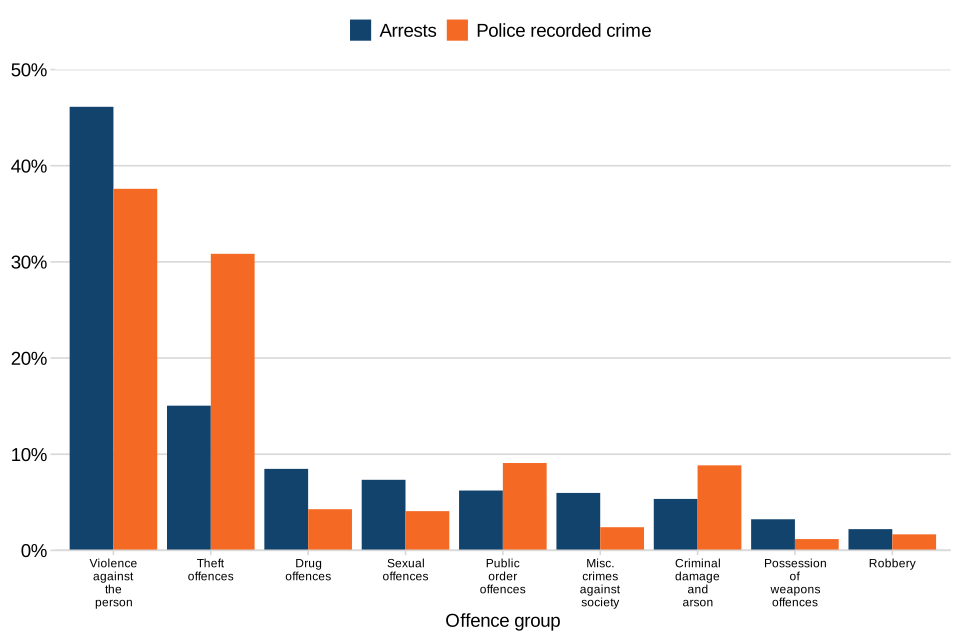
Source: Arrests summary data tables, year ending 31 March 2026; table A.02, Home Office and ONS Crime Statistics
Notes:
- Arrests data excludes Derbyshire Constabulary, who were unable to provide data in the year ending March 2026.
- Excludes Fraud offences.
In the year ending March 2026, small increases ranging from 1%-6% were seen in most offence groups, except from public order and criminal damage and arson where there were small decreases, and miscellaneous crimes against society where there was a larger increase of 15.0% (table 3.2).
The largest increase in arrests both in terms of volume increase and percentage increase was for miscellaneous crimes. Arrests for this offence group increased by 5,697 arrests, from 38,102 to 43,799. Over half of the increase was due to an increase of 26.0% (3,091 arrests) for arrests for miscellaneous crimes by the Metropolitan Police.
Table 3.2: Offence group breakdowns of persons arrested in England and Wales excluding Derbyshire Constabulary, year ending March 2025 compared with year ending March 2026
| Offence group | Year ending 31 March 2025 | Year ending 31 March 2026 | Change (number) | Change (%) |
|---|---|---|---|---|
| Violence against the person | 334,566 | 338,211 | 3,645 | 1.1% |
| Theft offences | 108,809 | 110,342 | 1,533 | 1.4% |
| Drug offences | 59,304 | 62,157 | 2,853 | 4.8% |
| Sexual offences | 50,648 | 53,841 | 3,193 | 6.3% |
| Public order offences | 46,595 | 45,639 | -956 | -2.1% |
| Miscellaneous crimes against society | 38,102 | 43,799 | 5,697 | 15.0% |
| Criminal damage and arson | 41,876 | 39,252 | -2,624 | -6.3% |
| Possession of weapons offences | 23,046 | 23,733 | 687 | 3.0% |
| Robbery | 15,410 | 16,219 | 809 | 5.2% |
| Fraud offences | 5,919 | 6,239 | 320 | 5.4% |
| Unknown | [z] | 271 | [z] | [z] |
| Total | 724,275 | 739,703 | 15,428 | 2.1% |
Source: Arrests summary data tables, year ending 31 March 2026; table A.02, Home Office
Notes:
- In the year ending March 2026, Derbyshire Constabulary were unable to provide data, therefore they have been excluded from both years.
- In the year ending March 2026, Northumbria Police were not able to identify the offence group of 271 arrests, due to a transition to a new data management system. The offence group for these offences have therefore been reported as Unknown. [z] = not applicable.
The changes by offence group in the year ending March 2026 have followed trends seen in previous years.
Arrests for sexual offences have continued to increase, up 6.3% in the latest year, and up by over three-quarters (78.4%) since the year ending March 2021. This increase may reflect a number of factors, including the effect of high-profile incidents, media coverage, and campaigns on people’s willingness to report incidents to the police.
Arrests for theft and miscellaneous crimes have increased over the last 4 years (by 39.5% and 42.6% respectively). Arrests for fraud have also increased by 25.6% in the past 3 years. Previously arrests for theft, miscellaneous crimes, and fraud offences had been decreasing. Violence against the person has been consistently increasing since the year ending March 2018. Arrests for possession of weapons have also been generally increasing in this time.
Other offences such as robbery have remained more stable in the long-term, whereas arrests for drugs offence have had variable changes.
Criminal damage and arson and public order offences are the only 2 offence groups which have consistently declined over the past 4 years.
However, the changes in overall number of arrests in the last decade were mainly driven by changes in the 2 largest offence groups, violence against the person and theft. Between the years ending March 2018 and 2021, the number of annual arrests fell by 46,798 primarily accounted for by a fall in theft offences, of 50,471. Since April 2021, overall arrests have increased again (by 103,586 arrests in 5 years), driven by an increase of 66,988 arrests (24.7%) increase for violence against the person offences.
Figure 3.4: Number of arrests, by offence group, year ending March 2016 to year ending March 2026, England and Wales excluding Derbyshire Constabulary
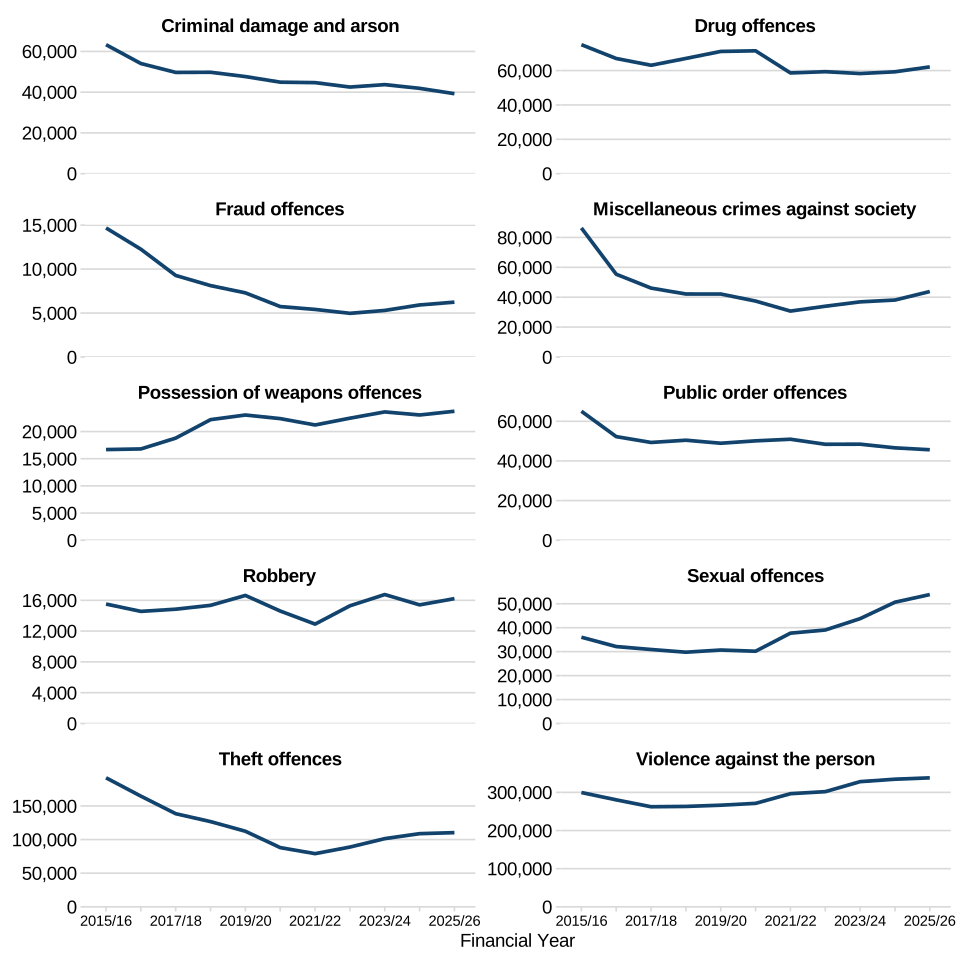
Source: Arrests open data tables, year ending 31 March 2026, Home Office
Notes:
- Different scales have been used for charts, so comparisons should be made with caution.
- Excludes Derbyshire Constabulary, who were unable to provide data in the year ending March 2026.
3.5 Arrests by sex
The data collection has been set up with 4 options for the sex of the person searched: female, male, other and unknown. It is likely that recording includes a mixture of sex and gender, and ‘other’ may comprise people who define themselves as non-binary or transgender. However, only 15 of the 42 police forces recorded any arrests of people defined as ‘other’. This suggests that different recording systems used by police forces have different levels of detail to which the sex of the person arrested can be recorded. This bulletin reports on data in the format it is collected from the police, and Home Office continues to work with stakeholders to bring this data in line with Government Statistical Service sex and gender harmonisation standards.
The majority of arrests in the year ending March 2025 were of males (83.6% of arrests where sex of the person arrested was known, or 617,175 out of 737,833 arrests). Between the year ending March 2008 and the year ending March 2020, the proportion of people arrested who were male increased from 82.9% to 85.4%, but it has decreased in each year since then.
In the year ending March 2026, the number of arrests of males increased by 2.0%, and the number of arrests of females increased by 3.7% (table 3.3). In recent years females have had greater increases than males. Arrests for females have increased by 29.2% in 5 years compared to arrests for males which are up 14.0% in the same period.
Notable differences in longer-term increases between males and females have been seen for sexual offences and weapons offences.
Arrests for sexual offences have increased by 78.4% in males compared to the year ending March 2019, compared to 165.8% in females (from 620 to 1,648). However, females only account for a very small proportion of arrests for sexual offences (3.1%).
For possession of weapons offences, males have seen a 2.7% increase since the year ending March 2021, compared to a 43.2% increase for females (from 1,795 to 2,570).
Table 3.3: Percentage change in number of arrests between year ending March 2025 and year ending March 2026, by offence group and sex, England and Wales excluding Derbyshire Constabulary
| Reason for arrest | Numbers - females | % change - females | Numbers - males % change - males | |
|---|---|---|---|---|
| Violence against the person | 65,921 | 2.9% | 271,358 | 0.8% |
| Theft offences | 20,014 | 5.6% | 90,114 | 0.7% |
| Drug offences | 7,725 | 5.1% | 54,268 | 5.0% |
| Sexual offences | 1,648 | 13.3% | 52,008 | 6.3% |
| Public order offences | 6,762 | -1.1% | 38,724 | -2.2% |
| Criminal damage and arson | 6,978 | -4.1% | 32,161 | -6.6% |
| Miscellaneous crimes against society | 5,427 | 12.0% | 38,236 | 15.7% |
| Possession of weapons offences | 2,570 | 6.9% | 21,081 | 2.6% |
| Robbery | 1,899 | 21.0% | 14,277 | 3.7% |
| Fraud offences | 1,474 | -1.1% | 4,732 | 7.7% |
| Unknown | 55 | [z] | 216 | [z] |
| All offences | 120,473 | 3.7% | 617,175 | 2.0% |
Source: Arrests summary data tables, year ending 31 March 2026; table A.02, Home Office
Notes:
- Excludes Derbyshire Constabulary, who were unable to provide data in the year ending March 2026.
- [z] = Not applicable.
Both males and females were most commonly arrested for violence against the person offences, accounting for 44.0% of all male arrests and 54.7% of all female arrests. This was followed by arrests for theft offences (14.6% for males and 16.6% for females).
However, there were some differences in arrest patterns for males and females. For example, though making up 16.3% of overall arrests (120,473 arrests out of 737,833 where sex was known), females have consistently made up a very small proportion of those arrested for sexual offences (3.1% in the year ending March 2026) but a larger proportion of those arrested for fraud offences (23.7% in the year ending March 2026). Figure 3.5 shows the split by sex for each offence type.
Figure 3.5: Proportion of arrests by sex and offence group, year ending March 2026, England and Wales excluding Derbyshire Constabulary
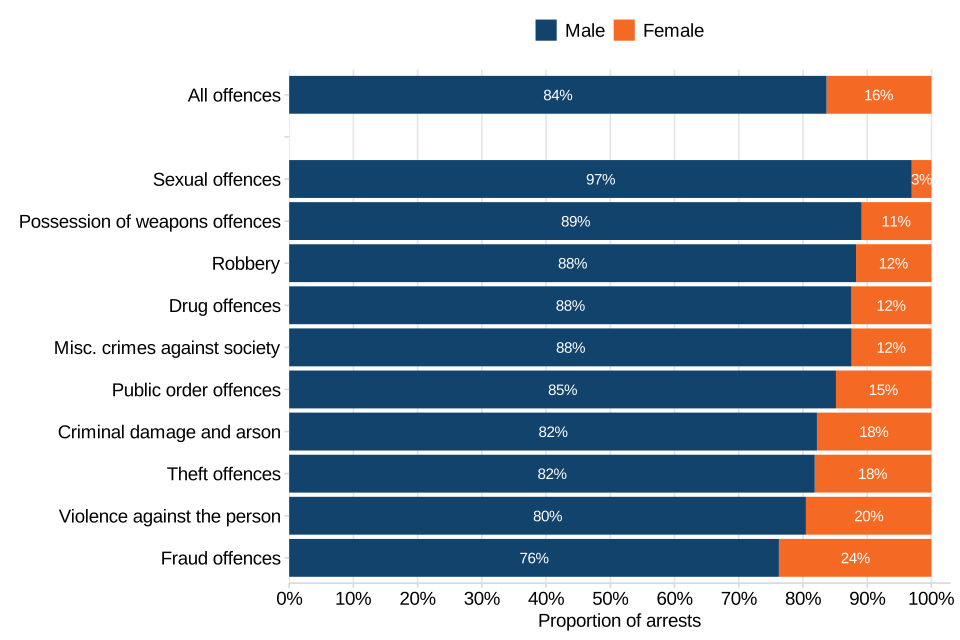
Source: Arrests summary data tables, year ending 31 March 2026; table A.02, Home Office
Notes:
- Excludes Derbyshire Constabulary, who were unable to provide data in the year ending March 2026.
- Excludes arrests of people identified as ‘other’ (185 arrests) and those whose sex was recorded as unknown (1,870 arrests). The analysis presented preceding the chart does include people who identified as ‘other’.
- Excludes 271 arrests where the Home Office offence group was unknown.
The proportion of people arrested who were male (83.6%) was slightly lower than both the proportion of stop and searches that were of males (87.4%) and the proportion of stop and searches resulting in arrest that were male (90.1%).
3.6 Arrests by age
Data on arrests by age are collected using the following 5 categories:
- aged 9 and under
- aged 10 to 17
- aged 18 to 20
- aged 21 and above
- age unknown
The legal minimum age for prosecution in England and Wales is 10 years old; the ‘age 9 and under’ category includes persons who, after further investigation, were found to be too young to be charged with an offence.
The analysis in this section excludes those whose age was unknown or those aged under 9.
The majority (85.9%) of all arrestees in the year ending March 2026 were aged 21 and above. In comparison, 76% of the general population are aged 21 and above[footnote 11]. Analysis of the reasons for arrest showed some variation by age-group; for example, although 14.1% of all arrests were of persons aged 20 and under, they made up two-fifths (39.4%) of arrests for robbery offences and 27.0% of arrests for possession of weapons offences. The majority of fraud offences (91.1%) were of people aged 21 and above. Figure 3.6 shows the number of persons arrested by offence type and age-group.
Figure 3.6: Age-group of persons arrested, by offence type, year ending March 2026, England and Wales excluding Derbyshire Constabulary
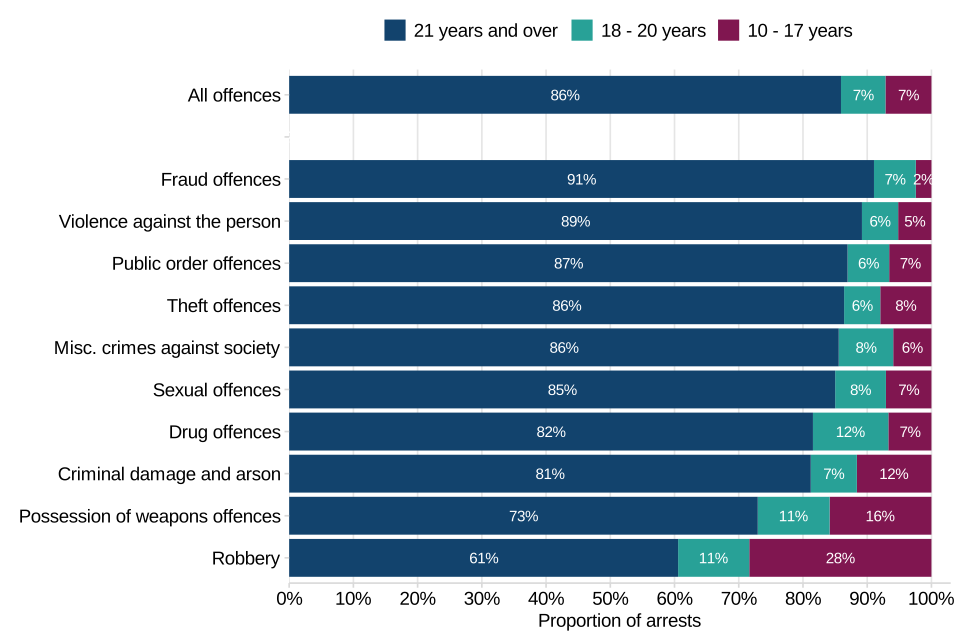
Source: Arrests summary data tables, year ending 31 March 2026; table A.03, Home Office
Notes:
- Excludes Derbyshire Constabulary, who were unable to provide data in the year ending March 2026.
- Excludes those whose age was unknown (0.02% or 124 arrests).
- Excludes arrests where the Home Office offence group was unknown (271 arrests).
Whilst the number of arrests of people aged 21 and over has increased by 3.0% in the year ending March 2026, the arrests of people aged 10 to 17 decreased by 5.2%, and 18 to 20 remained stable (an increase of 0.1%).
These changes are in line with the long-term trend since 2007 that has seen a shift towards an older age profile. As figure 3.7 shows, arrests across all 3 age-groups showed decreases between 2007 and 2020, but these reductions were larger for those aged 20 and under, compared with those aged 21 and over. In the latest few years, the number of arrests of people under the age of 21 have stabilised or show smaller decreases, whereas arrests for people 21 and over are at their highest level since the year ending March 2016. In the year ending March 2026, the 21 and over group now comprises 85.9% of all arrests, compared with 60.8% in the year ending March 2007.
Figure 3.7: Number of arrests (indexed to 100 in the year ending March 2007) by age group, years ending March 2007 to year ending March 2026, England and Wales excluding Derbyshire Constabulary
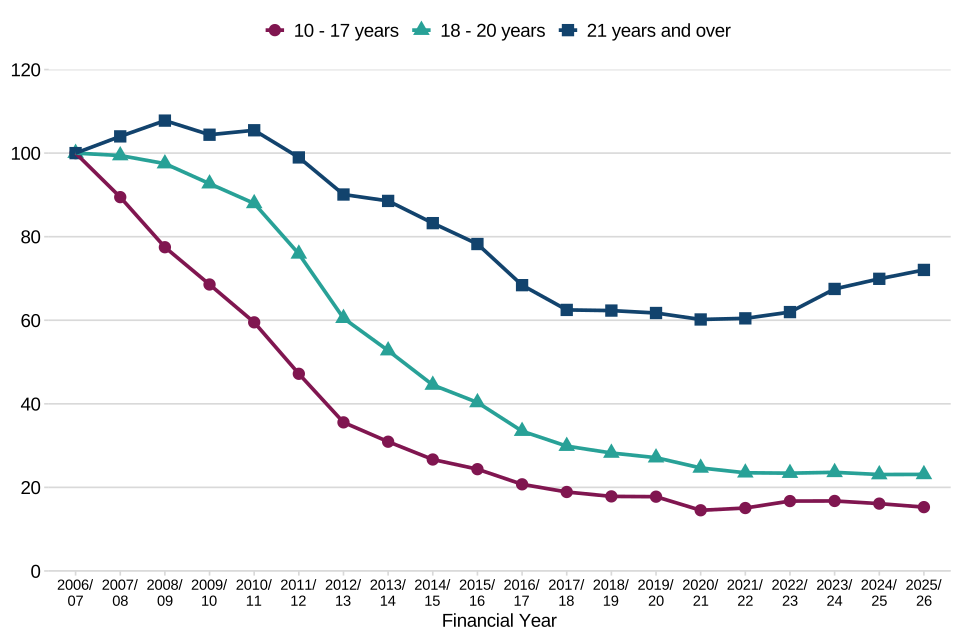
Source: Arrests summary data tables, year ending 31 March 2026; table A.01b, Home Office
Notes:
- Index numbers are calculated by dividing the number of arrests in each financial year by the number of arrests in the year ending March 2007 (the base year) multiplied by 100. This shows the relative change in the number of arrests over time compared to the year ending March 2007.
- Excludes Derbyshire Constabulary, who were unable to provide data in the year ending March 2026.
Over the past year, people aged 21 and over have had a larger proportional increase or smaller decrease than those aged under 21 in every offence group except fraud and miscellaneous crimes against society. Much of the overall volume decrease in arrests of children aged 10 to 17 was due to an 11.3% decrease in arrests for theft offences.
The biggest differences in changes between the over and under 21 groups were for robbery (16.8% increase for people aged 21 and over versus an 8.4% decrease in people aged 20 and under) and theft (3.8% increase versus 11.3% decrease).
Table 3.4: Number of arrests by age group and offence group, England and Wales excluding Derbyshire Constabulary, year ending March 2026
| Reason for arrest | Aged 21 and over – number of arrests in 2025 to 2026 | Aged 21 and over – volume change compared to 2024 to 2025 | Aged 21 and over – percentage change compared to 2024 to 2025 | Aged 20 and under – number of arrests in 2025 to 2026 | Aged 20 and under – volume change compared to 2024 to 2025 | Aged 20 and under – percentage change compared to 2024 to 2025 |
|---|---|---|---|---|---|---|
| Violence against the person | 301,577 | 3,972 | 1.3% | 36,583 | -139 | -0.4% |
| Theft offences | 95,325 | 3,504 | 3.8% | 14,998 | -1,907 | -11.3% |
| Drug offences | 50,687 | 3,123 | 6.6% | 11,466 | -200 | -1.7% |
| Public order offences | 39,671 | -344 | -0.9% | 5,955 | -576 | -8.8% |
| Criminal damage and arson | 31,872 | -1,818 | -5.4% | 7,373 | -767 | -9.4% |
| Sexual offences | 45,766 | 2,787 | 6.5% | 8,068 | 427 | 5.6% |
| Miscellaneous crimes against society | 37,464 | 4,693 | 14.3% | 6,318 | 1,036 | 19.6% |
| Possession of weapons offences | 17,315 | 930 | 5.7% | 6,417 | -221 | -3.3% |
| Robbery | 9,820 | 1,416 | 16.8% | 6,395 | -583 | -8.4% |
| Fraud | 5,680 | 235 | 4.3% | 558 | 89 | 19.0% |
| Total | 635,435 | 18,756 | 3.0% | 104,144 | -2,828 | -2.6% |
Source: Arrests open data tables, year ending 31 March 2026, Home Office
Notes:
- Excludes Derbyshire Constabulary, who were unable to provide data in the year ending March 2026.
- Breakdown not included for where the reason for arrests was unknown (271 arrests in the year ending March 2026).
3.7 Arrests by ethnicity
When an individual is arrested, they are asked to define their ethnicity (using the 2021 Census 19+1 categories). For the purpose of this analysis, these are grouped into the following Census 5+1 categories:
- White
- Black (or Black British)
- Asian (or Asian British) - including Chinese from the year ending March 2020 onwards
- Mixed
- Other ethnic group - included Chinese for the years before March 2020
- Not stated
Data by 19+1 ethnic group is available in the Arrests open data tables, year ending 31 March 2026.
In November 2022, the Metropolitan Police Service (MPS) changed to a new data management system, which impacted the recording of self-defined ethnicity (SDE). In the year ending March 2026, the MPS reported SDE as unknown for 33.8% of records. This is an improvement from the year ending March 2025 when 61.4% of the MPS’s SDE data was unknown.
In comparison, 7.2% of records from the rest of England and Wales were missing SDE data in the year ending March 2026. Since the Metropolitan Police account for the largest proportion of arrests (14.7%) in England and Wales, they have a large weighting on the overall proportion of missing ethnicity data, which is 11.1%. The Home Office is working with the Metropolitan Police and the other territorial police forces to improve their recording of SDE data. Excluding the Metropolitan and Derbyshire police forces, recording of SDE has seen recent improvement and the proportion of records where this information is missing has fallen from 17.3% in the year ending March 2021 to 7.2% in the year ending March 2026.
In the year ending March 2026, where SDE was known, 76.8% defined their ethnicity as White, 8.3% as Black and 8.9% as Asian. The remaining considered themselves either of mixed ethnicity (3.8%) or any other ethnic group (2.2%) (table 3.5). The proportion of people of arrested who self-defined as White was a little lower than last year (79.1%). This may be in part due to improvements in the completion of self-defined ethnicity data by the MPS. Excluding the Metropolitan Police, changes in the breakdown of SDE between years was smaller (81.1% of arrests were of White people in the year ending March 2026, compared to 81.8% in the previous year).
Table 3.5: SDE of persons arrested, year ending March 2025 and year ending March 2026, England and Wales excluding Derbyshire Constabulary
| SDE | Year ending March 2025 - Number of arrests | Year ending March 2025 - % excluding unknowns | Year ending March 2026 - Number of arrests | Year ending March 2026- % excluding unknowns |
|---|---|---|---|---|
| Asian (or Asian British) | 49,369 | 8.1% | 58,611 | 8.9% |
| Black (or Black British) | 44,440 | 7.3% | 54,779 | 8.3% |
| Mixed | 21,419 | 3.5% | 25,061 | 3.8% |
| White | 481,251 | 79.1% | 504,682 | 76.8% |
| Other ethnic group | 11,983 | 2.0% | 14,249 | 2.2% |
| Unknown | 115,813 | [z] | 82,321 | [z] |
| Total | 724,275 | 100% | 739,703 | 100% |
Source: Arrests summary data tables, year ending 31 March 2026; table A.01c, Home Office
Notes:
- [z] = not applicable.
- Excludes Derbyshire Constabulary, who were unable to provide data in the year ending March 2026.
Officer-observed ethnicity is recorded by police using the following ONS categories:
- White
- Black
- Asian
- Other
- Unknown
As explained in the stop and search chapter, one disadvantage of officer-observed ethnicity data is that it doesn’t include a ‘Mixed’ ethnicity group. People of Mixed ethnicity are reported under different ethnic groups, such as Black or Asian.
The MPS’s officer-observed ethnicity data has a higher completion rate than their SDE data, with missing information in just 6.1% of arrest records in the year ending March 2026. Overall, in England and Wales, just 2.8% of officer-observed ethnicity data was missing.
Where officer-observed ethnicity was recorded, 76.6% of people arrested were perceived to be White, 11.8% Black, 9.8% Asian, and 1.8% were recorded as “Other” ethnicity (table 3.6). The proportion who were observed to be White was a percentage point lower than in the previous year (when it was 77.6%).
Table 3.6: Officer-observed ethnicity of persons arrested, year ending March 2025 and year ending March 2026, England and Wales excluding Derbyshire Constabulary
| Officer-observed ethnicity | Year ending March 2025 - Number of arrests | Year ending March 2025 - % excluding unknowns | Year ending March 2026 - Number of arrests | Year ending March 2026 - % excluding unknowns |
|---|---|---|---|---|
| Asian | 64,284 | 9.2% | 70,500 | 9.8% |
| Black | 80,603 | 11.5% | 84,601 | 11.8% |
| White | 542,567 | 77.6% | 550,983 | 76.6% |
| Other | 11,412 | 1.6% | 13,240 | 1.8% |
| Unknown | 25,409 | [z] | 20,379 | [z] |
| Total | 724,275 | 100% | 739,703 | 100% |
Source: Arrests summary data tables, year ending 31 March 2026; table A.01d Home Office
Notes:
- [z] = not applicable.
- Excludes Derbyshire Constabulary, who were unable to provide data in the year ending March 2026.
Arrests data is collected by the Home Office in an aggregated format, as opposed to stop and search data which is collected at the level of individual records. Therefore, it is not possible to develop a ‘combined ethnicity’ approach to ethnicity analysis as has been done with stop and search data (that is, using officer-observed ethnicity for arrests where self-defined ethnicity is not available).
The following analysis considers the SDE of those arrested relative to the resident population as a whole, by calculating arrest rates for each ethnic group. Population data is based on the 2021 census. The relative ratios presented in this section give an indication of the difference in arrest rates for people from Black, Asian, Mixed and Other ethnic backgrounds compared with those who identify as White. A rate of more than one means that that ethnic group is arrested at a higher rate than the White group, whereas a rate of less than one means they are arrested at a lower rate than the White group.
Persons who identified as Black or Black British were arrested at a rate 2.2 times that of those who identified as White. In the last 4 years the disparity rate for the Black ethnic group decreased from 2.4 in the year ending March 2022 to 1.7 in the year ending March 2024 and then increased again. This may be in part due to the MPS’s data quality issues since the disparity rate was lowest in the year ending March 2024 when the proportion of records where SDE was unknown for the MPS was at its highest. Excluding the Metropolitan Police, the disparity rate for the Black ethnic group has increased from 2.1 in the year ending March 2022 to 2.6 in the year ending March 2026.
People of a Mixed ethnic background were also arrested at a higher rate than the White ethnic group (1.4 times). People from Asian and “Other” ethnic backgrounds however were arrested at rates similar to people of White ethnic backgrounds (disparity ratios of 1.0 and 1.1 respectively). The disparity rates for the mixed, Asian and “Other” ethnic groups had small increases of 0.1 in the latest year (Table 3.7).
Table 3.7: Disparity rates (compared with the White ethnic group) by SDE, year ending March 2025 and year ending March 2026, England and Wales (E&W), including and excluding the Metropolitan Police and Derbyshire Constabulary
| SDE | Year ending March 2025 - disparity rate, E&W excluding Derbyshire | Year ending March 2026 - disparity rate, E&W excluding Derbyshire | Year ending March 2025 - disparity rate, E&W excluding Derbyshire and the MPS | Year ending March 2026 – disparity rate E&W excluding Derbyshire and the MPS |
|---|---|---|---|---|
| Asian (or Asian British) | 0.9 | 1.0 | 1.1 | 1.2 |
| Black (or Black British) | 1.8 | 2.2 | 2.5 | 2.6 |
| Mixed | 1.3 | 1.4 | 1.4 | 1.5 |
| Other | 1.0 | 1.1 | 1.3 | 1.3 |
Source: Arrests ethnic disparity time series, Home Office
Notes:
- Excludes Derbyshire Constabulary, who were unable to provide data in the year ending March 2026.
3.8 Arrests by police force area (PFA)
Of the 42 forces in England and Wales which provided data, 19 showed an increase in the number of arrests in the year ending March 2026 compared with the year ending March 2025, while 23 forces showed a decrease.
As with previous years, the Metropolitan Police (MPS) made the greatest number of arrests in the year ending March 2026 (108,993 or 14.7% of total arrests – similar to the 15.0% of the general population – excluding Derbyshire - that they account for). The number and proportion of arrests accounted for by the MPS has increased since the year ending March 2024, when they made 96,426 arrests (13.7%). Prior to this, the number and proportion of arrests accounted for by the Metropolitan Police had been decreasing, down from the year ending March 2016 when the MPS accounted for 22.0% of arrests.
In comparison, MPS made up 17.5% of police recorded crime in the year ending March 2026 (excluding fraud).
Greater Manchester and West Midlands Police each made up around 7% of total arrests and West Yorkshire accounted for around 6%, whereas most forces account for less than 3% of all arrests. The 4 forces with the largest number of arrests accounted for over a third (34.6%) of the total number of arrests.
In the following section, the arrest rate per force population has been calculated using the mid-2025 population estimates for England and Wales, supplied by the Office for National Statistics, which are based on the results of the 2021 census.
The number of arrests expressed per 1,000 people of the population in England and Wales[footnote 12] was 12.1 in the year ending March 2026. This varied by PFA[footnote 13] with the highest rate in Cleveland (18.2 per 1,000). The lowest arrest rates, at 6.5 arrests per 1,000 members of the population, were found in the Warwickshire and Dorset PFAs. In comparison, there were 84.7 police recorded crimes (not including fraud) per 1,000 population[footnote 14] in England and Wales (including Derbyshire) in the year ending March 2026.
Differences in the proportion of arrestees from ethnic minority backgrounds (not including White minorities) in some PFAs are likely to, in part, reflect the differing resident and day-time populations in those areas. For example, the proportion of those arrested who identified as Black, Asian, mixed or other ethnic background ranged from 3.4% in Dyfed-Powys to 58.2% in the Metropolitan Police Service area (excluding unknowns). Population data from the 2021 Census shows that the combined population of Black, Asian, Mixed and Other ethnic groups for Dyfed-Powys was 2.7%, whereas in the Metropolitan Police area it was 46.3%. However, comparisons in arrest rates between areas should be made with caution because population breakdowns are based on residents of a particular area (such as they do not include visitors).
Figure 3.8: Number of persons arrested per 1,000 population, by PFA, year ending March 2026, England and Wales excluding Derbyshire Constabulary
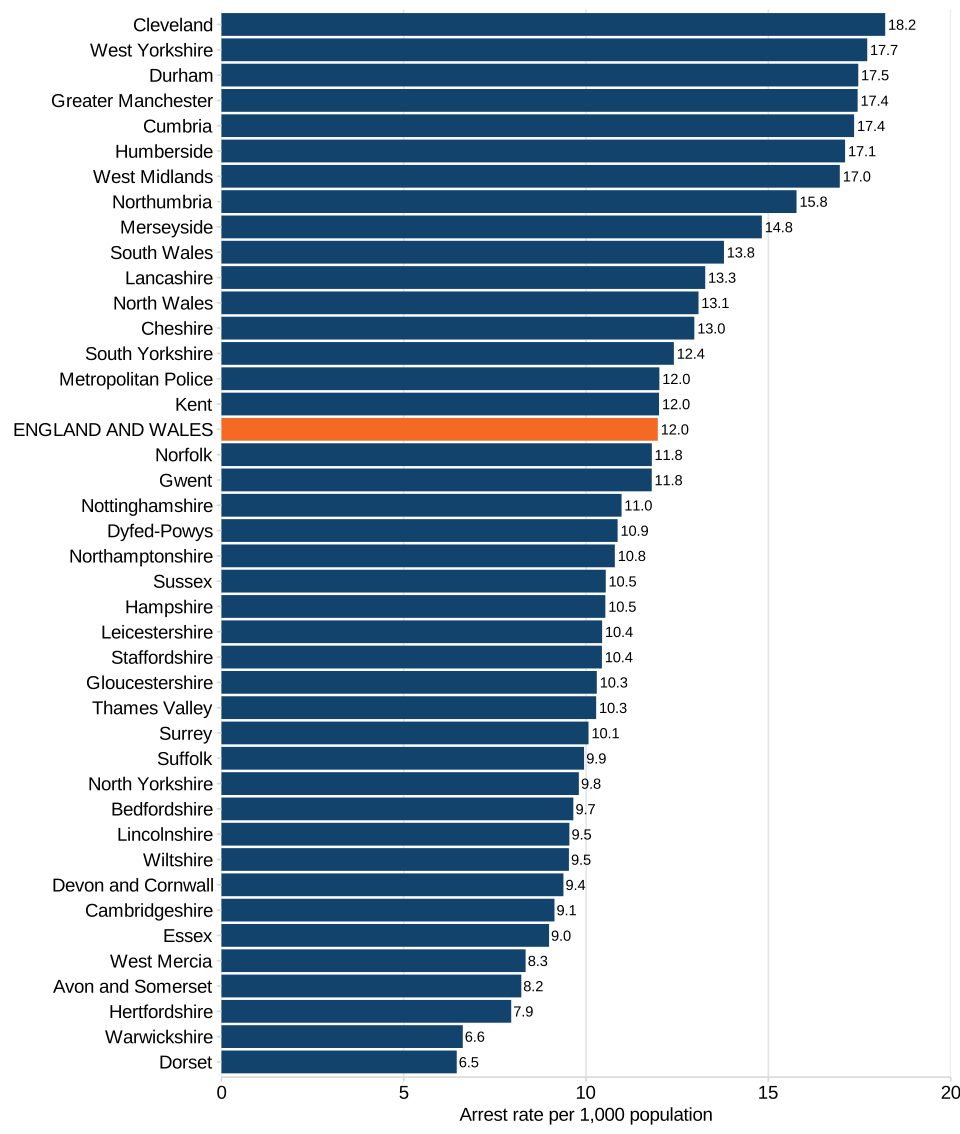
Source: Arrests summary data tables, year ending 31 March 2026; table A.05, Home Office
Notes:
- Calculated using mid-2025 population estimates for England and Wales supplied by the Office for National Statistics, which are based on the results of the 2021 census.
- City of London rates not shown due to the small resident population of the area relative to the transient or visiting population. City of London figures have been included in the England and Wales total.
- Excludes Derbyshire Constabulary, who were unable to provide data in the year ending March 2026.
4.1 Detentions under the Mental Health Act 1983 - introduction and main findings
Statistics in this chapter covering section 136 of the Mental Health Act 1983 are designated as Accredited Official Statistics (Office for Statistics Regulation).
Statistics covering section 135 of the Mental Health Act 1983 are designated as Official Statistics in Development (Office for Statistics Regulation).
Police forces in England and Wales regularly interact with people experiencing mental ill health. Sometimes these interactions may result in the need to remove a person and take them to a place of safety, under sections 135 and 136 of the Mental Health Act 1983.
S136 (Mental Health Act 1983)
Section 136 of the Mental Health Act 1983 allows the police to take someone to, or keep them at, a place of safety if they appear to have a mental disorder and need immediate care or control.
In practice, this means:
- the power applies only in public places
- the police can take the person to a health-based place of safety for a mental health assessment
- the person can be kept there for up to 24 hours, with a possible 12-hour extension in exceptional circumstances
- police stations should be used only for adults and only in exceptional cases, and never for those aged 17 and under
- wherever possible, the police should consult a healthcare professional before using this power
The purpose of Section 136 is to ensure that someone experiencing a mental health crisis in a public place receives timely assessment and support in a safe, appropriate environment, rather than being treated as a criminal matter.
S135 (Mental Health Act 1983)
Section 135 of the Mental Health Act 1983 allows the police, with a court warrant, to enter a private property to help a person who appears to have a mental disorder and may need urgent care or assessment.
In practice, this means:
- a mental health professional (an Approved Mental Health Professional, or AMHP) can apply to a magistrate for a warrant if someone inside a home is believed to be mentally unwell and access has been refused
- the police can then enter the property and take the person to a place of safety for a mental health assessment
- the person can be kept there for up to 24 hours, with a possible 12-hour extension in exceptional cases
- police stations should only be used as a place of safety for adults in exceptional circumstances, and never for those aged 17 and under
The aim of Section 135 is to protect the individual’s safety and ensure they receive the care and assessment they need, while maintaining legal safeguards when entering private premises.
In the year ending 31 March 2026 there were 32,465 detentions under section 136 of the Mental Health Act 1983. Excluding Cumbria Police, who were not able to provide data in the year ending March 2026, this was a 2.7% increase compared with the previous year.
Where the details were known, 53.7% of detentions were of males, 94.6% of cases were adults aged 18 or over and 82.7% were detentions of people from the White ethnic group.
Where the details were known, the person being detained was taken to accident and emergency in 52.1% of cases (16,298 individuals), 45.3% (14,167 individuals) were taken to a health-based place of safety, and 2.5% (770 individuals) were taken to a police station.
4.2 Detentions under section 136 of the Mental Health Act 1983
Under section 136 of the Mental Health Act a police officer may remove a person from any public place, other than a private dwelling, to a place of safety if, in the officer’s judgement, that person appears to be suffering from a mental disorder and needs immediate care or control, in the interests of their safety or that of others to be assessed by an approved mental health professional and an approved s12 doctor[footnote 15]. The maximum period for which a person can be detained at a place of safety under sections 135 or 136 is usually up to 24 hours, with the possibility of this period being extended by a further 12 hours if a person could not be assessed for clinical reasons.
In December 2022, chief constables for England and Wales voted to adopt the Right Care, Right Person (RCRP) approach. RCRP was an initiative developed by Humberside Constabulary. RCRP provides that when the police receive a call seeking the deployment of police resource, which concerns mental health or some other types of health and social care issues, officers will be deployed if (in line with the police’s legal duties) a crime has been or might be committed, or to protect people from a real and immediate risk to life or serious harm. The approach is designed to ensure that people of all ages, who have health and/or social care needs, are responded to by the right person, with the right skills, training, and experience to best meet those needs. The approach does not overwrite the independence of chief constables and their discretion to deploy in response to other types of call. This approach has started to be implemented by police forces in England and Wales.
4.2.1 Data collected
Following concerns about the quality and transparency of police data in this area, at the Policing and Mental Health Summit in October 2014 the then Home Secretary announced that the Home Office would work with the police to develop a new data collection covering the volume and characteristics of detentions under the Mental Health Act 1983.
A data collection was developed which requests forces to provide information on the age, sex and ethnicity of people detained, as well as the place of safety used (including, where applicable, the reason for using police custody), and the method of transportation used (including, where applicable, the reason for using a police vehicle).
In this report, we refer to the sex of people detained. We are reporting the data in the format it is collected and we are working to bring this data in line with Government Statistical Service sex and gender harmonisation standards.
In the year ending March 2024, following consultation with stakeholders, some changes were made to the data collection. These changes only apply to the section 136 collection, apart from the change of ‘Ambulance not available within 30 minutes’ to ‘Ambulance not available within agreed timeframe’ which also applies to section 135. For a full list of changes to the data collection see the user guide.
One of the changes included amending the guidance for how A&E as a place of safety should be recorded. Previously, if the individual was taken to A&E for treatment of physical injuries, we asked the force to record the place of safety they were taken to following A&E. However, under legislation, A&E can be a place of safety if that is determined to be the most appropriate place of safety, for example if a person has self-harmed but also needs a mental health assessment. Under the previous ADR guidance, the extent to which A&E was being used as a place of safety was therefore largely unknown. Current guidance advises that if someone is initially taken to A&E for treatment of physical injuries, A&E should be recorded as the place of safety. As a result of this, place of safety data for the year ending March 2024 onwards is not comparable with previous years.
Prior to the year ending March 2017, data on the total number of section 136 detentions was collected and published by the National Police Chiefs’ Council (NPCC).
4.2.2 Data quality
In the year ending March 2025, the Metropolitan Police (MPS) changed to a new reporting system for detentions under section 136 of the Mental Health Act. Detentions under section 136 were previously being underreported. They also revised their data from the year ending March 2024 using the new methodology. This resulted in a 36% increase in the number of detentions under s136 reported for the year ending March 2024 (from 4,475 to 6,089). Therefore, their data from the year ending March 2024 onwards is not comparable with previous years. The Metropolitan Police account for 17% of section 136 detentions, therefore caution should be applied when interpreting the time series at an England and Wales level.
In this data collection, age data is collected using the categories “17 and under”, “18 and over” and ‘unknown’. In the year ending March 2026, due to the change in reporting processes, the MPS were only able to supply section 136 age data in the categories of “19 and under” and “20 and over”. For section 135 data, the MPS were able to provide age data using the standard age categories.
In the year ending March 2026, Cumbria Police could not provide data due to the information required not being available in a readily retrievable format within current systems. Cumbria are working with the system provider to explore changes to data capture and recording processes so that the required information can be recorded in a structured format and reported more effectively in future years for ADR 125. Where specified, Cumbria Police have been excluded from year-on-year comparisons. However, for longer-term time series, the forces that provided data vary between years.
4.2.3 Detentions under section 136 of the Mental Health Act 1983
This section summarises the findings on detentions under section 136 from police forces in England and Wales, as well as the British Transport Police, for the year ending March 2026.
In the year ending March 2026 there were 32,465 detentions under section 136 of the Mental Health Act 1983.
Excluding Cumbria Police, who were unable to provide data in the year ending March 2026, this was a 2.7% increase from the previous year.
Detentions under section 136 had been increasing between the year ending March 2017 and March 2022 (except for a slight decrease during the year of the pandemic ending in March 2021), decreased between the year ending March 2023 and March 2025[footnote 16], before this increase from year ending 2025 to year ending 2026.
Excluding cases where the person’s sex was unknown or other (1.0%), 53.7% of detainees were male.
In England and Wales excluding the Metropolitan Police, where age data was known, 94.6% of cases involved an adult aged 18 or over.
Both SDE and officer-observed ethnicity (ethnicity as perceived by the police officer) are collected as part of the Annual Data Requirement (ADR). However, due to the nature and circumstances of a detention under the Mental Health Act, it may not be appropriate for an officer to ask for a person’s SDE, therefore some police forces only collect data on officer-observed ethnicity.
SDE was reported in 67.5% of cases. Where SDE was known:
- 82.7% of those detained were White
- 7.6% were Black or Black British
- 5.5% were Asian or Asian British
- 2.5% were of Mixed ethnicity
- the remaining 1.6% of people detained were of another ethnic group
Substituting in officer-observed ethnicity for forces who do not collect SDE increases the ethnicity completion to 76.7%.
Using this combined measure:
- 83.5% of those detained were White
- 7.2% were Black
- 5.4% were Asian
- 2.2% were Mixed or multiple ethnicities
- 1.6% were of Other ethnicities
A disadvantage of officer-observed ethnicity data is that it doesn’t include a ‘Mixed’ ethnicity group. People of Mixed ethnicity are reported under different ethnicity groups, such as Black or Asian.
Figure 4.1 Ethnicity of people detained under section 136 of the Mental Health Act 1983, year ending March 2026, England and Wales
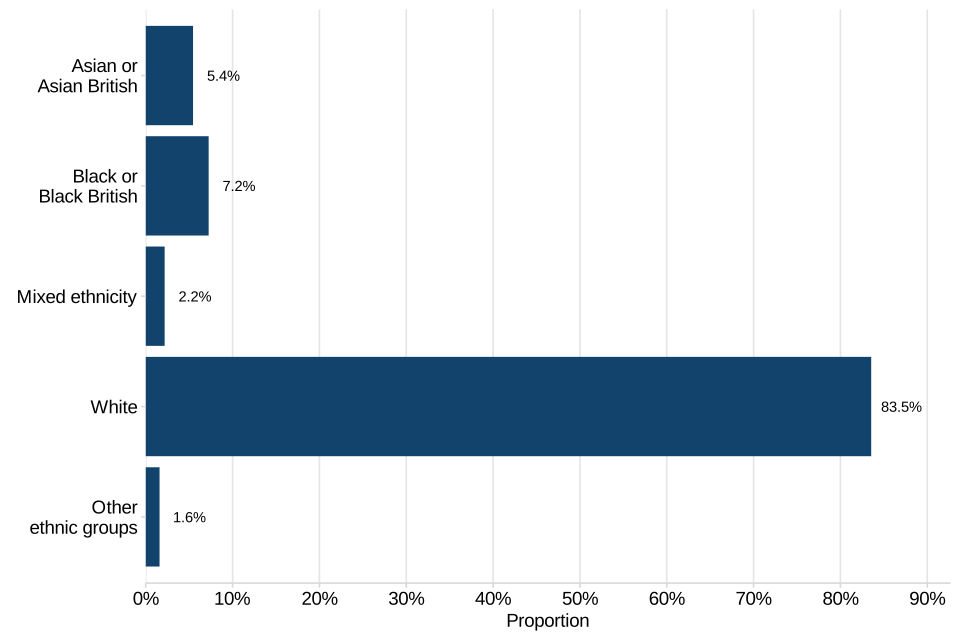
Source: Detentions under the Mental Health Act (1983) data tables, year ending 31 March 2026; tables MHA_03a and MHA_03b, Home Office
Notes:
- Uses officer-observed ethnicity (ethnicity as judged by officer) where SDE was unknown.
- Does not include 7,550 cases (23.3%) where ethnicity was not known.
Table 4.1: Ethnic breakdown of section 136 detentions, England and Wales, year ending March 2026
| Ethnicity | Asian | Black | Mixed | White | Other |
|---|---|---|---|---|---|
| SDE only | 5.5% | 7.6% | 2.5% | 82.7% | 1.6% |
| Combined measure (substituting in officer- observed for forces that don’t collect SDE) | 5.4% | 7.2% | 2.2% | 83.5% | 1.6% |
| Officer-defined only | 7.5% | 11.8% | N/A | 77.9% | 2.8% |
Source: Detentions under the Mental Health Act (1983) data tables, year ending 31 March 2026; tables MHA_03a and MHA_03b, Home Office
Table 4.2: Proportion of detentions where ethnicity was known, England and Wales, year ending March 2026
| Ethnicity type | % ethnicity known |
|---|---|
| SDE only | 67.5% |
| Combined measure (SDE, but officer-defined for forces that don’t collect SDE) | 76.7% |
| Officer-observed only | 78.7% |
Source: Detentions under the Mental Health Act (1983) data tables, year ending 31 March 2026; tables MHA_03a and MHA_03b, Home Office
4.2.4 Method of transport to a place of safety
Forces were not always able to distinguish the method of transport used to transport a person to a place of safety, and 4.6% of cases are recorded as “not known”. Excluding these “not known” cases, a police vehicle was used in 45.9% of cases. Over the past 10 years, the proportion of individuals transported in a police vehicle has remained in the range 51% to 55%, except from the year of the pandemic ending, March 2021, where it was lower (44.1%), the year ending March 2022 where it was higher (60.5%), and the year ending March 2026 where it was lower (45.9%)[footnote 17].
An ambulance was used in a further 49.0% (15,177) of cases. Similar to police vehicle transport, between the years ending March 2017 and March 2026 the proportion of individuals transported in an ambulance has remained in the range 40% to 45%, with the exception of the year ending March 2021, where it was higher (51.6%), the year ending March 2023, where it was lower (34.8%), and the year ending March 2026 where it was higher (49.0%).
The remaining 1.2% of detainees were transported in an ‘other health vehicle’ or were already at the place of safety. The most common method of transport used varied greatly by PFA. For example, a police vehicle was used in 4.1% of detentions for West Midlands, but for 99.2% of detentions for North Wales.
In the case where a police vehicle was used to transport the person to a place of safety, police forces are requested to give a reason why. In the 14,200 cases (45.9%) where a police vehicle was used, the reason why was not known in 1,059 cases (7.5% of cases where a police vehicle was used). Of those cases where the reason for using a police vehicle was recorded, 39.9% were because an ambulance was not available in the agreed timeframe. In a further 30.2% of cases, a risk assessment concluded the person being detained should be transported in a police vehicle due to their behaviour.
There were also 3,449 cases (26.2%) where an ambulance was not requested. This could be for a number of reasons, including instances such as the individual already being located close to the place of safety, making it more efficient to use a police vehicle due to the short journey involved. The remaining cases (3.7%) were for other reasons including where an ambulance was no longer available due to a higher priority call and when an ambulance crew refused to convey.
Figure 4.2 Reasons for using a police vehicle to transport a detainee to a place of safety, year ending March 2026, England and Wales
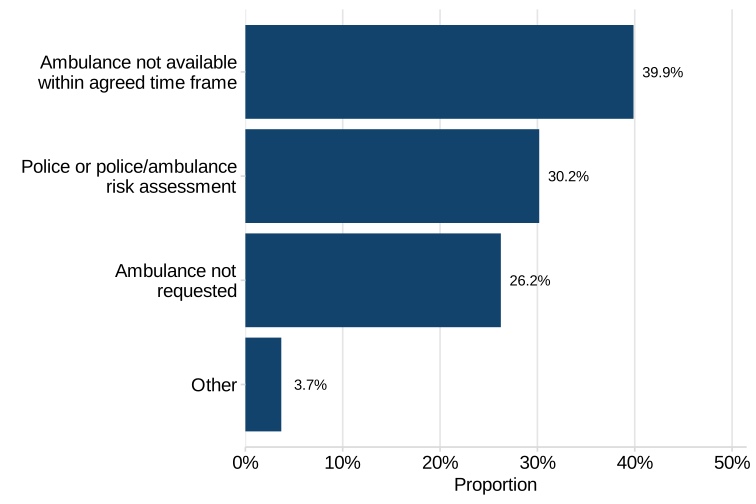
Source: Detentions under the Mental Health Act (1983) data tables, year ending 31 March 2026; table MHA_04b, Home Office
Notes:
- Does not include cases where the reason for using a police vehicle was not known (1,059).
- “Other” includes cases where an ambulance was no longer available due to a higher priority call and when an ambulance crew refused to convey.
4.2.5 Place of safety
Following a detention under section 136 of the Mental Health Act, a place of safety was recorded in 96.4% of cases. Of the cases where the place of safety was known, 52.1% of detainees were taken to accident and emergency. The second most common place of safety people were taken to was a health-based place of safety (HBPoS), which made up 45.3% of cases in the year ending March 2026.
The proportion of individuals taken to A&E as a place of safety has been increasing in recent years. Between the year ending March 2017 and the year ending March 2023, the proportion taken to A&E increased from 8.2% to 39.4%. Place of safety data cannot be directly compared between the years ending March 2023 and 2024 due to changes in the guidance around recording A&E. However, after this break in the data, the proportion of individuals taken to A&E continued to increase (from 47.3% in the year ending March 2024 and up to 51.3% in the year ending March 2025, and up to 52.1% in the year ending March 2026.
In contrast, the proportion of people taken to a Health Based Place of Safety has been declining. The proportion creased from 86.0% in the year ending March 2017 to 58.3% in the year ending March 2023. It then continued to decline between the year ending March 2024 and March 2026 (from 51.2% down to 45.3%).
Figure 4.3: Proportion of people detained under section 136 of the Mental Health Act (1983) who were taken to a Health Based Place of Safety, year ending March 2017 to year ending March 2026, England and Wales
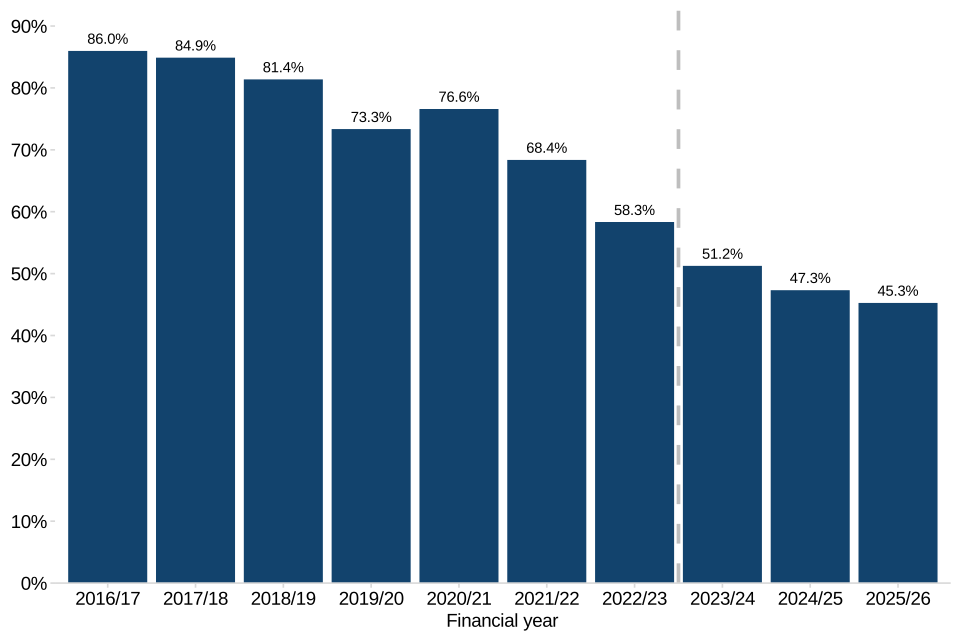
Source: Detentions under the Mental Health Act (1983) data tables, year ending 31 March 2026; table MHA.08, Home Office
Notes:
- Excludes unknowns.
- In some years data was not received by all forces. Additionally, some forces have reported improvements to recording practices over time. Therefore, changes over time should be interpreted with caution.
- For the year ending March 2024 collection, guidance around the recording of “A&E” as a place of safety was changed. Therefore, the data for the year ending March 2024 onwards is not fully comparable to previous years.
There were 770 people (2.5%) taken to a police station after being detained under section 136. Excluding 19 cases where the reason was not known, in the majority of cases (74.0%) section 136 was used on someone outside of custody and they were conveyed in (for example, after an arrest) and the conditions in the regulations were met for police custody to be used as a place of safety[footnote 18].
In a further 15.8% of cases, section 136 was used on a person already in custody and the conditions in the regulations were met. In 9.9% of cases, section 136 was used on a person already in custody, but the regulations were not met. In these instances, custody was used as a place of safety because there was not a more appropriate place of safety available.
In the remaining 2 cases (0.3%), section 136 was used on someone outside of custody and they were conveyed in and the conditions were not met.
Figure 4.4 Reasons for the detainee being taken to a police station, year ending March 2026, England and Wales
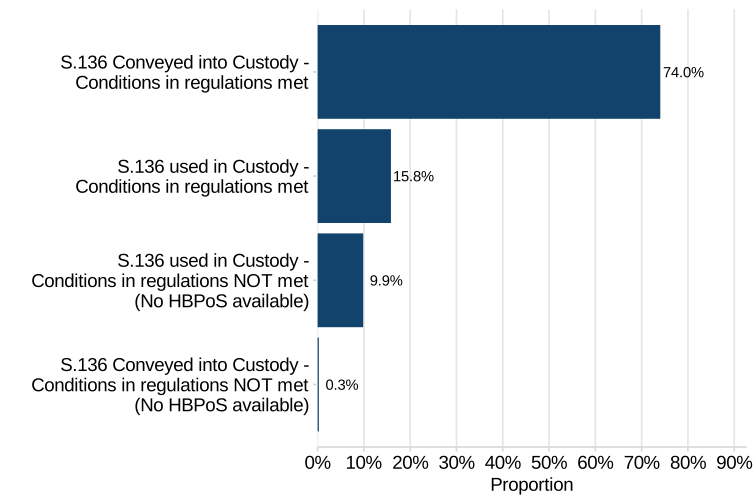
Source: Detentions under the Mental Health Act (1983) data tables, year ending 31 March 2026; table MHA_05b, Home Office
Notes:
- Does not include those cases where the reason for using a police station was not known.
The Policing and Crime Act 2017 aimed to improve outcomes for people in mental health crisis, was introduced on 11 December 2017. The Act bans the use of police cells for those aged 17 and under in mental health crisis and makes sure that they can only be used as a place of safety for adults in genuinely exceptional circumstances. Where age and place of safety were reported, there were 11 cases where an individual aged 17 and under (or 19 and under in the case of the MPS) was taken to police custody as a place of safety in the year ending March 2026. This was an increase from 0 cases in the year before.
4.2.6 Other data sources
As part of its annual Mental Health Bulletin, NHS Digital (formerly the Health and Social Care Information Centre) data on inpatients detained in hospitals in England under the Mental Health Act 1983. Although these numbers will include some cases where the police initially detained the individual, they will also include a large number of other cases where the police were not involved.
Data on the number of occasions where a HBPoS was used can differ between the NHS Digital data and the NPCC data, due to the different data sources used.
4.3 Detentions under section 135 of the Mental Health Act 1983
Under section 135 a magistrate may issue a warrant, on application by a mental health professional, authorising a police officer to enter specific premises in respect of a mentally disordered person, believed to be in need of care or control, and to remove that person from those premises if necessary. Incidents are only recorded by the police under section 135 if an officer enters a private premise under the warrant (including by force if necessary) and/or removes the person from the premises to a place of safety in accordance with the terms of the warrant.
Either or both of these powers must be used by an officer for it to be counted as a section 135 detention for the purposes of this data collection. Therefore, incidents where an officer attends a private premise in response to ad-hoc requests for assistance or other reasons but does not carry out either part of a section 135 warrant, are not recorded in this data set.
Data analysis on detentions under section 135 of the Act is based on data received from 32 out of 43 police forces[footnote 19] for the year ending March 2025. British Transport Police do not use section 135 legislation.
Due to the provisional and incomplete nature of this dataset, these statistics have been designated as Official Statistics in Development. Therefore, data in this chapter gives an indication only, and should be treated with caution.
On 27 February 2024, the Metropolitan Police changed to a new recording system (CONNECT) for detentions under section 135 of the Mental Health Act. Detentions under section 135 were likely being under-recorded on the old system. The MPS have stated that officers are more familiar with CONNECT which has resulted in improved recording. Unlike their section 136 data, the MPS were not able to revise their year ending March 2024 section 135 data for this publication[footnote 20]. This resulted in a 78% increase in recorded section 135 detentions between the year ending March 2024 and the year ending March 2025 (from 1,600 to 2,854). Therefore, data for the year ending March 2025 is not comparable with previous years. Since the MPS accounted for almost two-thirds (63%) of section 135 detentions in the year ending March 2025, we have not included year-on-year comparisons at an England and Wales level in this publication. Data from the year ending March 2024 is mostly comparable with previous years since the change in system occurred late in the financial year.
In this report, we refer to the sex of people detained. We are reporting the data in the format it is collected and we are working to bring this data in line with Government Statistical Service sex and gender harmonisation standards.
4.3.1 Main findings
In the year ending March 2026, there were 4,829 detentions under section 135 of the Mental Health Act. Over half (56.8%) of these were accounted for by the Metropolitan Police account for 16.4% for section 136 detentions (of the 43 forces who provided data).
Excluding cases where the sex of the person was unknown or other (16.9%), 58.6% were male detainees.
The vast majority (over 98.8%) of cases were detentions of adults aged 18 or over (not including those cases where the age of the person being detained was not recorded).
The proportion of known SDE was much lower for section 135 detentions (26.0%) than section 136 detentions (67.5%). The MPS’s SDE data is more complete for section 136 detentions than section 135 (56.3% versus 23.1%), but they account for a much greater proportion of section 135 detentions than section 136 detentions (56.8% versus 16.4%). Excluding the MPS, SDE completion was greater for detentions under section 136 (69.9%) compared with section 135 (29.9%).
Where SDE was known:
- 8.4% of those detained were Asian or Asian British
- 26.3% were Black, African, Caribbean or Black British
- 5.3% were of Mixed or multiple ethnic groups
- 57.0% were White
- 3.1% were of Other ethnicities
The Metropolitan Police is a much more ethnically diverse PFA compared to other forces in England and Wales (see Regional ethnic diversity - Ethnicity facts and figures). According to Census 2021 data, people from ethnic minority backgrounds (excluding White minorities) make up 46% of the population of the Metropolitan Police area, in contrast to 18% of the population of England and Wales. Since the Metropolitan Police have a low completion of SDE data but account for a large proportion of section 135 detentions, SDE data is likely not representative of the true picture.
When analysing officer-observed ethnicity data, people from White ethnic backgrounds accounts for a larger proportion of detentions:
- 10.3% of those detained were Asian
- 35.5% were Black
- 51.9% were White
- 2.2% were Other ethnicity
A disadvantage of officer-observed ethnicity is that it does not include a ‘Mixed’ category. People from mixed or multiple ethnic backgrounds are grouped under different categories, such as Black or Asian.
Tables 4.3 and 4.4 show how analysing ethnicity data using different methods impacts the completion rate and ethnic breakdown.
Table 4.3: Ethnic breakdown of section 135 detentions, England and Wales, year ending March 2026
| Ethnicity type | Asian | Black | Mixed | White | Other |
|---|---|---|---|---|---|
| SDE only | 8.4% | 26.3% | 5.3% | 57.0% | 3.1% |
| Combined measure (substituting in officer-observed ethnicity for forces that don’t collect SDE) | 8.8% | 20.0% | 3.7% | 65.0% | 2.5% |
| Officer-observed only | 10.3% | 35.5% | N/A | 51.9% | 2.2% |
Source: Detentions under the Mental Health Act (1983) data tables, year ending 31 March 2026; tables MHA_103a and MHA_103b, Home Office
Table 4.4: Proportion of detentions where ethnicity was known, England and Wales, year ending March 2026
| Ethnicity type | % ethnicity known - Section 136 | % ethnicity known - Section 135 |
|---|---|---|
| SDE only | 67.5% | 26.0% |
| Combined measure (SDE, but using officer-observed for forces that don’t collect SDE) | 76.7% | 37.0% |
| Officer-defined only | 78.7% | 68.2% |
Source: Detentions under the Mental Health Act (1983) data tables, year ending 31 March 2026; tables MHA_03a, MHA_03b, MHA_103a, and MHA_103b, Home Office
Data on the method of transport and place of safety used for detentions under section 135 is available in the data tables by PFA. Given the large amount of missing data and variation in recording practices across forces, this data has not been presented at a national level.
A.1 Stop and search disparity rates by police force area and ethnicity
The following analysis compares disparity rates against stop and search rates, at PFA level.
When making comparisons between forces on disparity rates, the following should be considered:
- both the relatively low number of stop and searches and the relatively small size of the resident population of ethnic minorities in some force areas can produce large differences in rates per 1,000 population, which are the result of a very small difference in the absolute numbers
- police resourcing and priorities – the level of stop and search in a PFA will be influenced by operational priorities and decisions
- transient populations – stop and search rates are based on resident population estimates at a specific time and do not take into account individuals temporarily visiting an area, for example, tourists and students
- variations within PFAs – Annex A.2 shows, some force areas include many smaller areas (LSOAs) that have little to no stop and search activity, with a small proportion of areas that make up the majority of stop and search
Disparity rates are presented to one decimal place to show differences between ethnic groups which can be small. The following analysis is based on self-defined ethnicity only as the data is taken from the disparity time series tables, covering the longer-term trends for which only SDE is available. City of London Police are excluded from comparisons against other police forces, due to the low resident population of that area.
Black ethnic group
Figure A.1: Overall stop and search rates and relative rates for Black individuals, by PFA, year ending March 2026, England and Wales
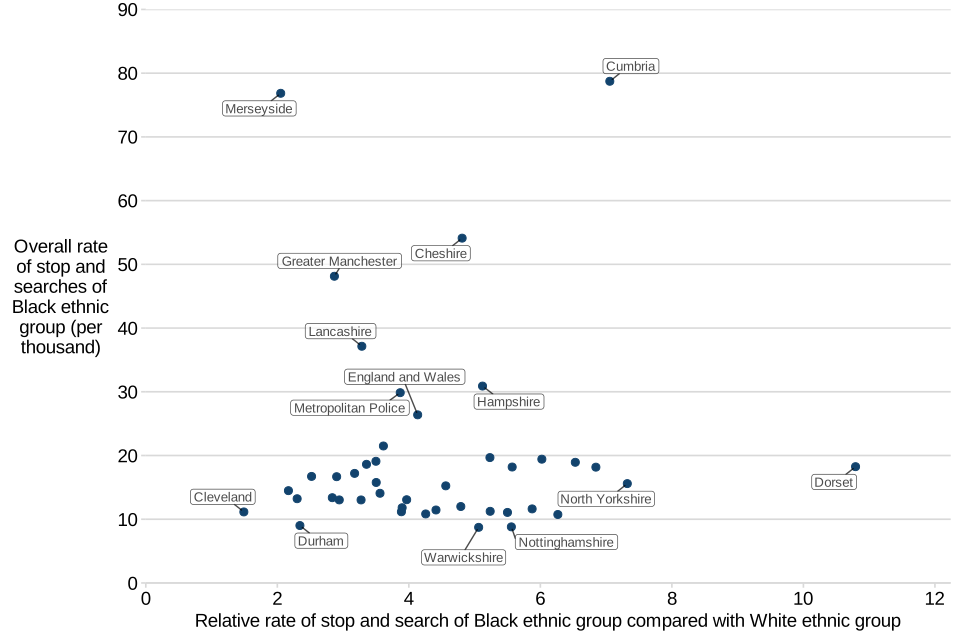
Source: Stop and search – ethnic disparity time series dashboard, Home Office
Notes:
- City of London and British Transport Police are not shown, but they have been included in the England and Wales total.
In England and Wales there were 26.4 stop and searches of individuals from a Black background per 1,000 population in the year ending March 2026, up from 22.4 in the year ending March 2025 (22.4 per 1,000 population). This is the highest overall rate compared with all other ethnic groups and 4.1 times higher compared with the White group, who were stopped and searched at an overall rate of 6.4 per 1,000 population.
Cumbria had the highest overall rates for individuals from a Black background, at 78.7 stop and searches per 1,000 population, followed by Merseyside with an overall rate of 76.8 stop and searches per 1,000 population. Despite Cumbria having the highest overall rate of stop and search it is based on a very small number of searches (94 searches) compared to Merseyside (1,683). The Metropolitan Police Service (MPS) had by far the highest volume of stop and searches of Black people (35,479) and an overall rate of 29.9 stop and searches per 1,000 population. The lowest overall rate of stop and search of individuals from a Black background was by Warwickshire, with an overall rate of 8.7 stop and searches per 1,000 population.
Although Merseyside had the second highest overall stop and search rate for individuals from a Black background, they also had the second lowest relative rate of disparity compared with individuals from a White background (2.1). Only Cleveland (1.5) had a lower relative rate of Black people stopped and searched compared with White people.
As in previous years, Dorset had the highest relative rate, with individuals from a Black background being stopped and searched 10.8 times more than White individuals. However, this is based on a relatively low number of stop and searches of Black individuals (97) and a low proportion of the resident population which identified as Black in the 2021 Census (0.7% of residents).
Asian ethnic group
Figure A.2: Overall stop and search rates and relative rates for Asian individuals, by PFA, year ending March 2026, England and Wales
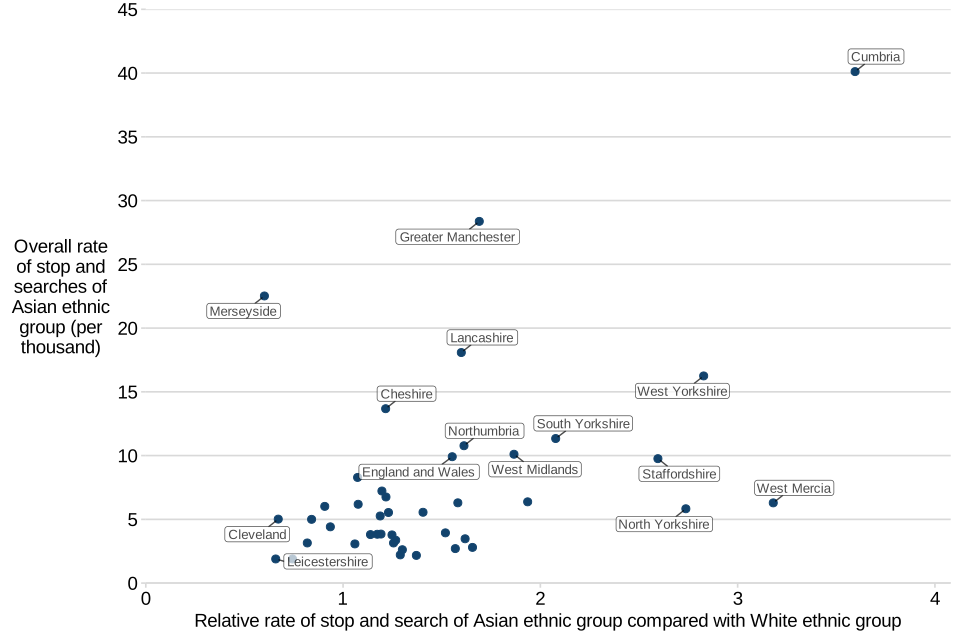
Source: Stop and search – ethnic disparity time series dashboard, Home Office
Notes:
- City of London and British Transport Police are not shown, but they have been included in the England and Wales total.
In England and Wales there were 9.9 stop and searches of individuals from an Asian background per 1,000 population in the year ending March 2026. Cumbria had the highest overall rate of stop and search of individuals from an Asian background at 40.1 stop and searches per 1,000 population, followed by Greater Manchester (28.4 per 1,000 population) and Merseyside (22.5 per 1,000 population). The lowest overall rate of stop and search of individuals from an Asian background was by Leicestershire and Wiltshire (1.9 per 1,000 population).
Although Cumbria, Greater Manchester and Merseyside had the highest overall rates of individuals from an Asian background stopped and searched, they had very different relative rates. Whereas Cumbria had the highest relative rate at 3.6 for Asian individuals stopped and searched, Greater Manchester (1.7) had a similar rate to England and Wales overall (1.6) and Merseyside had the lowest relative rate, at 0.6. There were 8 police forces in the year ending March 2026 where individuals from an Asian background were searched at a lower rate than individuals from a White background.
Mixed ethnic group
Figure A.3: Overall stop and search rates and relative rates for individuals from a Mixed ethnic background, by PFA, year ending March 2026, England and Wales
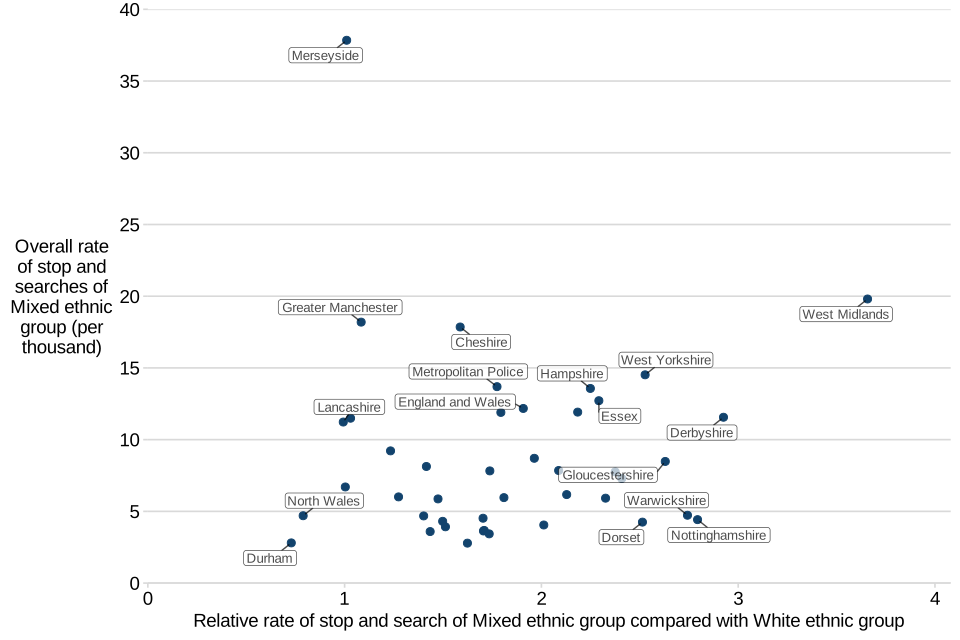
Source: Stop and search – ethnic disparity time series dashboard, Home Office
Notes:
- City of London and British Transport Police are not shown, but they have been included in the England and Wales total.
There were 12.2 stop and searches of individuals from a Mixed ethnic background per 1,000 population in England and Wales in the year ending March 2026. Merseyside displayed the highest overall rate of stop and search at 37.8 stop and searches per 1,000 population, followed by West Midlands with an overall rate of 19.8 stop and searches per 1,000 population. Durham and Norfolk had the lowest overall rate of stop and search of individuals from a Mixed ethnic background, at an overall rate of 2.8 stop and searches per 1,000 population.
In England and Wales individuals from a Mixed ethnic background were stopped at a relative rate of 1.9 times higher than White individuals. This relative rate varied between forces. West Midlands had the highest relative rate of 3.7, whilst Durham had the lowest relative rate (0.7). North Wales (0.8) were the only other force where individuals from a Mixed ethnic background were searched at a lower rate per 1,000 population than White individuals.
Other ethnic groups
Figure A.4: Overall stop and search rates and relative rates for individuals from Other ethnic groups, by PFA, year ending March 2026, England and Wales
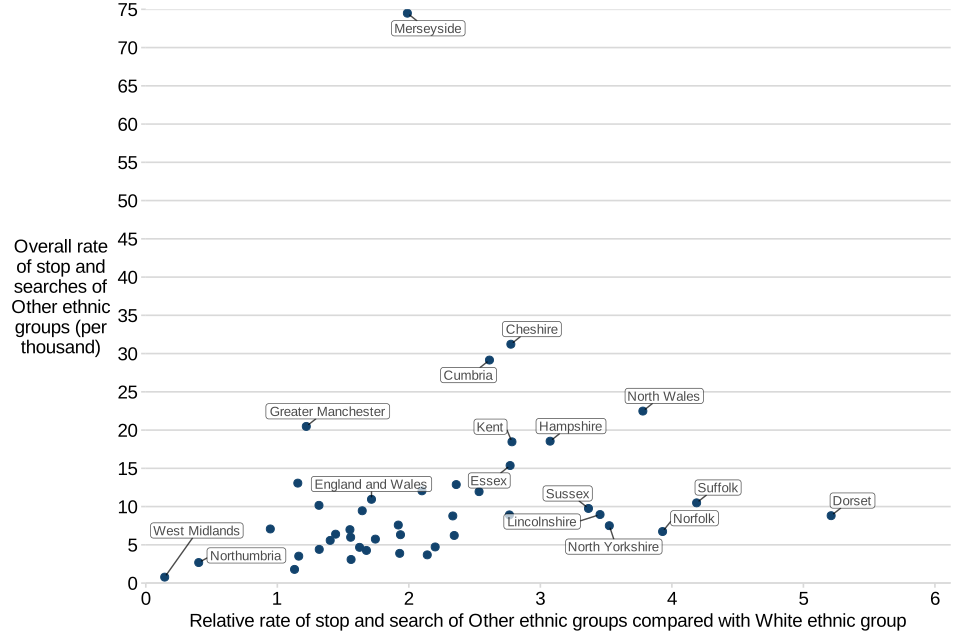
Source: Stop and search – ethnic disparity time series dashboard, Home Office
Notes:
- City of London and British Transport Police are not shown, but they have been included in the England and Wales total.
In England and Wales there were 11.0 stop and searches of individuals from Other ethnic groups per 1,000 population in the year ending March 2026. This varied between police forces. Merseyside had the highest overall rate of stop and search at 74.5 stop and searches per 1,000 population, whereas West Midlands had the lowest overall rate of stop and searches at 0.8 per 1,000 population.
In England and Wales individuals from Other ethnic groups were stopped at a relative rate of 1.7 times higher than White individuals. Dorset had the highest relative rate, with individuals from other ethnic groups being stopped at a relative rate 5.2 times higher than White individuals. The force with the lowest relative rate was West Midlands, where individuals from other ethnic groups were stopped at a relative rate less than one (0.1). Northumbria (0.4) and Cleveland (0.9) also stop and searched people from Other ethnic groups at a lower rate than White individuals.
A.2 Stop and search hotspot areas
This section contains information on stop and search hotspots conducted by the Metropolitan Police Service (MPS) in London, as well as Greater Manchester Police, Merseyside Police, West Midlands Police, Cumbria Police, North Yorkshire Police, and Suffolk Police. These areas have been selected as they provided good quality x and y co-ordinate data and allow comparisons to be made between areas with large urban centres with more rural areas.
The scales used in the map images in this section are different for each PFA, as they are designed to highlight areas with high levels of stop and search within each PFA, rather than for comparison between PFAs.
Metropolitan Police Service
Analysis of stop and search conducted by the MPS in the year ending March 2026 at Lower Super Output Area (LSOA) level shows that there are certain small areas of London, such as parts of Westminster, Havering and Lambeth with high levels of stop and search activity, and large areas (predominantly, but not limited to, the outskirts of the PFA) with comparatively low levels (figure A.5).
Approximately 25% of stop and search within London takes place in just 2.3% of LSOAs within London, and 50% of stop and searches take place in just 10.4% of LSOAs. Many of the areas highlighted yellow or light green in figure A.5, with very high levels of stop and search, are those where there is a significantly greater visiting population than the resident population of the area. For example, several areas of Westminster have very high levels of stop and search, reflecting the fact that people may gather in that area for tourism, or protests.
Figure A.5: Map of stop and search activity at LSOA level within London, year ending March 2026

Source: Stop and search data collection, Home Office
Notes:
- Includes searches carried out within the City of London by Metropolitan Police officers. Does not include searches undertaken outside London.
- Approximately 99% of stop and search records submitted to the Home Office by the Metropolitan Police in the year ending March 2026 had a valid LSOA within London.
Greater Manchester Police
Similarly to MPS, the majority of the outskirts of the Greater Manchester PFA have very low to no stop and search activity taking place, with the hotspots being in distinct parts of the urban centres. Approximately 25% of stop and search within Greater Manchester takes place in just 1.5% of LSOAs within Greater Manchester, and 50% take place within 8.6%. In Greater Manchester, 2 of the main hotspot areas are Manchester 055B and Manchester 054C, which have high levels of transient population moving through them as they contain Manchester Victoria train station and Arndale shopping centre.
Figure A.6: Map of stop and search activity at LSOA level within Greater Manchester PFA, year ending March 2026
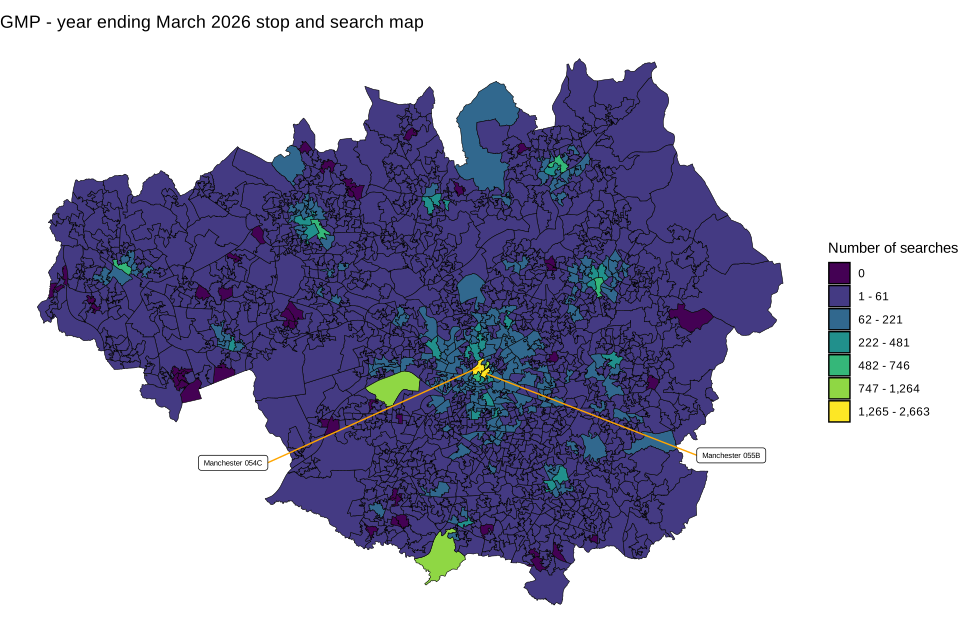
Source: Stop and search data collection, Home Office
Notes:
- Does not include searches undertaken outside Greater Manchester Police PFA.
- Approximately 94% of stop and search records submitted to the Home Office by Greater Manchester Police in the year ending March 2026 had a valid LSOA within Greater Manchester.
Merseyside Police
Merseyside Police showed a similar pattern to other PFAs containing large urban centres, with some areas of little to know stop and searches and others with very high amounts. Approximately 25% of stop and search within Merseyside takes place in just 1.5% of LSOAs within Merseyside, and 50% take place within 6.9%. In Merseyside, 2 of the main hotspot areas are Liverpool 061C and Liverpool 060C, which have high levels of transient population moving through them as they contain Liverpool central train station, Liverpool Lime Street station and St John’s Shopping Centre.
Figure A.7: Map of stop and search activity at LSOA level within Merseyside PFA, year ending March 2026
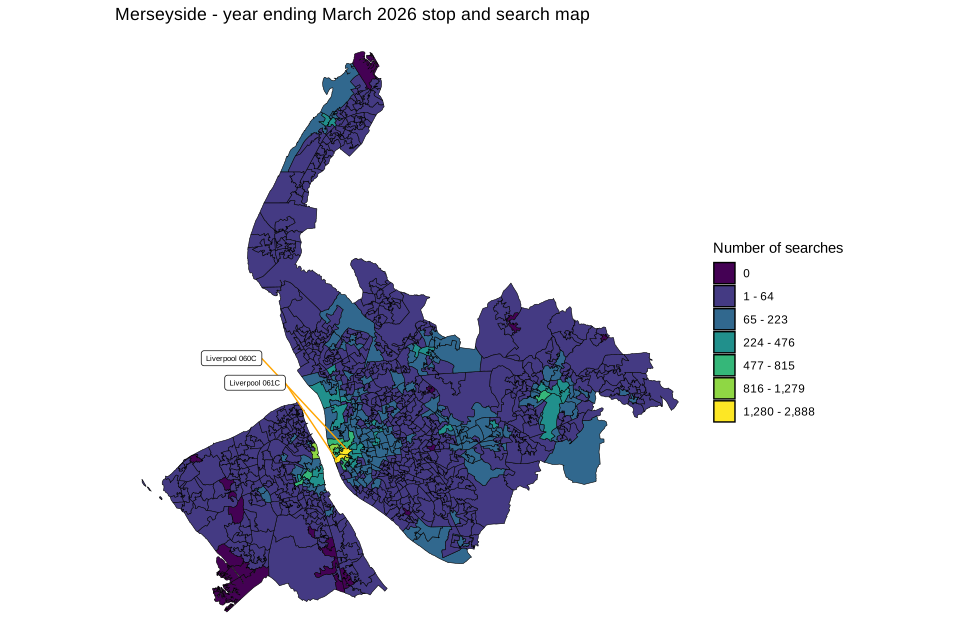
Source: Stop and search data collection, Home Office
Notes:
- Does not include searches undertaken outside Merseyside PFA.
- Approximately 98% of stop and search records submitted to the Home Office by Merseyside in the year ending March 2026 had a valid LSOA within Merseyside PFA.
West Midlands Police
West Midlands PFA was no different to MPS, GMP and Merseyside, with very few or no stop and search activity taking place in the outskirts. In West Midlands, the main hotspot area is in central Birmingham, close to the Bullring shopping centre and Birmingham New Street station, with a secondary hotpot in central Walsall. Approximately 25% of stop and search within West Midlands takes place in just 1.3% of LSOAs within West Midlands, and 50% take place within 7.7%.
Figure A.8: Map of stop and search activity at LSOA level within West Midlands PFA, year ending March 2026
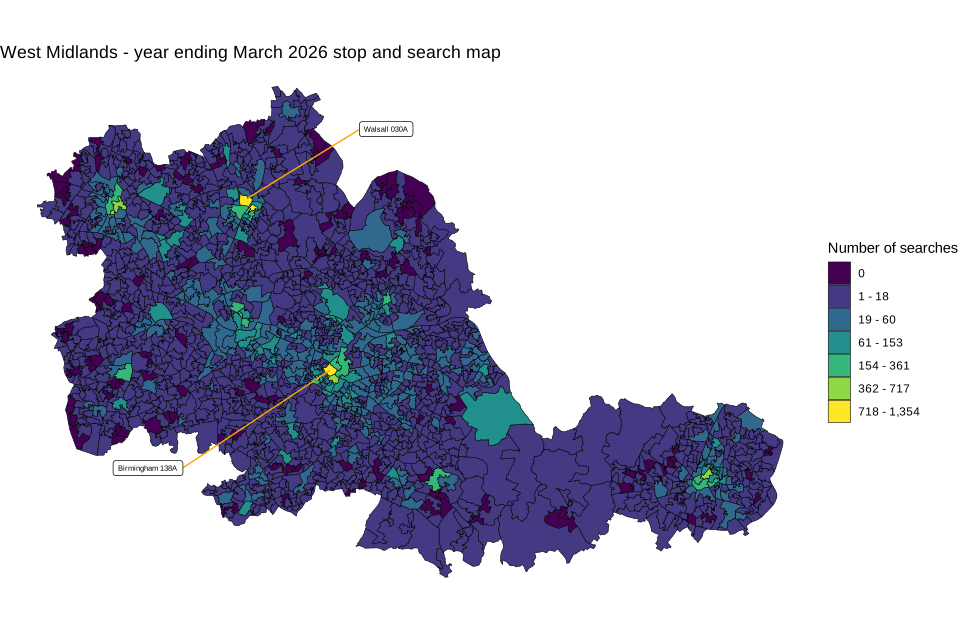
Source: Stop and search data collection, Home Office
Notes:
- Does not include searches undertaken outside West Midlands PFA.
- 100% of stop and search records submitted to the Home Office by West Midlands Police in the year ending March 2026 had a valid LSOA within West Midlands PFA.
Cumbria Police
Although Cumbria is one of the most rural areas of England and Wales and does not contain any urban centres as large as London or Greater Manchester, there are similarities in the way that stop and search activity is distributed throughout Cumbria PFA. The main stop and search hotspots are in the centre of Carlisle, however there are also small areas of higher levels of stop and search in Allerdale and Copeland. Approximately 25% of searches take place in just 2.8% of LSOAs across the PFA, and 50% take place in 9.4% of LSOAs.
Figure A.9: Map of stop and search activity at LSOA level within Cumbria PFA, year ending March 2026
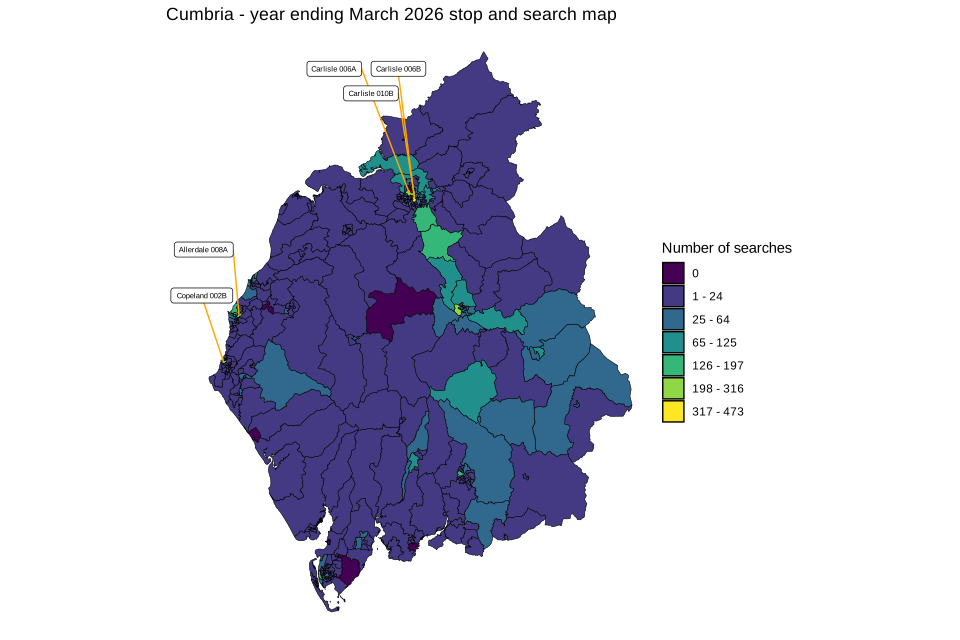
Source: Stop and search data collection, Home Office
Notes:
- Does not include searches undertaken outside Cumbria PFA.
- Approximately 98% of stop and search records submitted to the Home Office by Cumbria Police in the year ending March 2026 had a valid LSOA within Cumbria PFA.
North Yorkshire Police
North Yorkshire is also one of the most rural areas of England and Wales. The main stop and search hotspot areas are in the centres of York, around the Coppergate Shopping Centre, and Scarborough, with little to no stop and searches occurring in the western areas of the PFA, towards the Yorkshire Dales National Park. A quarter of stop and searches take place in just 1.8% of LSOAs, and 50% of stop and searches take place in just 8.2% of LSOAs.
Figure A.10: Map of stop and search activity at LSOA level within North Yorkshire PFA, year ending March 2026
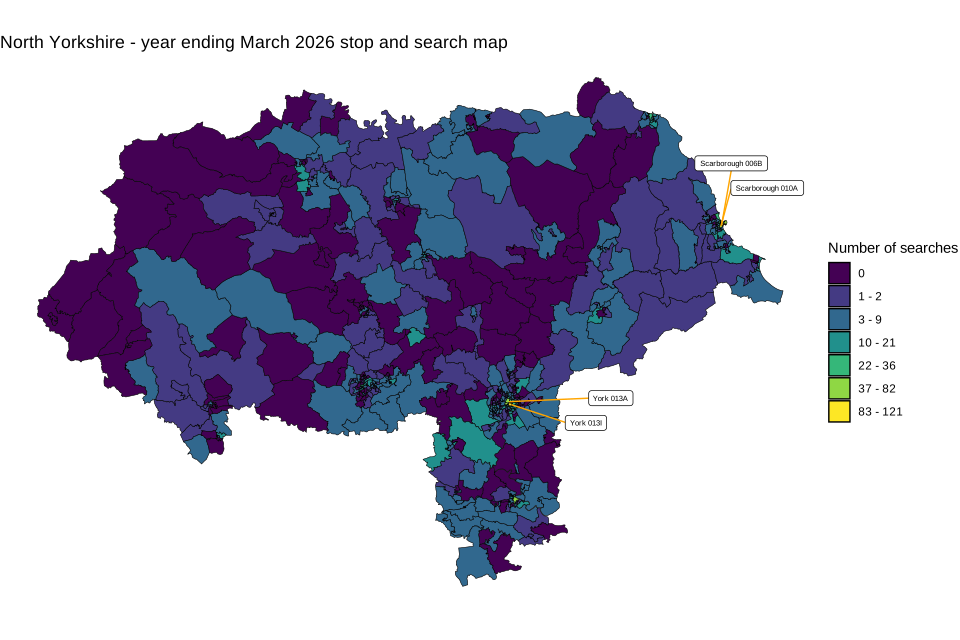
Source: Stop and search data collection, Home Office
Notes:
- Does not include searches undertaken outside North Yorkshire PFA.
- Approximately 96% of stop and search records submitted to the Home Office by North Yorkshire Police in the year ending March 2026 had a valid LSOA within North Yorkshire PFA.
Suffolk Police
A quarter of stop and searches take place in just 1.6% of LSOAs, and 50% of stop and searches take place in just 5.3% of LSOAs. The main hotspot areas are in central Ipswich (Ipswich 007G and Ipswich 006C), which contain the Buttermarket and Sailmakers shopping centres, and account for 11.9% of stop and searches within all of Suffolk between them. Large rural areas of central and northern Suffolk have little to no stop and searches within them.
Figure A.11: Map of stop and search activity at LSOA level within Suffolk PFA, year ending March 2026
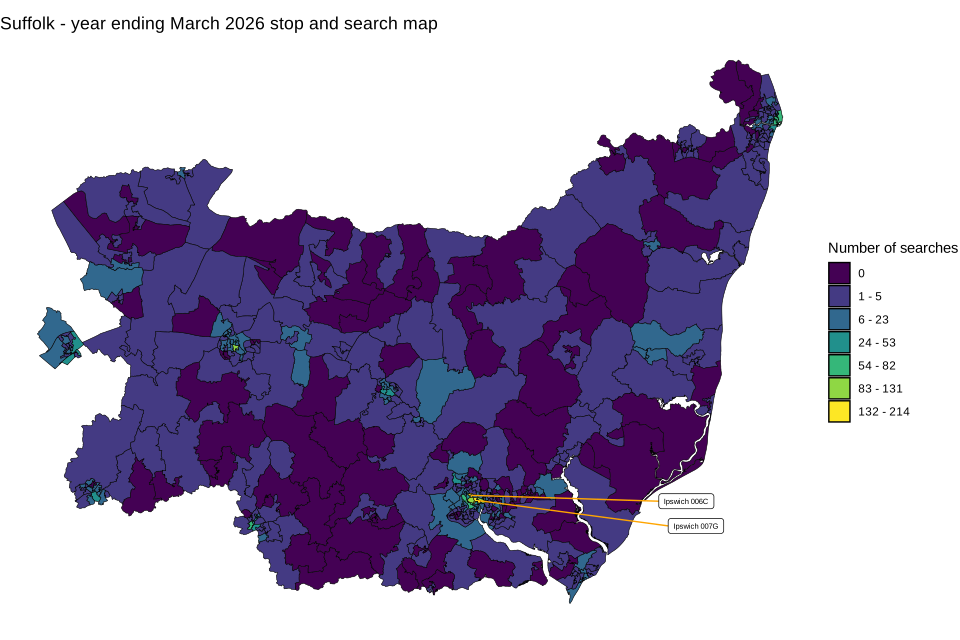
Source: Stop and search data collection, Home Office
Notes:
- Does not include searches undertaken outside Suffolk PFA.
- Approximately 98% of stop and search records submitted to the Home Office by Suffolk Police in the year ending March 2026 had a valid LSOA within Suffolk PFA.
Dyfed-Powys Police
The pattern of stop and search within Dyfed-Powys is similar to rural areas of England, with large areas of little to no stop and search activity. A quarter of stop and searches take place in just 3.3% of LSOAs, and 50% of stop and searches take place in just 10.8% of LSOAs. The main hotspot areas are Carmarthenshire 008A, which contains the central area of Carmarthen, Powys 008A which contains the central area of Newtown and Ceredigion 002B which contains the centre of the town of Aberystwyth.
Figure A.12: Map of stop and search activity at LSOA level within Dyfed-Powys PFA, year ending March 2026
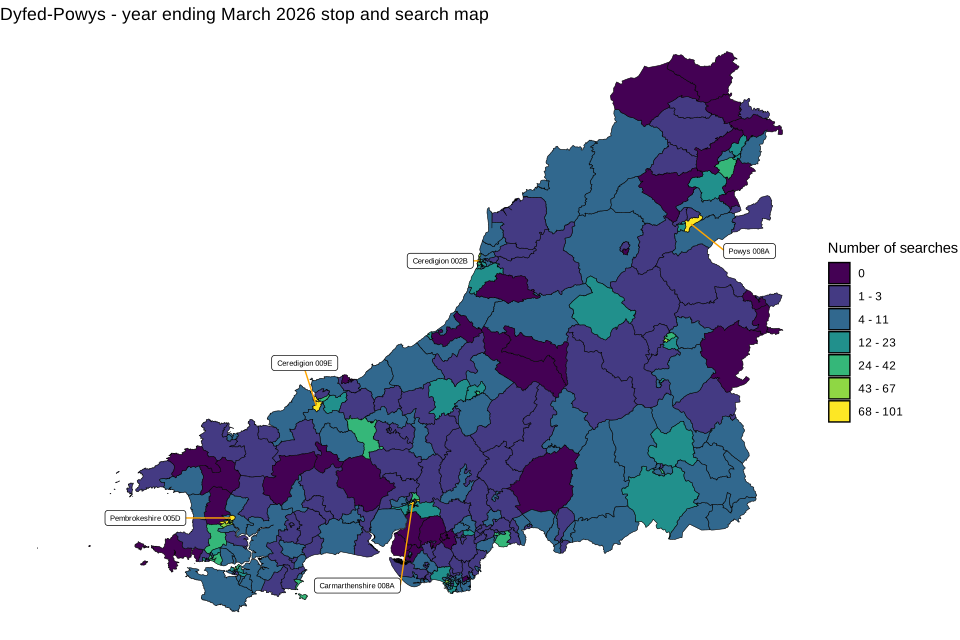
Source: Stop and search data collection, Home Office
Notes:
- Does not include searches undertaken outside Dyfed-Powys PFA.
- Approximately 93% of stop and search records submitted to the Home Office by Dyfed-Powys Police in the year ending March 2026 had a valid LSOA within Dyfed-Powys PFA.
-
The associated legislation includes stop and search powers under section 47 of the Firearms Act 1968, section 23 of the Misuse of Drugs Act 1971, section 43 of the Terrorism Act 2000 as well as other legislation. ↩
-
This is the relative rate of stop and search for an ethnic group compared to the white ethnic group. A fuller explanation can be found in section 2.6.1. ↩
-
This was in part thought to reflect willingness to make more use of such powers as part of the operational response to a rise in knife crime, and encouragement to the police from the then Home Secretary to use stop and search powers. ↩
-
Asian or Asian British group now includes people that identify as Chinese. Previously people who identify as Chinese were grouped as ‘Chinese or Other’. Details on groupings are available at List of ethnic groups. ↩
-
Population data from the 2021 Census, based on whole population. ↩
-
For more information on the Metropolitan Police’s stop and search rates at borough level, see the stop and search dashboard. ↩
-
Includes searches under section 1 PACE, section 60 of the Criminal Justice and Public Order Act 1994, section 342E of the Sentencing Act, section 11 of the Public Order Act and section 47A of the Terrorism Act 2000 (though this power was not used in the year ending March 2025). ↩
-
Based on the resident population of the PFA. Calculated using the mid-2025 population estimates for England and Wales, published by ONS. ↩
-
In some instances, the wider ‘other’ category may be used by forces where the specific type of force used is not known. We will work with forces to improve the quality and consistency of this data in future years. ↩
-
Notifiable offence is any offence where the police must inform the Home Office by completing a crime report form for statistical purposes. Notifiable offences cover all crimes that must or could be heard at a Crown Court and, except for common assaults, does not include summary only offences that are dealt with exclusively by magistrates’ courts. There are strict rules regarding the recording of crime which is outlined in the Home Office counting rules for recorded crime. ↩
-
Using Census 2021 population: Census - Office for National Statistics. ↩
-
Calculated using 2021 Census population for England and Wales. ↩
-
City of London PFA is not included in this analysis, as the small resident population and large transient population within means that rates can be misleading. ↩
-
Uses population estimates from mid-2024. ↩
-
A medically qualified doctor who has been recognised under section 12(2) of the MHA as having specific expertise in the diagnosis and treatment of mental disorder. ↩
-
Source: Table MHA_06. In some years complete data was not received by all forces. Additionally, 10 forces have reported improvements to their data reporting processes over time. Therefore, although general trends are observed, the data is not directly comparable across years. Although the Metropolitan Police’s data is not comparable between the years ending March 2023 and March 2024, this does not account for the decrease in detentions between those years, since the MPS were previously underreporting their data. ↩
-
‘Other’ was removed as an option for method of transport for the year ending March 2024 collection. However, Other made up only 0.7% of cases in the year ending March 2023, so the data is still fairly comparable to previous years. ↩
-
The conditions in the regulations that need to be met for police custody to be used as a place of safety are: 1. The person is aged 18 and above. 2. The behaviour of the adult poses an imminent risk of serious injury or death to that person or others. 3. Because of the risk posed, no place of safety other than a police station can reasonably be expected to detain the adult. 4. So far as is reasonably practicable, a healthcare professional is present and available to the detainee throughout the period in which they are detained at the police station. Further guidance is available in the ‘Guidance on Police Powers’. ↩
-
Data was not provided by Cleveland, Devon and Cornwall, Dorset, Hertfordshire, North Yorkshire, Northamptonshire, Nottinghamshire, Sussex, Warwickshire or Wiltshire police forces. ↩
-
The MPS record section 135 and section 136 data on different data management systems. ↩