Separated families statistics: April 2014 to March 2024
Published 27 March 2025
Applies to England, Scotland and Wales

© Crown copyright 2025
This publication is licensed under the terms of the Open Government Licence v3.0 except where otherwise stated. To view this licence, visit nationalarchives.gov.uk/doc/open-government-licence/version/3 or write to the Information Policy Team, The National Archives, Kew, London TW9 4DU, or email: psi@nationalarchives.gov.uk.
Where we have identified any third party copyright information you will need to obtain permission from the copyright holders concerned.
This publication is available at https://www.gov.uk/government/statistics/separated-families-statistics-april-2014-to-march-2024/separated-families-statistics-april-2014-to-march-2024
This is the latest release of annual statistics on separated families in Great Britain.
This publication contains new estimates covering the financial year ending 2024, as well as some revisions to estimates for the financial year ending 2023. Further information is available in the background information and methodology note.
The next release is planned for March 2026.
1. Introduction
This publication uses the Family Resources Survey (FRS) and Households Below Average Income (HBAI) data. It provides new statistical estimates relating to separated families and their child maintenance arrangements for the financial year ending 2024.
In this period:
-
the FRS achieved sample was just under 17,000 household
-
survey fieldwork operations used face-to-face interviewing as the predominant way of completing the survey
Users are still advised to exercise caution when using data from the survey years ending 2021 and 2022, especially when comparing these to other survey years. More details on how the results for these years were affected by the COVID-19 pandemic, can be found in the FRS 2021 to 2022 Background Information and Methodology document. The effects of COVID-19 on HBAI data and statistics are available in the HBAI methodology report.
These statistics provide estimates of the following:
-
the number of separated families in Great Britain and the number of children in those families
-
the proportion of separated families with a child maintenance arrangement and whether this arrangement is statutory or non-statutory
-
the total amount of child maintenance received by parents with care, by arrangement type
-
the net impact of child maintenance payments on the number of children in low-income households
-
characteristics of separated parents and the impacts of child maintenance payments on where their households are represented in the income distribution.
This release includes the following additional estimates of the characteristics of parents with care and non-resident parents, by child maintenance arrangement type:
-
gender
-
age
-
reported disability status
-
ethnic group
-
marital status
This release also contains revisions to data for the 2022 to 2023 financial year. The following tables are affected:
-
Table 2: The proportion of separated families with a child maintenance arrangement
-
Tables 6-9: The position of separated parent households in the Great Britain income distribution
-
Table 10: The percentage of children in parent with care households who remain in low income after child maintenance payments
These changes result from two factors:
1. Use of a new question response in the survey to help inform which parents have non-statutory arrangements; and
2. A revision to income data for 2022 to 2023 due to the exclusion of one element of the low- income benefits and tax credits Cost of Living Payment.
Further details on the revisions set out above are provided in the background information and methodology note.
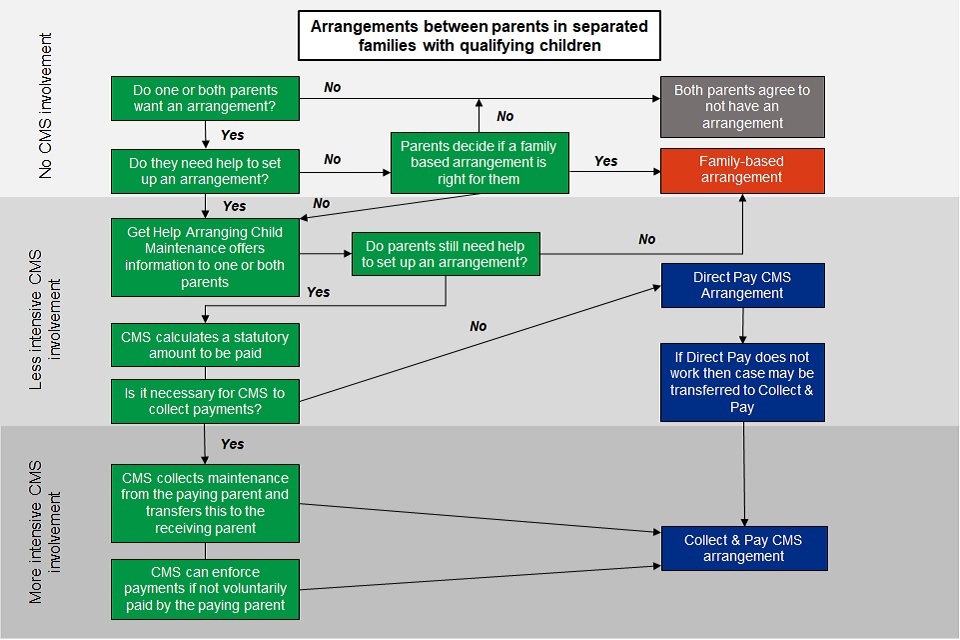
It should be noted that there is no requirement for separated families to have a child maintenance arrangement and some families may not want an arrangement. If parents do want an arrangement, they may be able to agree this themselves without the involvement of the Child Maintenance Service (CMS). Arrangements made in this way are called non-statutory arrangements or ‘family-based arrangements’. Where parents want an arrangement but need help with this, support is available through the digital service ‘Get Help Arranging Child Maintenance’.
2. Main stories
In the latest financial year ending 2024, it is estimated that:
-
there were 2.5 million separated families in Great Britain and 4 million children in those separated families
-
63% of separated families had a child maintenance arrangement
In the three-year period covering the financial years ending 2022 to 2024, it is estimated that:
-
parents with care in separated families received a total of £2.9 billion annually in child maintenance payments
-
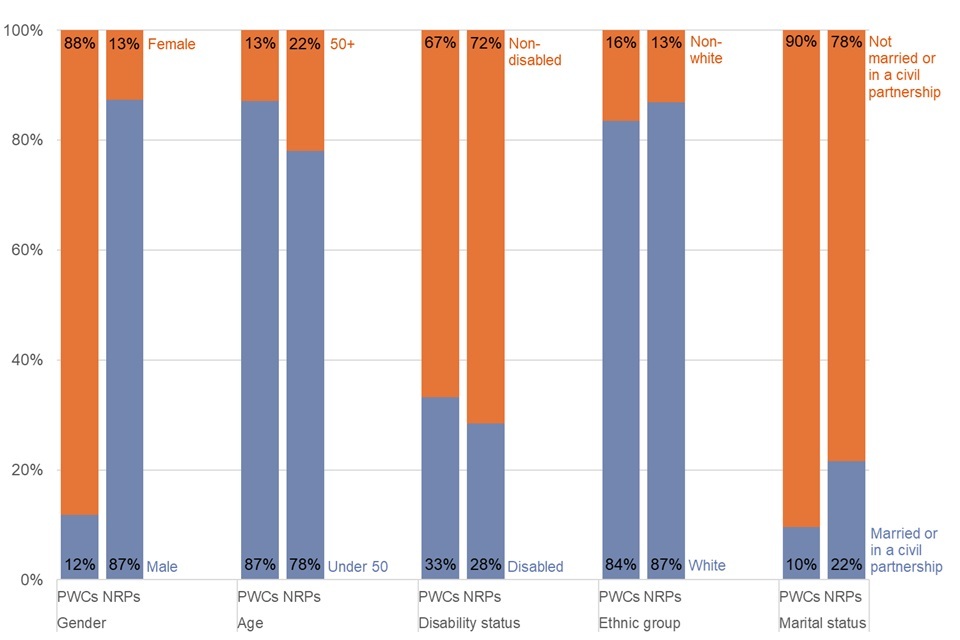
88% of parents with care were female, 87% were under the age of 50, 33% were disabled, 84% were white and 10% were married or in a civil partnership
-
87% of non-resident parents were male, 78% were under the age of 50, 28% were disabled, 87% were white and 22% were married or in a civil partnership
-
child maintenance payments reduced the number of children living in low-income households annually. Overall, as a result of these payments, 120,000 children were kept out of relative low income on an after housing costs basis, and 140,000 children were kept out of absolute poverty on an after housing costs basis
-
of the 120,000 children kept out of relative low income each year on an after housing costs basis:
-
40,000 were in households with a statutory arrangement
-
100,000 were in households with a non-statutory arrangement; while
-
20,000 children in non-separated families were moved into relative low income due to the redistributive effects of child maintenance across the wider income distribution, although they neither paid nor received child maintenance
-
-
child maintenance receipts reduced the percentage of individuals in parent with care households who are in the lowest 20% of the after housing costs income distribution by two percentage points
-
child maintenance payments reduced the percentage of individuals in non-resident parent households who are in the highest 40% of the after housing costs income distribution by three percentage points;
-
The income distributions of parent with care households:
-
with no arrangement tend to be heavily skewed towards the bottom of the Great Britain income distribution
-
with a statutory or a non-statutory arrangement also tend to be skewed towards the bottom of the distribution, but to a slightly lesser extent
-
-
The income distributions of non-resident parent households:
-
with a statutory arrangement or no arrangement tend to be skewed towards the bottom of the Great Britain income distribution
-
with a non-statutory arrangement tend largely to be more evenly distributed across the income distribution; and
-
-
The percentage of children in parent with care households who remain in relative low income after housing costs and after child maintenance is 37% for children in households with a statutory arrangement, 37% for children in households with a non-statutory arrangement, and 51% for children in households with no arrangement.
3. What you need to know
Parent with care
A parent with care is the parent who has sole or main day-to-day care of any relevant children and who may potentially be eligible to receive child maintenance.
Non-resident parent
A non-resident parent is the parent who does not have sole or main day-to-day care of any relevant children and who may be required to pay child maintenance.
Separated family
A separated family is defined as one parent with care, one non-resident parent and any biological or adopted children they have between them who are either under 16 or under 20 and in full-time non-tertiary education.
Child maintenance arrangement
There are two main types of child maintenance arrangement: statutory arrangements and non-statutory arrangements (see below). Separated families may have more than one type of arrangement.
Statutory child maintenance arrangements
Statutory child maintenance arrangements are those which have been arranged with the help of the Child Maintenance Service (CMS).
Non-statutory arrangements
Non-statutory arrangements include all other arrangements such as:
-
voluntary financial arrangements which involve direct monetary payments between parents where the CMS have not been involved
-
voluntary non-financial arrangements involving payments in kind
-
other types of arrangements including shared care arrangements
-
court orders requiring parents to make financial payments
Get Help Arranging Child Maintenance
Get Help Arranging Child Maintenance is a digital service for child maintenance applications and information about the choices available to parents to either make their own (non-statutory) arrangement or use the CMS. This service replaced the Child Maintenance Options service from 1 April 2022.
Child Maintenance Service (CMS)
The CMS was introduced in December 2012. It replaced the Child Support Agency (CSA) and is for separated parents who cannot arrange child maintenance between themselves. Parents can ask the CMS to calculate the amount of maintenance to be paid and, if necessary, to help manage and collect payments. Since the end of 2018, all CSA cases with on-going liabilities closed. Parents now have the option of setting up a statutory arrangement with the CMS, a non-statutory, family-based arrangement, or choosing not to have an arrangement at all.
Disability
The definition of disability used in this publication is consistent with the core definition of disability under the Equality Act 2010. A person is considered to have a disability if they “have a physical or mental impairment that has a ‘substantial’ and ‘long-term’ negative effect on their ability to do normal daily activities”. Whereby ‘substantial’ means more than minor or trivial, and ‘long-term’ means 12 months or more.
Ethnic group
The ethnic group to which respondents consider that they belong. Ethnicity representation rates are now calculated from known declarations and exclude ‘choose not to declare’ and ‘unknown’. Around 0.1% of separated parents within the survey did not declare their ethnic group for the financial years ending 2022 to 2024.
Due to smaller sample sizes, this publication has condensed “Asian or Asian British”, “Indian”, “Pakistani”, “Bangladeshi”, “Chinese” and “Any other Asian Background” into the group “Asian/Asian British”. “Other ethnic group” includes respondents who selected “Arab”.
Marital status
This is the person’s de facto marital status:
-
married or civil partnership: currently married or in a civil partnership, and not separated from spouse (excludes temporary absences)
-
cohabiting: not married nor in a civil partnership, but living as a couple
-
single: is not currently cohabiting and has never been married nor in a civil partnership
-
widowed: widowed and not currently cohabiting
-
separated: married or in a civil partnership, but separated from spouse and is not currently cohabiting
-
divorced or civil partnership dissolved: marriage or civil partnership legally dissolved and is not currently cohabiting
Due to smaller sample sizes, this publication has included the “widowed” group with the “single group”.
Equivalised household income
If a household’s income is equivalised, it means that it has been adjusted for household size and composition to make it comparable with other household incomes.
Low income
A household is said to be in relative low income if their equivalised income is below 60% of median household income, while they are said to be in absolute low income if their equivalised income is below 60% of the median household income adjusted for inflation for the financial year ending 2011. For comparative purposes, both relative and absolute low income are estimated before and after taking housing costs into account.
Income deciles and quintiles
In this publication deciles divide the population, when ranked by equivalised household income, into ten equal sized groups, and are indicated by 1 to 10, while quintiles divide the population into five groups.
Income distribution
This shows how equivalised household income is shared throughout a population. Comparisons to the equivalised household income percentiles of a reference population allow the income distributions of different groups to be compared. In this publication we show the distribution of equivalised household incomes of individuals in parent with care and non-resident parent households relative to the equivalised household income quintiles of all individuals in Great Britain.
4. Separated families and their child maintenance arrangements
It is estimated that in the financial year ending 2024, there were approximately 2.5 million separated families in Great Britain, including 4 million children in those separated families. These estimates represent increases of 0.1 million in the number of separated families and 0.2 million in the number of children in separated families since the financial year ending 2023.
Changes over the latest three years in the number of separated families reflect trends in lone parent estimates seen in the Labour Force Survey (LFS)[footnote 1]. The changes in the number of children in separated families reflect both the changes in estimated numbers of separated families and trends in the estimated number of children in each separated family.
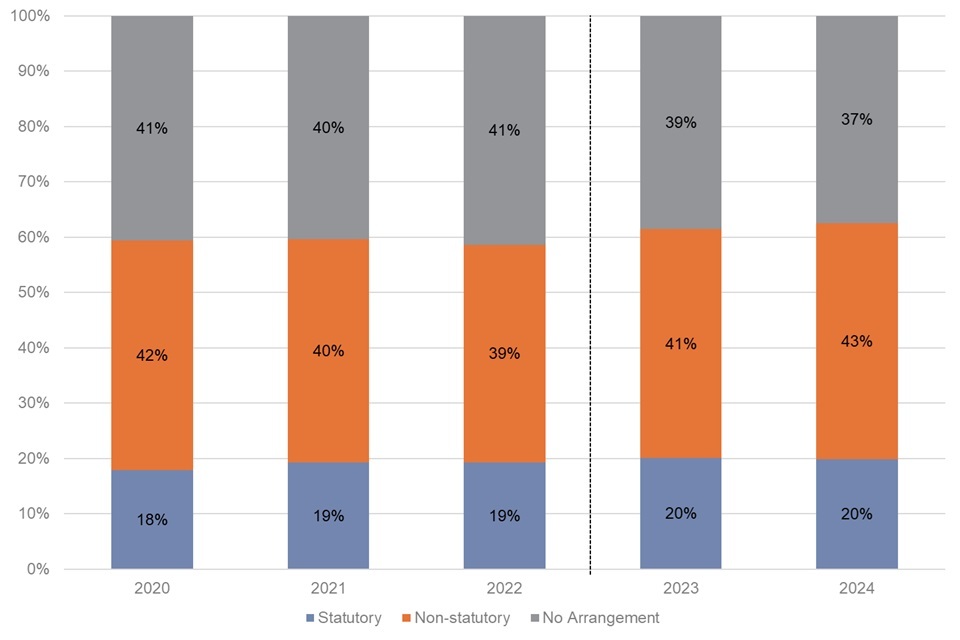
In the financial year ending 2024, 63% of separated families had a child maintenance arrangement. Around two thirds of these were non-statutory arrangements and around one third were statutory arrangements. Estimates for the proportions of separated families with non-statutory or no child maintenance arrangements in the financial year ending 2023 have been revised from the previous publication. The proportion of separated families with a statutory arrangement has not changed since the financial year ending 2023, while the proportion of separated families with a non-statutory arrangement has increased by two percentage points. This reflects the change in measurement of non-statutory arrangements, with a new question response in the survey allowing the inclusion of more arrangements where there is sharing of care between separated parents. Further details on these revisions are provided in the background information and methodology note. Since the financial year ending 2020, there has been a two percentage point increase in the proportion of separated families with a statutory arrangement and a one percentage point increase in the proportion of separated families with a non-statutory arrangement.
The percentage of separated families reporting a child maintenance arrangement has increased slightly since the financial year ending 2020
Separated families by child maintenance arrangement type, for the financial years ending 2020 to 2024
Sources: FRS and CMS administrative database (see the accompanying tables for full data).
Notes about these statistics:
1. Totals may not sum to 100% due to rounding. Percentages are calculated using figures prior to rounding and are rounded to the nearest integer.
2. Figures relating to the financial year ending 2024 are new and shown for the first time in this publication. Figures from the financial year ending 2023 in the accompanying tables have been revised due to a methodological change. As a result, for the financial year ending 2023, the proportion of separated families with any arrangement has been increased by two percentage points, the proportion with a non-statutory arrangement has been increased by two percentage points, and the proportion with no arrangement has been decreased by two percentage points. Further details on these revisions are provided in the background information and methodology note.
3. For simplicity, parents who have both statutory and non-statutory arrangements are included in the statutory arrangement group. (See the accompanying tables for full data).
4. Measures of uncertainty to assess statistical significance of year on year changes are currently unavailable, but are being explored for future publications. As a result of COVID-19, sample sizes are smaller and estimates are expected to be more uncertain than usual in the financial years ending 2021 and 2022. Users should interpret results with care, particularly across these years.
Parents with care are female in the majority of cases, less likely to be aged 50 or older, more likely to be disabled, and less likely to be married or in a civil partnership than non-resident parents.
The characteristics of parents with care and non-resident parents, for the financial years ending 2022 to 2024
Sources: FRS; CMS administrative data. See the accompanying tables for full data.
Notes about these statistics:
1. The number of non-resident parents that we find on the FRS is lower than expected when comparing to the number of parents with care. Non-resident parents with no arrangement are particularly underrepresented in the FRS when compared with parents with care. This may drive some of the differences in the characteristic breakdowns for parents with care and non-resident parents. Further information is available in the background information and methodology note.
2. There is also a known effect where non-resident parents and parents with care have differing opinions on whether they have a child maintenance arrangement. For example, a non-resident parent may consider that they have a non-statutory arrangement while the parent with care may think that the agreement they have with their ex-partner is insufficient to qualify as an arrangement at all. These factors can lead to some discrepancies when comparing non-resident parents and parents with care of the same arrangement type.
Further analysis of characteristics by arrangement type is available in the publication tables. Among other things, the analysis highlights that those with no arrangement are more likely to have characteristics protected under the Equality Act 2010, including:
-
separated parents with no arrangement are more likely to be aged 50+ than those with other arrangement types
-
non-resident parents with no arrangement are more likely to be disabled than non-resident parents with other arrangement types
-
separated parents with no arrangement are more likely to be non-white than those with other arrangement types.
5. The impact of child maintenance payments on the number of children in low-income households
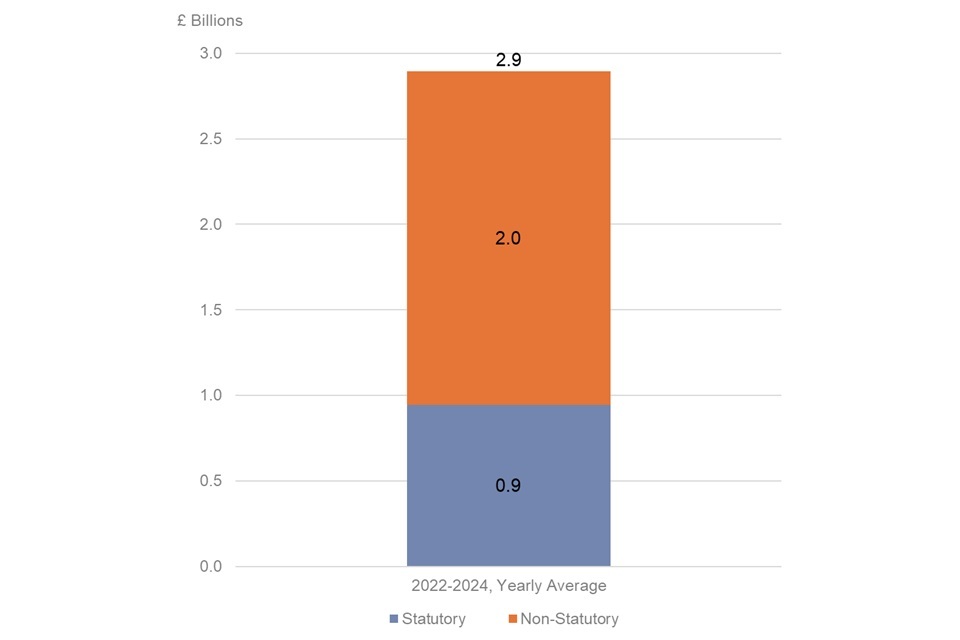
On average, it is estimated that £2.9 billion in child maintenance payments was received each year by parents with care in separated families in the financial years ending 2022 to 2024. Around 67% of these payments related to non-statutory child maintenance arrangements, with around 33% related to statutory arrangements.
The majority of child maintenance payments relate to non-statutory arrangements
The total amount of child maintenance received by parents with care, by arrangement type for the financial years ending 2022 to 2024
Sources: FRS; CMS administrative data. See the accompanying tables for full data.
Notes about these statistics:
1. Totals may not sum due to rounding.
2. Child maintenance receipts for each year are converted to 2024 prices before averaging receipts over the three financial years.
Child maintenance payments reduced the net number of children living in low-income households. Overall, 120,000 children were kept out of low income on the relative low income after housing costs measure, and 140,000 children were kept out of low income on the absolute low income after housing cost measure. Most of this impact related to single parent families.
Table 1: The annual impact of child maintenance payments on the number of children in low-income households, for the financial years ending 2022 to 2024
| Definition of low income | Net impact on the number of children in low-income households (thousands) |
|---|---|
| Relative low income (before housing costs) – below 60% of contemporary median household income | -120 |
| Relative low income (after housing costs) – below 60% of contemporary median household income | -120 |
| Absolute low income (before housing costs) – below 60% of median household income in the financial year ending 2011 held in constant real terms | -140 |
| Absolute low income (after housing costs) – below 60% of median household income in the financial year ending 2011 held in constant real terms | -140 |
Source: FRS; HBAI data. See the accompanying tables for full data.
Notes about Table:
- Estimates are rounded to the nearest 20,000.
During the financial year ending 2021, relatively large numbers of children were kept out of low-income following child maintenance payments due to the economic impacts of COVID-19 and the government response to its impacts. From this publication, the financial year ending 2021 is no longer one of the years included in these three-year average statistics, contributing to the reduction in the number of children kept out of low-income following child maintenance payments.
During the financial year ending 2022, the UK economy and labour market were recovering from the COVID-19 pandemic and the restrictions introduced in response to it and there was a gradual reversal of COVID-19 effects that will have influenced the incomes of separated families.
The impact of statutory and non-statutory child maintenance arrangements on numbers of children in low-income households roughly reflects the proportion of these arrangement types
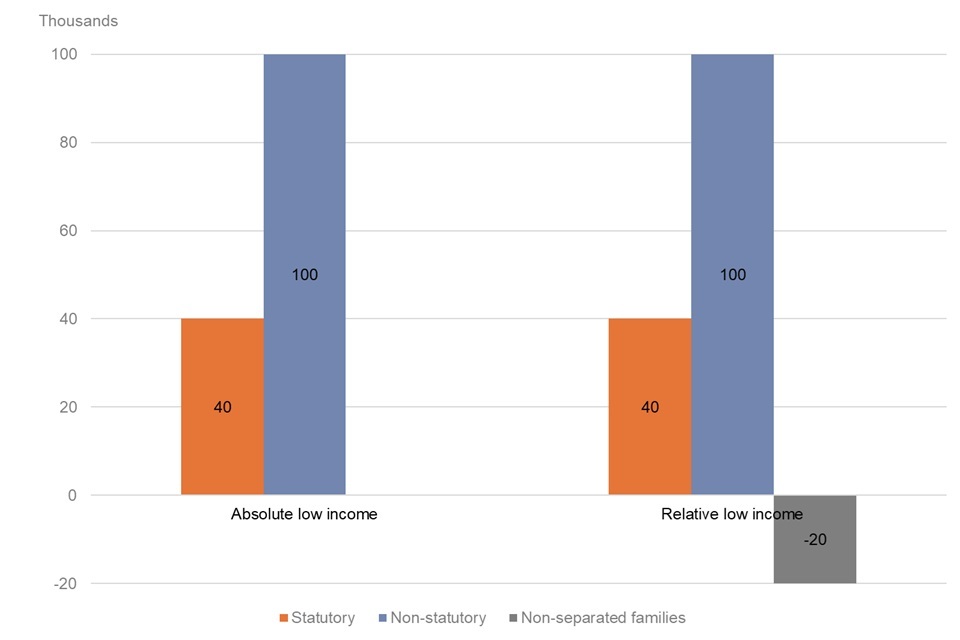
The annual impact of child maintenance payments on the net number of children in low-income households, after housing costs, by child maintenance arrangement type, for the financial years ending 2022 to 2024
Source: FRS; HBAI data. See the accompanying tables for full data.
Of the 140,000 children kept out of absolute low income on an after housing costs basis, around 40,000 were in households with a statutory arrangement and 100,000 in households with a non-statutory arrangement. Of the 120,000 children kept out of relative low income on an after housing costs basis, around 40,000 were in households with a statutory arrangement and 100,000 in households with a non-statutory arrangement. 20,000 children in non-separated families were moved into relative low income due to the redistributive effects of child maintenance across the wider income distribution, although they neither pay nor receive child maintenance.
Children in separated families with a child maintenance arrangement are less likely to remain in low income than those without an arrangement
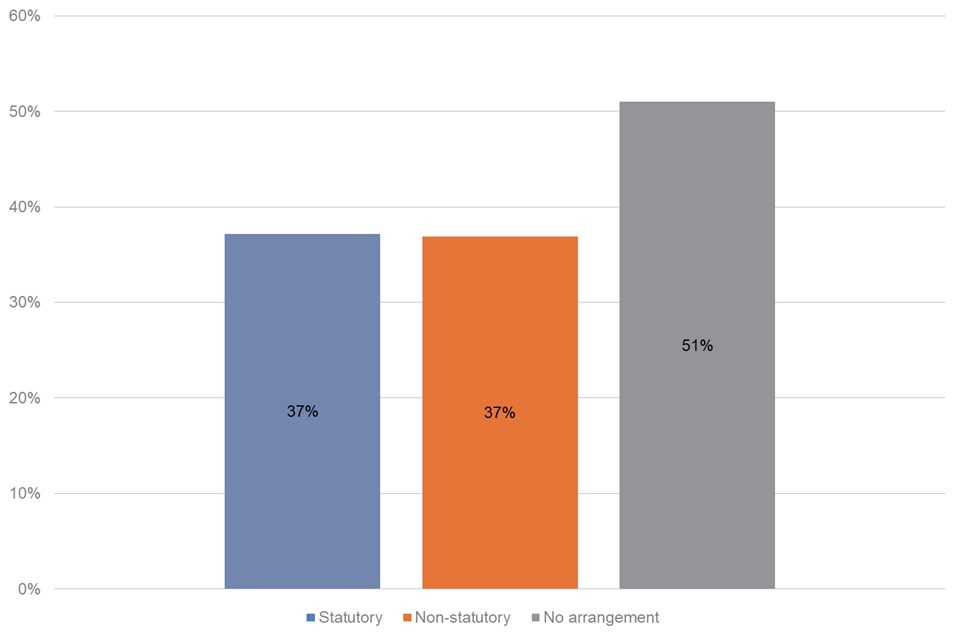
The percentage of children in parent with care households who remain in relative low income after housing costs and child maintenance payments, by child maintenance arrangement type, for the financial years ending 2022 to 2024
Source: FRS; HBAI data. See the accompanying tables for full data.
The percentage of children in parent with care households who remain in relative low income after housing costs and after child maintenance is lower for those with child maintenance arrangements, with 37% of children in households with a statutory or non-statutory arrangement remaining in low income, compared with 51% of children in households with no arrangement.
6. Estimates of the position of separated parent households in the Great Britain income distribution (and where they would be had they not paid or received child maintenance)
Considering an after housing costs basis, the equivalised incomes of individuals in non-resident parent households are more evenly spread across the equivalised income distribution for Great Britain compared with parent with care households. The equivalised income distribution of individuals in parent with care households is more skewed towards the lowest income quintiles. This situation remains largely unchanged even after child maintenance has been paid from the non-resident parent to the parent with care.
Child maintenance payments are broadly redistributive
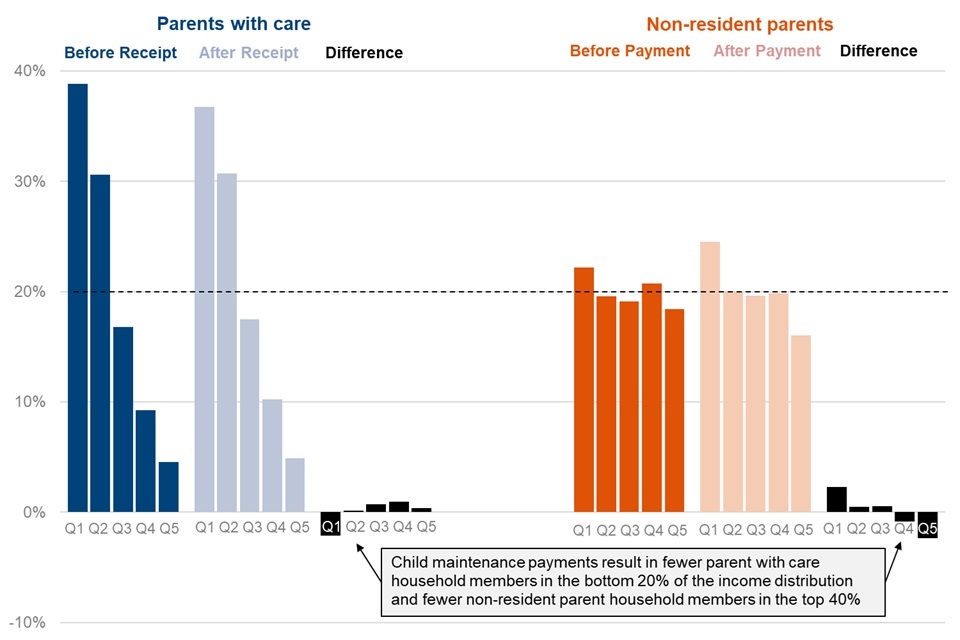
Position of parent with care and non-resident parent households in the Great Britain income distributions before and after child maintenance, after housing costs, for the financial years ending 2022 to 2024.
Source: FRS; HBAI; CMS data. See the accompanying tables for full data.
Notes about these statistics:
- In an even distribution, each quintile would equal 20% of the population. Quintiles containing more than 20% of the population show that the population is overly represented in that part of the income distribution. For instance, a value of 39% in Q1 for parents with care before child maintenance means that 39% of this group are in the bottom 20% of the income distribution.
After child maintenance has been paid, we estimate that the percentage of individuals in parent with care households in the bottom quintile is two percentage points lower and the proportion of individuals in non-resident parent households in the top two quintiles is three percentage points lower. While child maintenance payments result in a two percentage point rise in the proportion of individuals in non-resident parent households in the lowest quintile to 24%, over a third (37%) of individuals in parent with care households remain in the lowest quintile, even after child maintenance is received.
For all arrangement types, parent with care equivalised household incomes are more skewed towards the bottom of the income distribution than their non-resident parent counterparts
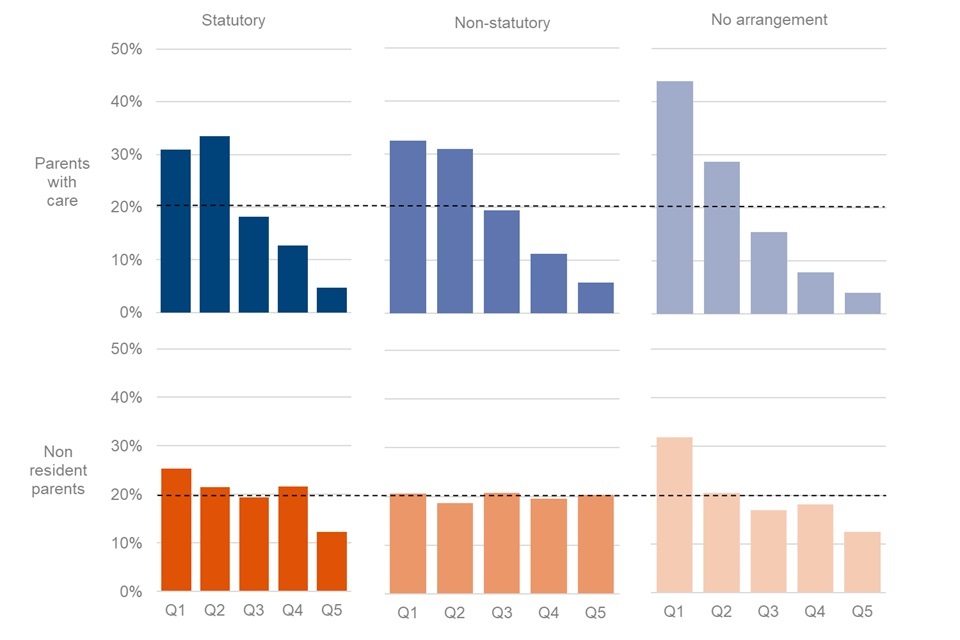
Position of parent with care and non-resident parent households in the Great Britain income distributions, after housing costs and after child maintenance, by arrangement type, for the financial years ending 2022 to 2024.
Source: FRS; HBAI; CMS data. See the accompanying tables for full data.
The income distributions of parent with care households:
-
with no arrangement tend to be heavily skewed towards the bottom of the Great Britain income distribution after housing costs and after child maintenance, with 73% in the bottom 40%
-
with statutory and non-statutory arrangements also tend to be skewed towards the bottom of the distribution, but to a slightly lesser extent
The income distributions of non-resident parent households:
-
with a statutory arrangement or no arrangement tend to be skewed towards the bottom of the Great Britain income distribution
-
with a non-statutory arrangement tend largely to be evenly distributed across the Great Britain income distribution
7. About these statistics
These statistics are classed as ‘official statistics’ and are produced in line with the principles of the Code of Practice for Statistics.
Our statistical practice is regulated by the Office for Statistics Regulation (OSR). OSR sets the standards of trustworthiness, quality and value in the Code of Practice for Statistics that all producers of official statistics should adhere to.
We publish these statistics on an annual basis and will continue to expand their scope to help to meet user needs where reliable estimates can be obtained.
These Great Britain–level statistics are estimates based primarily on data from the Family Resources Survey (FRS). The FRS is based on a representative sample of private households, historically comprising around 20,000 United Kingdom (UK) households. The achieved sample for the financial year ending 2024 was just under 17,000 households.
This is lower than the achieved sample in financial year ending 2023 when around 25,000 UK households were interviewed, following a sample boost. The achieved sample for the financial year ending 2022 was smaller at around 16,000 UK households.
In addition to the sample size reductions, the composition of the FRS achieved sample changed during the financial year ending 2022. The telephone interview approach, that was adopted during the financial year ending 2021, continued throughout the financial year ending 2022; and as such some of the biases seen in the previous year remained. The grossing regime was adjusted to improve the representativeness of the sample in this year, but some unknown biases remained.
During the financial years ending 2023 and 2024, survey fieldwork operations returned to face-to-face interviewing as the preferred method of data collection. Consequently, we now have enhanced confidence in data quality, but we continue to advise users to be aware of the potential effects of coronavirus (COVID-19) pandemic on both the survey and individual circumstances, and to interpret results with care. In particular, assessments of observed changes in the data should be made compared with both the financial year ending 2023 and with pre-pandemic trends and estimates.
More information can be found in the Separated Families Statistics background information and methodology note and the FRS Background Information and Methodology.
The FRS is a continuous survey which collects information on the income, characteristics and circumstances of individuals living in a representative sample of private households in the UK. FRS respondents are asked about the relationships within their household and any child maintenance arrangements they may have. Their responses are used to determine whether they are members of a separated family, how many children are in that family, the types of child maintenance arrangements they have (if any) and the amount of maintenance they receive.
Where feasible and appropriate, FRS responses regarding child maintenance arrangements are checked for accuracy against the DWP’s CMS, and historically against CSA, administrative databases and amended in line with the administrative data.
Estimates of the total amount of child maintenance payments received by parents with care are based on a combination of administrative data and adjusted FRS data.
The HBAI methodology and data, together with FRS information on child maintenance payments, are used to obtain estimates of:
-
the impact of child maintenance payments on the net number of children in low-income households
-
the percentage of children who remain in low income after child maintenance
-
the position of separated parent households in the Great Britain income distribution.
During 2022 to 2023 the government announced and implemented additional support to families with several cost-of-living support schemes, depending on peoples’ circumstances. These payments continue to be included in the estimates of separated families’ incomes for this publication covering the 2023 to 2024 financial year.
More information about the methodology used to produce these statistics and its limitations can be found in the accompanying background information and methodology note.
Rounding
Figures are rounded to the nearest 100,000, except those relating to the impact of child maintenance payments on the number of children in low-income households which are rounded to the nearest 20,000. Monetary amounts are rounded to the nearest hundred million pounds. Percentages are calculated using figures prior to rounding and are rounded to the nearest integer. Totals may not sum due to rounding.
Changes made to this publication
In the release for the financial year ending 2023, one element of the low-income benefits and tax credits Cost of Living Payment was not included, which has impacted on some data tables and text on GOV.UK. Impacts are small, making a difference of up to a single percentage point either way, compared to the previous figures. Revised income data for the financial year ending 2023 is included in this publication. The following tables have been affected:
-
Tables 6a and 6b: The position of separated parent households in the Great Britain income distribution
-
Tables 7a and 7b: The position of separated parent households with a statutory arrangement in the Great Britain income distribution
-
Tables 8a and 8b: The position of separated parent households with a non-statutory arrangement in the Great Britain income distribution
-
Tables 9a and 9b: The position of separated parent households with no arrangement in the Great Britain income distribution
In addition, changes made to the FRS questionnaire from the financial year ending 2023 provided an opportunity to identify additional parents with care with non-statutory arrangements, specifically those comprised only of shared care. Small numbers of parents with care, who were previously classified as having no child maintenance arrangement, are now classified as having non-statutory arrangements. These changes were not incorporated into the analysis for the separated families statistics for the financial year ending 2023, but have since been incorporated into this publication’s methodology. These changes have also been retrospectively applied to data for the financial year ending 2023. Similar changes have been included for non-resident parents, although the impact is much smaller. The following tables have been affected:
-
Table 2: The proportion of separated families with a child maintenance arrangement. As a result of these revisions, in the financial year ending 2023, the proportion of separated families:
-
with any arrangement has increased by two percentage points;
-
with a non-statutory arrangement has increased by two percentage points; and
-
with no arrangement has decreased by two percentage points
-
-
Tables 8a and 8b: The position of separated parent households with a non-statutory arrangement in the Great Britain income distribution. Impacts are small, making an absolute difference of a single percentage point at most
-
Tables 9a and 9b; The position of separated parent households with no arrangement in the Great Britain income distribution. Impacts are small, making an absolute difference of a single percentage at most
-
Table 10: The percentage of children in parent with care households who remain in low income after child maintenance payments. Impacts are small, making an difference of a single percentage point at most.
More information on revisions and methodological changes can be found in the accompanying background information and methodology note.
Planned changes
Estimates are based primarily on data from the FRS. For information on FRS developments refer to the FRS Release Strategy.
Any future revisions will be notified via the Separated Families Collection Pages and also in the DWP Statistical Work Programme and clearly indicated and explained in the relevant publication.
8. Where to find out more
More information about these statistics can be found in the accompanying Background information and methodology note and accompanying tables.
Official statistics on the statutory child maintenance arrangements administered by the Child Maintenance Service.
Experimental statistics on the Child Support Agency’s 1993 and 2003 statutory child maintenance schemes and on Child Support Agency case closure.
More information about the Child Maintenance Service.
Experimental statistics on the child maintenance arrangements made by parents who contacted Child Maintenance Options.
More information about the Family Resources Survey.
More information about the Households Below Average Income.
Feedback
Users are invited to send feedback on these statistics to: cm.analysis.research@dwp.gov.uk
ISBN number: 978-1-78659-823-3
-
Up to the financial year ending 2023, Labour Force Survey (LFS) estimates of lone parent numbers were used as control totals in the process of applying weights to FRS sample data so that they yielded estimates for the overall population. In the financial year ending 2024, the FRS has used a projection based on previous years’ LFS data to arrive at a control total of 1.9 million lone parents. This approach was taken due to increasing uncertainty in the LFS estimates for the financial year ending 2024. Further details on the methodology are provided in the FRS background information and methodology note. ↩