Seasonal influenza vaccine uptake in GP patients in England: winter season 2025 to 2026
Published 28 May 2026
Applies to England

© Crown copyright 2026
This publication is licensed under the terms of the Open Government Licence v3.0 except where otherwise stated. To view this licence, visit nationalarchives.gov.uk/doc/open-government-licence/version/3 or write to the Information Policy Team, The National Archives, Kew, London TW9 4DU, or email: psi@nationalarchives.gov.uk.
Where we have identified any third party copyright information you will need to obtain permission from the copyright holders concerned.
This publication is available at https://www.gov.uk/government/statistics/seasonal-influenza-vaccine-uptake-in-gp-patients-winter-season-2025-to-2026/seasonal-influenza-vaccine-uptake-in-gp-patients-in-england-winter-season-2025-to-2026
This report describes the final end of season influenza vaccine uptake data for GP-registered patients in England for 2025 to 2026 (1 September 2025 to 28 February 2026).
During the 2025 to 2026 season, for the second time adult groups (excluding pregnant women) were eligible from 1 October, rather than 1 September as in seasons prior to 2024 to 2025. Therefore, data for those aged 65 years and over, and those aged under 65 years in clinical risk groups is comparable with the previous season (2024 to 2025), but not directly comparable to seasons prior to that. As in previous seasons, children and pregnant women were eligible from 1 September (further information can be found in Background information).
The 2025 to 2026 annual flu letter outlines the national vaccine uptake ambitions which were to demonstrate a 100% offer of vaccination to eligible groups and to achieve equal or above the uptake levels of 2024 to 2025 for each group.
Main points
The extrapolated number of GP-registered patients that were recorded as vaccinated in the 2025 to 2026 season was over 18.8 million.
Older adults
Cumulative vaccine uptake in GP-registered older adults in 2025 to 2026:
- was 74.5% for those aged 65 years and over, compared with 74.9% in 2024 to 2025
- was 0.5 percentage points below the World Health Organization (WHO) vaccine uptake target of 75.0%. As this is fewer than 1 percentage point difference to the previous season this is considered comparable to the previous season
- achieved the ambitions of equivalent (or higher) uptake this season than in the previous season (0.4 percentage points lower)
- was reported for the first time this season broken down as those aged 65 to under 75 years (68.1%); and 75 years and over (81.1%)
Clinical risk groups
Cumulative vaccine uptake in GP-registered clinical risk groups in 2025 to 2026:
- was 40.6% for those aged 6 months to under 65 years in one or more clinical risk groups, compared with 40.0% in 2024 to 2025
- was, when compared with the previous season, comparable (0.6 percentage points higher) and achieved the ambition for this season
Pregnant women
Cumulative vaccine uptake in GP-registered pregnant women in 2025 to 2026:
- was 38.4%, compared with 35.0% in 2024 to 2025
- was 3.4 percentage points higher compared with the previous season, and achieved the ambition for this season
Aged 2 and 3 years
Cumulative vaccine uptake in GP-registered patients aged 2 and 3 years in 2025 to 2026:
- was, for those aged 2 and 3 years combined, 44.2% compared with 42.6% in 2024 to 2025
- was, for those aged 2 years, 43.5% compared with 41.7% in 2024 to 2025
- was for those aged 3 years, 44.8% compared with 43.5% in 2024 to 2025
- was, when compared with the previous season, 1.6 percentage points higher for those aged 2 and 3 years, and achieved the ambition for this season
There are supplementary data tables that show final influenza vaccine uptake for each of the eligible groups. They are available at NHS region, integrated care board (ICB) and sub-ICB level, as well as at local authority level.
GP practice response rate
The response rate for GP practices in England for the main GP flu survey was 99.3% (6,126 out of 6,170 practices), compared with 98.7% last season. The GP response rate for the child GP flu survey was 99.4% (6,126 out of 6,164 practices), compared with 99.2% last season. Data represents both automated and manual uploads. For further information about these surveys, see Background information.
Weekly versus monthly vaccine uptake comparison (provisional data)
Provisional weekly national level vaccine uptake data was published in the weekly disease surveillance report throughout the season. Data was published from week 40 (October 2025) to week 4 (January 2026). The weekly sentinel survey only used automated extracts, the response rate ranged between 99.2% in weeks 40 and 46 to 93.7% in week 51 for the main GP survey; and from 99.2% in weeks 43 and 46 to 98.9% in weeks 42 and 2 for the child GP survey. Weekly and monthly vaccine uptake data was overall in good agreement, with the provisional national results from the 5 monthly returns closely matching their weekly equivalent, confirming that the weekly sentinel collection is an excellent indicator of uptake at a national level. Further information on the sentinel survey collection can be found in Data sources and methodology.
Results summary of seasonal influenza vaccine uptake in GP patients
The total extrapolated estimate of individuals who received an influenza vaccine in this season was over 18,804,000 compared with over 18,188,000 last season (Table 1). This is over 615,000 more than in the previous season.
Table 1. Observed and extrapolated estimate of number of patients registered with GP practices and numbers who received a seasonal influenza vaccine in England during the 2025 to 2026 season compared with the 2024 to 2025 season
| Age groups | 2025 to 2026 number of patients registered | 2025 to 2026 number of patients vaccinated | 2025 to 2026 percentage vaccine uptake (%) | 2024 to 2025 number of patients registered | 2024 to 2025 number of patients vaccinated | 2024 to 2025 percentage vaccine uptake (%) |
|---|---|---|---|---|---|---|
| Aged 65 years and over | 11,644,058 | 8,674,672 | 74.5 | 11,338,042 | 8,494,489 | 74.9 |
| Aged 65 years and over extrapolated | 11,727,691 | 8,736,978 | 74.5 | 11,487,421 | 8,606,404 | 74.9 |
| Aged 65 to 74 years | 5,925,040 | 4,037,382 | 68.1 | [note 1] | [note 1] | [note 1] |
| Aged 65 to 74 years extrapolated | 5,967,597 | 4,066,380 | 68.1 | [note 1] | [note 1] | [note 1] |
| Aged 75 years and over | 5,719,018 | 4,637,290 | 81.1 | [note 1] | [note 1] | [note 1] |
| Aged 75 years and over extrapolated | 5,760,095 | 4,670,597 | 81.1 | [note 1] | [note 1] | [note 1] |
| All patients aged 6 months to under 65 years | 51,572,739 | 9,995,926 | 19.4 | 51,439,331 | 9,457,697 | 18.4 |
| All patients aged 6 months to under 65 years extrapolated | 51,943,160 | 10,067,722 | 19.4 | 52,117,045 | 9,582,302 | 18.4 |
| Total observed (65 years and over and all patients under 65 years) | 63,216,797 | 18,670,598 | 29.5 | 62,777,373 | 17,952,186 | 28.6 |
| Total extrapolated (65 years and over and all patients under 65 years) | 63,670,852 | 18,804,700 | 29.5 | 63,604,466 | 18,188,706 | 28.6 |
Note 1: this data was collected for the first time this season.
Vaccine uptake in patients aged 65 years and over
Vaccine uptake in patients aged 65 years and over was 74.5% in this season, which was a 0.4 percentage point decrease compared with 74.9% in the previous season (Table 1). As this is fewer than 1 percentage point difference to the previous season this is considered comparable to the previous season. The ambition of equivalent (or higher) uptake than the previous season was reached, with the end of season uptake for this cohort 0.5 percentage points below the WHO vaccine uptake target of 75.0% (Figure 1). This season vaccine uptake was 2.1 percentage points higher than that seen in the last season prior to the COVID-19 pandemic (2019 to 2020; 72.4%) (Figure 1). In 2019 to 2020 season vaccination began a month earlier than this season (September rather than October). For further details on changes in programme delivery between season see Background information.
Figure 1. Seasonal influenza vaccine uptake percentage (%) for those aged 65 years and over, and those aged under 65 years who are in clinical risk groups in England from 2009 to 2010 to 2025 to 2026

Note 1: during the 2025 to 2026 and the 2024 to 2025 seasons, adult groups (excluding pregnant women) were eligible from the start of October (1 and 3 October respectively), rather than 1 September as in previous seasons. Therefore, data for those aged 65 years and over and those aged under 65 years in clinical risk groups, is comparable between these 2 seasons, but is not comparable to 2023 to 2024 or seasons prior to that.
This season at a sub-ICB level 59.4% (63 out of 106) achieved the WHO target vaccine uptake for older adults of at least 75.0% compared with 63.2% (67 out of 106) in the previous season. Meanwhile, (17 out of 106) achieved the ambitions of equivalent (or higher) uptake this season than in the previous season. It is not possible to compare this to the number of sub-ICBs who achieved the ambition in the season before (2024 to 2025), due to the change in programme delivery for that season. For further information on the timing of programme delivery in adult groups see Background information.
The extrapolated estimate of the number of patients aged 65 years and over registered at a GP practice who would have been vaccinated by the end of February 2025 was over 8.7 million (over 8,736,000) (Table 1 and Figure 2). For reference this is over 131,000 more patients than the previous season. The number of individuals aged 65 years and over increases every year (an ageing population) and this season’s denominator increased by over 240,000 more.
Figure 2. Extrapolated estimated number of patients vaccinated in those aged 65 years and over, and those aged under 65 years in clinical risk groups, in England from 2009 to 2010 to 2025 to 2026

Note 1: during the 2025 and 2026 and the 2024 to 2025 seasons, adult groups (excluding pregnant women) were eligible from the start of October (1 and 3 October respectively), rather than 1 September as in previous seasons. Therefore, data for those aged 65 years and over and those aged under 65 years in clinical risk groups, is comparable between these 2 seasons, but is not comparable to 2023 to 2024 or seasons prior to that.
Note 2: data prior to 2018 to 2019 includes data up to the end of January.
For the first time this season vaccine uptake data for older adults aged 65 years and over was broken down between younger older-adults (those aged 65 to under 75 years) and older older-adults (75 years and over). This season there was a 13-percentage point difference between younger older-adults (68.1%) and older older-adults (81.1%) (supplementary table 2).
Vaccine uptake in clinical risk patients aged 6 months to under 65 years
Vaccine uptake in patients aged 6 months to under 65 years in one or more clinical risk groups was 40.6% in comparison with 40.0% in the previous season (a 0.6 percentage point increase) (Table 2 and Figure 1). The ambition of equivalent (or higher) uptake than the previous season was reached, and at a sub-ICB level (85 out of 106), achieved equivalent (or higher) uptake than the previous season this season, compared with 12.3% (13 out of 106) in the previous season.
Table 2. Observed and extrapolated estimate of the number of registered patients aged 6 months to under 65 years and in one or more clinical risk groups (excluding pregnant women without other risk factors and carers), in England who received a seasonal influenza vaccine in the 2025 to 2026 season compared with the 2024 to 2025 season
| Aged 6 months to under 65 years in a clinical risk group | 2025 to 2026 number of patients registered | 2025 to 2026 number of patients vaccinated | 2025 to 2026 percentage vaccine uptake (%) | 2024 to 2025 number of patients registered | 2024 to 2025 number of patients vaccinated | 2024 to 2025 percentage vaccine uptake (%) |
|---|---|---|---|---|---|---|
| Observed | 9,596,589 | 3,899,528 | 40.6 | 9,318,550 | 3,729,463 | 40.0 |
| Extrapolated | 9,665,517 | 3,927,536 | 40.6 | 9,441,322 | 3,778,599 | 40.0 |
The extrapolated estimate of the total number of patients aged 6 months to under 65 years in a clinical risk group and vaccinated by the end of February 2026 was over 3.9 million (over 3,927,000) (Table 2 and Figure 2). This season’s denominator was over 224,000 more than the denominator in the previous season (which was over 9,441,000) (Table 2).
Vaccine uptake for clinical risk groups broken down by age categories is given in Table 3 and Figure 3. This season vaccine uptake is comparable or higher in all age groups. The increase ranged from a 0.5 percentage point increase in those aged 16 to under 65 years to a 2.8 percentage point increase in those aged 5 years to under 16 years.
Vaccine uptake remains lowest in those aged 6 months to under 2 years (12.7% compared with 11.6% in the previous season (Figure 3). Uptake is highest in those 5 years to under 16 years (54.9%, compared with 52.1% in the previous season) (Table 3 and Figure 3).
Figure 3. Seasonal influenza vaccine uptake percentage (%) in those in clinical risk groups and aged under 65 years by age group, England, 2009 to 2010 season to 2025 to 2026 season

Note 1: during the 2025 and 2026 and the 2024 to 2025 seasons, adult groups (excluding pregnant women) were eligible from the start of October (1 and 3 October respectively), rather than 1 September as in previous seasons. Therefore, data for those aged under 65 years in clinical risk groups, is comparable between these 2 seasons, but is not comparable to 2023 to 2024 or seasons prior to that.
Note 2: the data for those 6 months to under 2 years in a clinical risk group should be interpreted with caution due to the small sample size.
Note 3: from the 2015 to 2016 season, patients with morbid obesity with no other clinical risk groups were included in the denominator.
Note 4: in the 2019 to 2020 season, there were supply issues for the live attenuated influenza vaccine (LAIV) vaccine, which affected those aged 2 years to under 16 years.
Table 3. Observed and extrapolated number of registered patients aged 6 months to under 65 years in clinical risk groups by age band in England who received an influenza vaccine in the 2025 to 2026 season
| Age groups of those in a clinical risk group | 2025 to 2026 number of patients registered | 2025 to 2026 number of patients vaccinated | 2025 to 2026 percentage vaccine uptake (%) | 2024 to 2025 number of patients registered | 2024 to 2025 number of patients vaccinated | 2024 to 2025 percentage vaccine uptake (%) |
|---|---|---|---|---|---|---|
| Total observed in those aged 6 months under 65 years | 9,596,589 | 3,899,528 | 40.6 | 9,318,550 | 3,729,463 | 40.0 |
| Total extrapolated in those aged 6 months under 65 years | 9,665,517 | 3,927,536 | 40.6 | 9,441,322 | 3,778,599 | 40.0 |
| Aged 6 months to under 2 years [note 1] | 17,795 | 2,260 | 12.7 | 16,763 | 1,943 | 11.6 |
| Aged 6 months to under 2 years extrapolated [note 1] | 17,923 | 2,276 | 12.7 | 16,984 | 1,969 | 11.6 |
| Aged 2 years to under 5 years | 56,525 | 25,806 | 45.7 | 56,119 | 24,478 | 43.6 |
| Aged 2 years to under 5 years extrapolated | 56,931 | 25,991 | 45.7 | 56,858 | 24,800 | 43.6 |
| Aged 5 years to under 16 years | 603,527 | 331,292 | 54.9 | 592,223 | 308,711 | 52.1 |
| Aged 5 years to under 16 years extrapolated | 607,862 | 333,672 | 54.9 | 600,026 | 312,778 | 52.1 |
| Aged 16 to under 65 years | 8,918,742 | 3,540,170 | 39.7 | 8,653,445 | 3,394,331 | 39.2 |
| Aged 16 to under 65 years extrapolated | 8,982,801 | 3,565,597 | 39.7 | 8,767,454 | 3,439,051 | 39.2 |
Note 1: the data for those 6 months to under 2 years in a clinical risk group should be interpreted with caution due to the small sample size.
Vaccine uptake in individual clinical risk groups
Vaccine uptake percentages in the individual clinical risk groups aged under 65 years are shown in Table 4, Figure 4a, Figure 4b and supplementary tables 12 to 20. The number of those vaccinated in each risk group is shown in Figure 4a. Figure 4b shows the difference in the size of the individual clinical risk groups, the smallest of which is the severe learning disability group, and the largest of which is the chronic respiratory disease group.
Figure 4a. Extrapolated number of registered patients who received a seasonal influenza vaccine by individual clinical risk group for all those aged 6 months to under 65 years, in England, in the 2025 to 2026 season
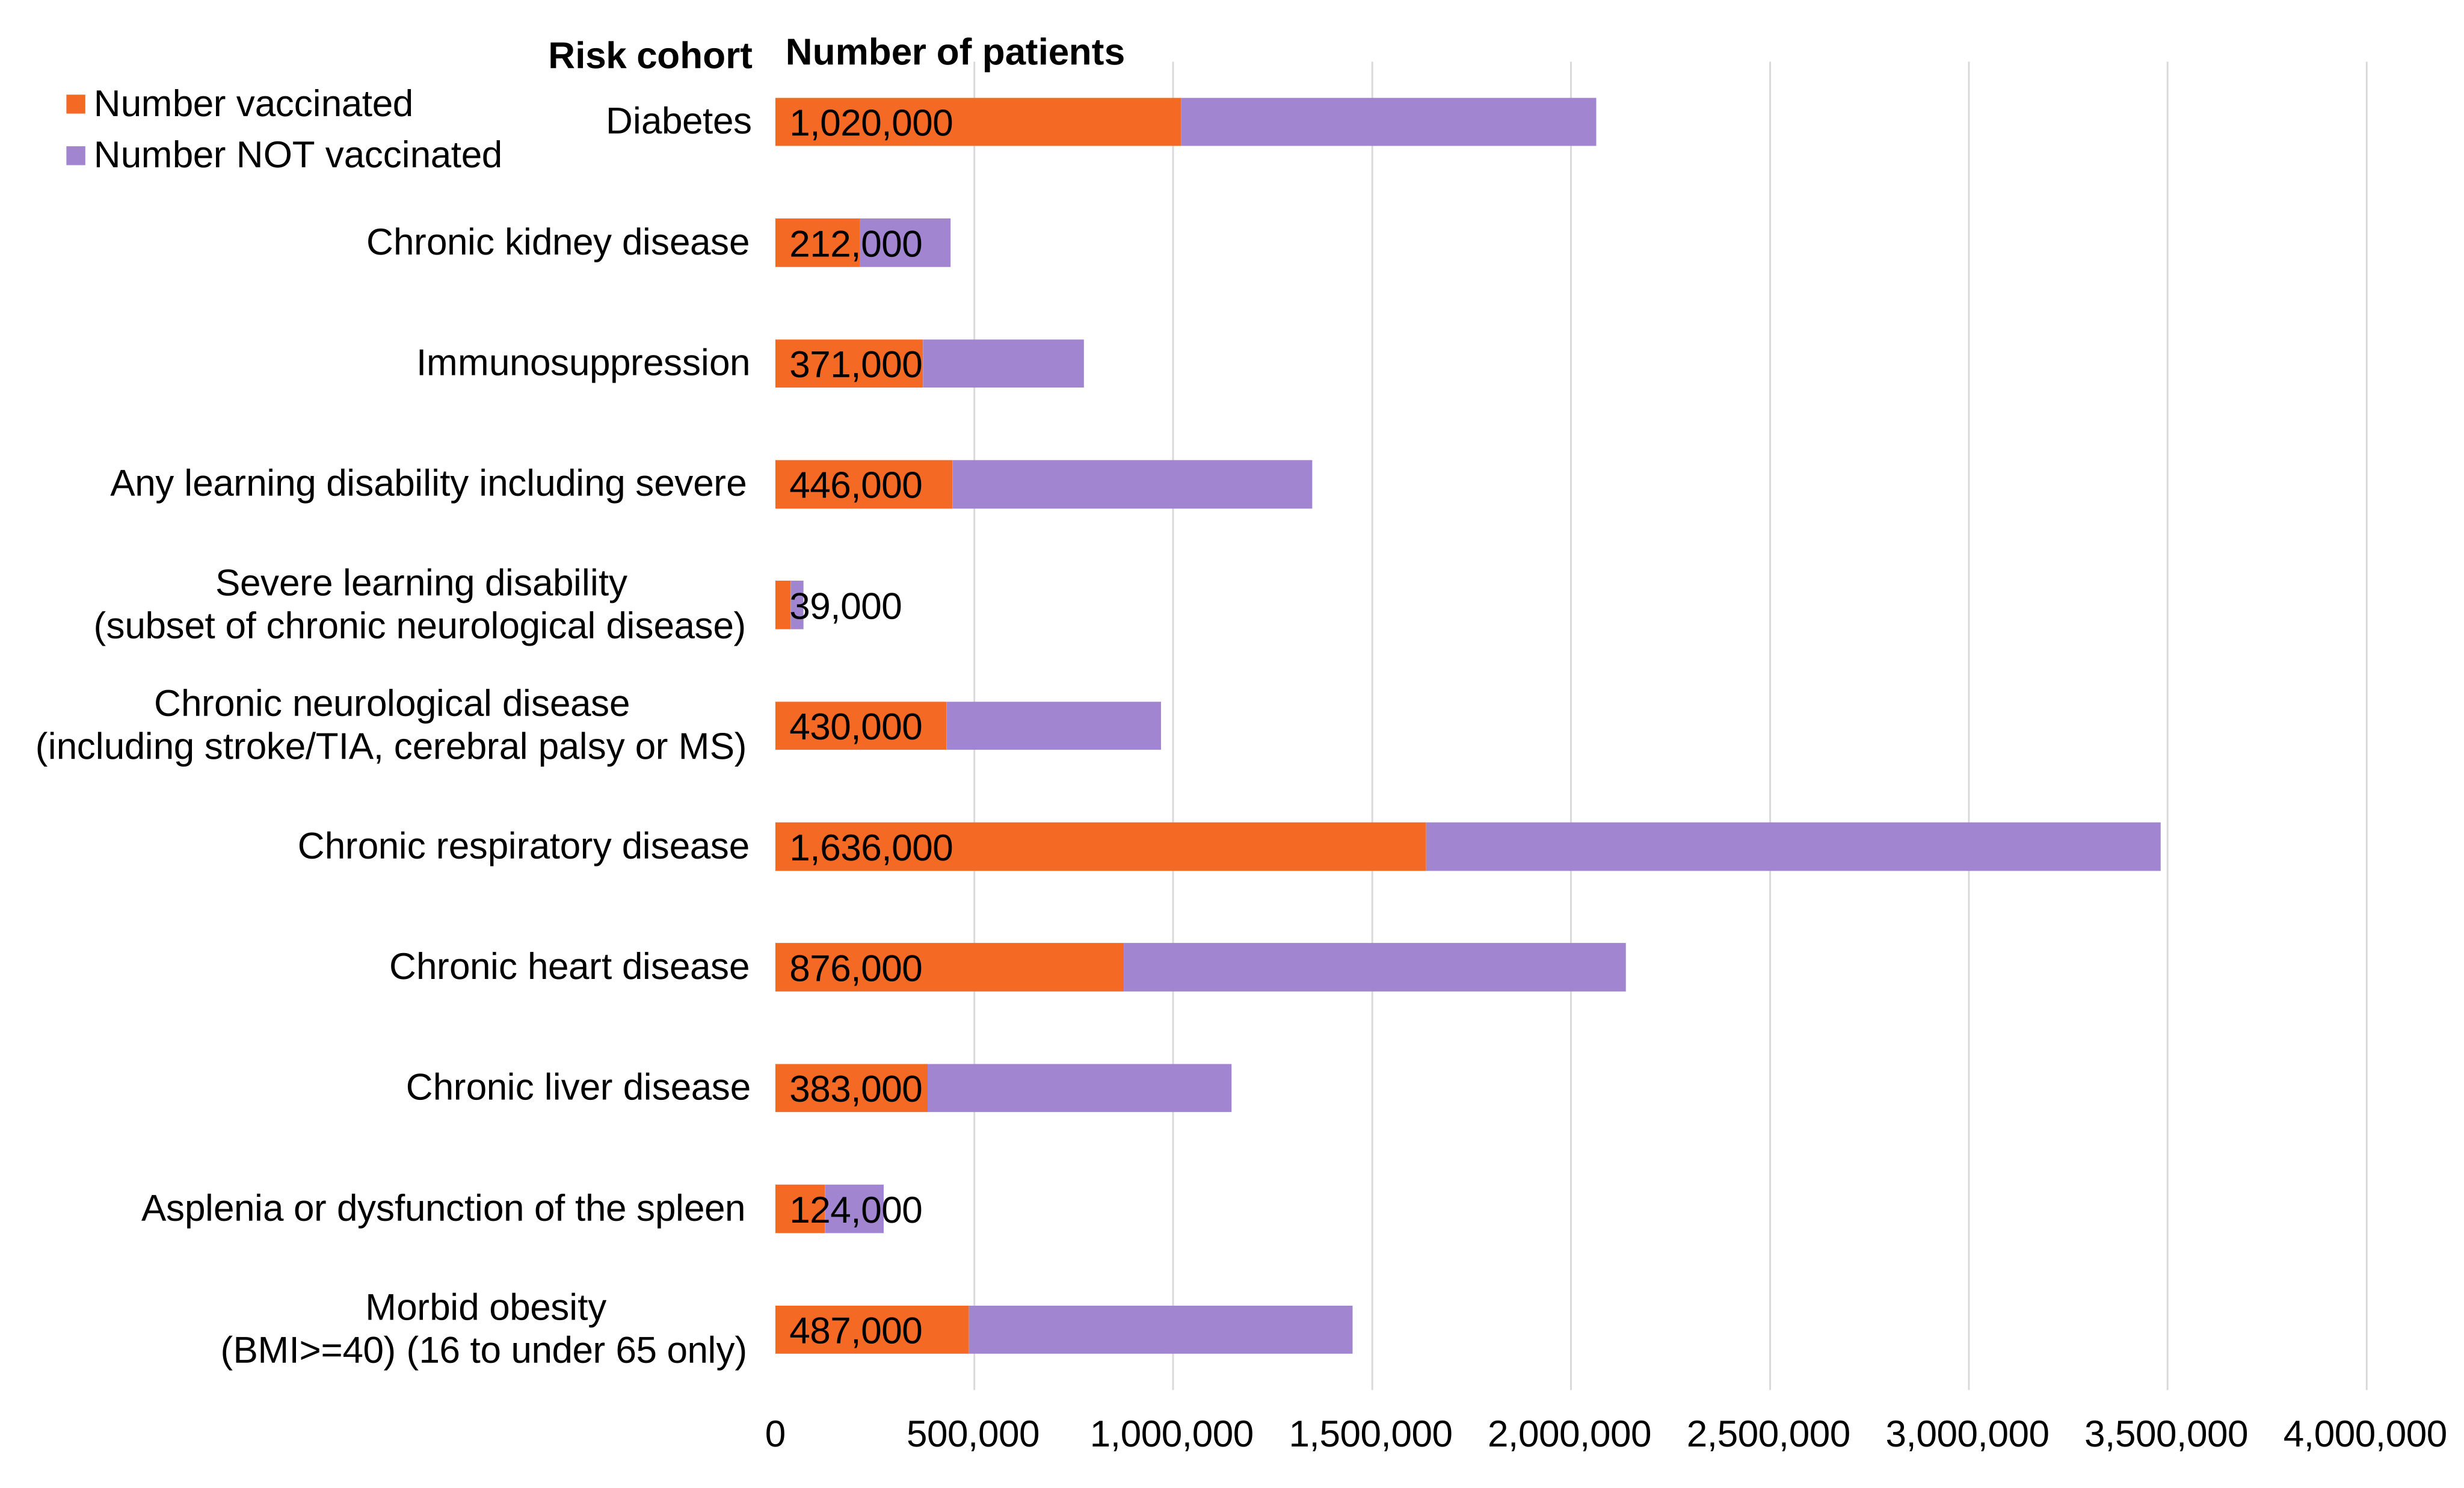
Note 1: TIA = transient ischemic attack; MS = multiple sclerosis; BMI = body mass index.
All clinical risk groups met the national ambition of equal (or higher) uptake compared with the previous season. Uptake was either within 1 percentage point difference to the previous season (and therefore considered comparable) or was higher than the previous season. Those with chronic respiratory disease or those with asplenia or dysfunction of the spleen had uptake 2.4 and 1.6 percentage points higher than the previous season, respectively.
Vaccine uptake percentage patterns for individual risk groups were similar to the previous season (Table 4 and Figure 4b. This season, the highest vaccine uptake by individual risk group was in patients with a severe learning disability (subset of chronic neurological disease and within that group, a subset of any learning difficulty) at 55.9% compared with 56.2% in the previous season, (which was also the highest-ranking group that season). The lowest uptake this season was in patients with any learning disability (including severe) at 33.0% (compared with 33.2% in the previous season, and which was also the lowest-ranking group that season (Table 4 and Figure 4b).
Figure 4b. Seasonal influenza vaccine uptake percentage (%) by individual clinical risk group for all those aged 6 months to under 65 years in England, for the 2025 to 2026 and 2024 to 2025 seasons

Note 1: data is up to the end of February 2026.
Following a similar pattern to the previous season, the second and third-lowest uptake was seen in patients with chronic liver disease at 33.4% (compared with 33.8%) and patients with morbid obesity (body mass index (BMI) greater than or equal to 40) at 33.5% (compared with 34.2%). All other groups had vaccine uptake percentages above the national average of 40.6% this season. The second and third-highest uptake was seen in patients with diabetes at 49.4% (compared with 49.7%) and patients with chronic kidney disease at 48.1% (compared with 48.0%) (Table 4 and Figure 4b).
Table 4. Seasonal influenza vaccine uptake percentage (%) by individual clinical risk groups and age bands for GP-registered patients aged 6 months to under 65 years in England for this season (2025 to 2026) and the previous season (2024 to 2025)
| Risk group [note 1] | 2025 to 2026 aged 6 months to under 2 years | 2025 to 2026 aged 2 years to under 5 years | 2025 to 2026 aged 5 years to under 16 years | 2025 to 2026 aged 16 years to under 65 | 2025 to 2026 total aged under 65 years | 2024 to 2025 aged 6 months to under 2 years | 2024 to 2025 aged 2 years to under 5 years | 2024 to 2025 aged 5 years to under 16 years | 2024 to 2025 aged 16 years to under 65 | 2024 to 2025 aged total under 65 years |
|---|---|---|---|---|---|---|---|---|---|---|
| Diabetes | 14.9 | 47.3 | 54.7 | 49.4 | 49.4 | 10.6 | 44.3 | 51.1 | 49.7 | 49.7 |
| Chronic kidney disease | 13.0 | 41.1 | 47.7 | 48.1 | 48.1 | 14.8 | 40.1 | 44.3 | 48.1 | 48.0 |
| Immunosuppression [note 1] | 14.3 | 42.9 | 49.9 | 47.9 | 47.9 | 9.8 | 38.3 | 46.1 | 47.4 | 47.2 |
| Chronic neurological disease (including stroke or TIA, cerebral palsy or MS) [note 1] | 12.7 | 43.6 | 50.5 | 44.0 | 44.3 | 12.6 | 41.2 | 47.8 | 44.5 | 44.6 |
| Severe learning disability (subset of chronic neurological disease) | [note 2] | 30.8 [note 4] | 42.4 | 57.2 | 55.9 | [note 2] | 29.3 [note 4] | 41.9 | 57.4 | 56.2 |
| Any learning disability (including severe) | 19.3 | 36 | 43.5 | 27.3 | 33 | 18.4 | 33.2 | 40.6 | 29.1 | 33.2 |
| Chronic respiratory disease | 20.1 | 51.3 | 57.2 | 45.7 | 47 | 16.0 | 49.4 | 54.1 | 43.4 | 44.6 |
| Chronic heart disease [note 1] | 12.5 | 43.6 | 52.5 | 40.5 | 41 | 11.2 | 40.8 | 49.8 | 41.1 | 41.4 |
| Chronic liver disease [note 1] | 13.6 | 48.4 | 44.6 | 33.3 | 33.4 | 16.1 | 41.1 | 42.0 | 33.7 | 33.8 |
| Asplenia or dysfunction of the spleen | 17.1 | 52.7 | 57.6 | 44.2 | 45.5 | 16.9 | 48.5 | 54.2 | 42.8 | 43.9 |
| Morbid obesity (BMI greater than or equal to 40) [note 1] | [note 3] | [note 3] | [note 3] | 33.5 | 33.5 | [note 3] | [note 3] | [note 3] | 34.2 | 34.2 |
Note 1: there were adjustments to classification in clinical coding of these groups in the Systematized Nomenclature of Medicine Clinical Terminology (SNOMED CT) transition and caution should be applied in historical comparisons.
Note 2: this indicates data was suppressed because of small numbers.
Note 3: data not available.
Note 4: data should be interpreted with caution due to the small sample size.
Note 5: TIA = transient ischemic attack; MS = multiple sclerosis; BMI = body mass index.
Vaccine uptake percentages varied across individual risk groups and by age (Table 4). This season, in all individual risk groups the lowest uptake by age was seen in those aged 6 months to less than 2 years and ranged from 12.5% in those with chronic heart disease, to 20.1% in those with chronic respiratory disease. For most individual risk groups, the highest uptake by age was in those aged 5 years to less than 16 years and ranged from 43.5% in those with any learning disability (including severe learning disability), to 57.6% in those with asplenia or dysfunction of the spleen. For those with chronic kidney disease and those with a severe learning disability (a subset of any learning disability, and a subset of chronic neurological disease), uptake was highest in those aged 16 to under 65 years at 48.1% and 57.2% respectively. The greatest variation by age was seen in patients with asplenia or dysfunction of the spleen, ranging from 17.1% in those 6 months to under 2 years, to 57.6% in those 5 years to under 16 years (Table 4). The least variation by age was seen in patients with a severe learning disability (a subset of any learning disability, and a subset of chronic neurological disease), ranging from 42.4% in those 5 years to under 16 years, and 57.2% in those 16 years to under 65 years.
Trends this season were similar to trends seen in the previous season (Table 4). However, for some of the individual risk groups in the youngest ages this season there were some notable increases in vaccine uptake compared with the previous season. The greatest increase (7.3 percentage points) was seen in those with chronic liver disease aged 2 years to less than 5 years (48.4% compared with 41.1%). In this age group in those with immunosuppression there was a 4.6 percentage point increase (42.9% compared with 38.3%), and a 4.2 percentage point increase (14.3% compared with 9.8%) in those with asplenia or dysfunction of the spleen. In those 6 months to less than 2 years there was a 4.5 percentage point increase (14.3% compared with 9.8%) in those with immunosuppression, a 4.3 percentage point increase (14.9% compared with 10.6%) in those with diabetes, and a 4.1 percentage point increase (20.1% compared with 16.0%) in those with chronic respiratory disease (Table 4).
Vaccine uptake in pregnant women
This group was added to the national programme in 2010 to 2011 and the highest end of season uptake on record was during the 2017 to 2018 season (47.2%) (Figure 5). Vaccine uptake in all pregnant women (healthy and in clinical risk groups combined) was 38.4% this season, a 3.4 percentage point increase from 35.0% in the previous season (Table 5). This achieved the ambitions of higher uptake this season than in the previous season. Vaccine uptake was higher for pregnant women in clinical risk groups than it was for pregnant women not in clinical risk groups (49.0% compared with 36.8%, a 12.2 percentage point difference). This trend was seen in the previous season (44.9% for pregnant women in clinical risk groups compared with 33.6% for pregnant women not in clinical risk groups) (Table 5).
Figure 5. Seasonal influenza vaccine uptake (%) in pregnant women in England in the 2025 to 2026 season compared with previous survey seasons

Note 1: the maternal seasonal influenza vaccination programme was introduced in the 2010 to 2011 season, but data were collected in a different format for that season and are therefore not reported above.
The extrapolated estimate of the number of pregnant women registered at a GP practice and vaccinated by the end of February 2026 was over 249,000. This is over 21,000 more individuals than the previous season (Table 5). Data on the uptake of influenza vaccine by pregnant women needs to be interpreted with caution. See Data limitations: pregnant women.
Table 5. Observed and extrapolated estimated number of pregnant women registered and who received a seasonal influenza vaccine in England in the 2025 to 2026 season compared with the 2024 to 2025 season
| Pregnant women | 2025 to 2026 number of patients registered | 2025 to 2026 number of patients vaccinated | 2025 to 2026 percentage vaccine uptake (%) | 2024 to 2025 number of patients registered | 2024 to 2025 number of patients vaccinated | 2024 to 2025 percentage vaccine uptake (%) |
|---|---|---|---|---|---|---|
| All observed | 643,718 | 247,337 | 38.4 | 642,898 | 225,088 | 35.0 |
| All extrapolated | 648,342 | 249,113 | 38.4 | 651,368 | 228,054 | 35.0 |
| In a clinical risk group observed | 84,724 | 41,526 | 49.0 | 78,862 | 35,411 | 44.9 |
| In a clinical risk group extrapolated | 85,333 | 41,824 | 49.0 | 79,901 | 35,878 | 44.9 |
| Not in a clinical risk group observed | 558,994 | 205,811 | 36.8 | 564,036 | 189,677 | 33.6 |
| Not in a clinical risk group extrapolated | 563,009 | 207,289 | 36.8 | 571,467 | 192,176 | 33.6 |
Note 1: all includes those in a clinical risk group and not in a clinical risk group.
Vaccine uptake in pre-school-aged children
Combined vaccine uptake in those aged 2 and 3 years was 44.2% this season, compared with 42.6% in the previous season (Table 6), which is a 1.6 percentage point increase. As seen in the previous season, vaccine uptake this season was higher in those aged 2 and 3 years in clinical risk groups (47.8%) than in those aged 2 and 3 years not in clinical risk groups (44.1%) (Table 6). This season had a 3.7 percentage point difference between those in clinical risk groups and those not in clinical risk groups.
Table 6. Observed and extrapolated number of GP-registered patients aged 2 and 3 years who received a seasonal influenza vaccine in England in the 2025 to 2026 season compared with the 2024 to 2025 season
| Aged 2 and 3 years | 2025 to 2026 number of patients registered | 2025 to 2026 number of patients vaccinated | 2025 to 2026 percentage vaccine uptake (%) | 2024 to 2025 number of patients registered | 2024 to 2025 number of patients vaccinated | 2024 to 2025 percentage vaccine uptake (%) |
|---|---|---|---|---|---|---|
| All observed | 1,193,355 | 527,175 | 44.2 | 1,232,780 | 525,707 | 42.6 |
| All extrapolated | 1,200,757 | 530,445 | 44.2 | 1,242,360 | 529,792 | 42.6 |
| In a clinical risk group observed | 36,094 | 17,239 | 47.8 | 36,645 | 16,693 | 45.6 |
| In a clinical risk group extrapolated | 36,318 | 17,346 | 47.8 | 36,930 | 16,823 | 45.6 |
| Not in a clinical risk group observed | 1,157,261 | 509,936 | 44.1 | 1,196,135 | 509,014 | 42.6 |
| Not in a clinical risk group extrapolated | 1,164,440 | 513,099 | 44.1 | 1,205,430 | 512,969 | 42.6 |
Note 1: all includes those in a clinical risk group and not in a clinical risk group.
The extrapolated estimate of the number of those aged 2 and 3 years registered at a GP practice vaccinated by the end of February 2026 was 530,000, which was comparable to the previous season (Table 6). However, the denominator for this season is 42,000 smaller than the previous season.
A summary of vaccine uptake in those aged 2 and 3 years for each season since the nasal spray live attenuated influenza vaccine (LAIV) programme was introduced in the 2013 to 2014 season can be found in Figure 6 and supplementary table 2.
Figure 6. Seasonal influenza vaccine uptake percentage (%) in those aged 2 and 3 years (both healthy and in clinical risk groups) in England for the 2024 to 2025 season compared with previous survey seasons
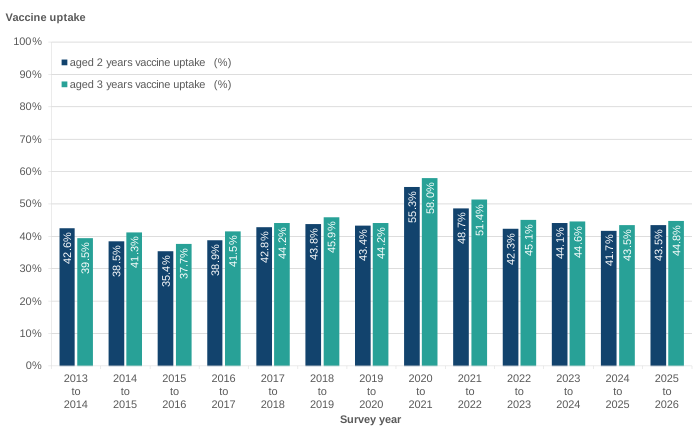
For historical context of this group, the highest vaccine uptake on record was 56.7% (the first year of the COVID-19 pandemic) (Figure 6), with uptake decreasing in the following 2 seasons. The end of season vaccine uptake decreased to 50.1% in the 2021 to 2022 season (the second year of the COVID-19 pandemic). The 2022 to 2023 and 2023 to 2024 seasons saw comparable uptake to each other (within 1 percentage point difference) at 43.7% and 44.4% respectively. This was comparable to vaccine uptake seen prior to the COVID-19 pandemic (2019 to 2020) (43.8%), however, due to supply issues for this group that season’s data is not wholly comparable. The season before that (2018 to 2019) saw an uptake of 44.9%. This season’s uptake was comparable at 0.8 percentage points below that seen in 2018 to 2019 season (Figure 6).
Vaccine uptake in those aged 2 years was 43.5% this season, compared with 41.7% in the previous season (Table 7), which is a 1.8 percentage point increase. The extrapolated estimate of the number of those aged 2 years registered at a GP practice vaccinated by end of February 2026 was over 253,000. This is over 3,000 fewer individuals than the previous season.
Table 7. Observed and extrapolated number of GP-registered patients aged 2 years who received a seasonal influenza vaccine in England in the 2025 to 2026 season compared with the 2024 to 2025 season
| Aged 2 years | 2025 to 2026 number of patients registered | 2025 to 2026 number of patients vaccinated | 2025 to 2026 percentage vaccine uptake (%) | 2024 to 2025 number of patients registered | 2024 to 2025 number of patients vaccinated | 2024 to 2025 percentage vaccine uptake (%) |
|---|---|---|---|---|---|---|
| All observed | 580,209 | 252,360 | 43.5 | 611,442 | 255,212 | 41.7 |
| All extrapolated | 583,808 | 253,925 | 43.5 | 616,193 | 257,195 | 41.7 |
| In a clinical risk group observed | 16,087 | 7,481 | 46.5 | 16,500 | 7,262 | 44.0 |
| In a clinical risk group extrapolated | 16,187 | 7,527 | 46.5 | 16,628 | 7,318 | 44.0 |
| Not in a clinical risk group observed | 564,122 | 244,879 | 43.4 | 594,942 | 247,950 | 41.7 |
| Not in a clinical risk group extrapolated | 567,621 | 246,398 | 43.4 | 599,565 | 249,877 | 41.7 |
Note 1: All includes those in a clinical risk group and not in a clinical risk group.
Vaccine uptake in those aged 3 years was 44.8% this season, compared with 43.5% in the previous season (Table 8), which is a 1.3 percentage point increase. The extrapolated estimate of the number of those aged 3 years registered at a GP practice who would have been vaccinated by the end of February 2026 was over 276,000. This is over 3,000 more individuals than the previous season.
Table 8. Observed and extrapolated number of GP-registered patients aged 3 years who received a seasonal influenza vaccine in England in the 2025 to 2026 season compared with the 2024 to 2025 season
| Aged 3 years | 2025 to 2026 number of patients registered | 2025 to 2026 number of patients vaccinated | 2025 to 2026 percentage vaccine uptake (%) | 2024 to 2025 number of patients registered | 2024 to 2025 number of patients vaccinated (%) | 2024 to 2025 percentage vaccine uptake (%) |
|---|---|---|---|---|---|---|
| All observed | 613,146 | 274,815 | 44.8 | 621,338 | 270,495 | 43.5 |
| All extrapolated | 616,949 | 276,520 | 44.8 | 626,166 | 272,597 | 43.5 |
| In a clinical risk group observed | 20,007 | 9,758 | 48.8 | 20,145 | 9,431 | 46.8 |
| In a clinical risk group extrapolated | 20,131 | 9,819 | 48.8 | 20,302 | 9,504 | 46.8 |
| Not in a clinical risk group observed | 593,139 | 265,057 | 44.7 | 601,193 | 261,064 | 43.4 |
| Not in a clinical risk group extrapolated | 596,818 | 266,701 | 44.7 | 605,865 | 263,093 | 43.4 |
Note 1: All includes those in a clinical risk group and not in a clinical risk group.
Vaccine uptake in all patients aged 6 months to under 65 years
Vaccine uptake in all patients aged 6 months to under 65 years was 19.4% compared with 18.4% in the previous season, a 1.0 percentage point increase. The extrapolated number of all registered patients aged 6 months to under 65 years (including those in a clinical risk group) who received a seasonal influenza vaccine by the end of February 2026 was over 10,067,000 (Table 9).
Table 9. Observed and extrapolated figures for ‘all patients’ aged 6 months to under 65 years in England who received seasonal influenza vaccine by age band in the 2025 to 2026 season compared with the 2024 to 2025 season
| All GP registered patient data (includes those in a clinical risk group and those not in a clinical risk group) | 2025 to 2026 number of patients registered | 2025 to 2026 number of patients vaccinated | 2025 to 2026 percentage vaccine uptake (%) | 2024 to 2025 number of patients registered | 2024 to 2025 number of patients vaccinated | 2024 to 2025 percentage vaccine uptake (%) |
|---|---|---|---|---|---|---|
| Total observed aged 6 months under 65 years | 51,572,739 | 9,995,926 | 19.4 | 51,439,331 | 9,457,697 | 18.4 |
| Total extrapolated aged 6 months under 65 years | 51,943,160 | 10,067,722 | 19.4 | 52,117,045 | 9,582,302 | 18.4 |
| Aged 6 months to under 2 years | 846,081 | 3,463 | 0.4 | 829,475 | 2,701 | 0.3 |
| Aged 6 months to under 2 years extrapolated | 852,158 | 3,488 | 0.4 | 840,403 | 2,737 | 0.3 |
| Aged 2 years to under 5 years | 1,797,375 | 697,864 | 38.8 | 1,823,972 | 678,191 | 37.2 |
| Aged 2 years to under 5 years extrapolated | 1,810,285 | 702,876 | 38.8 | 1,848,003 | 687,126 | 37.2 |
| Aged 5 years to under 16 years | 7,876,638 | 3,795,544 | 48.2 | 7,928,437 | 3,572,971 | 45.1 |
| Aged 5 years to under 16 years extrapolated | 7,933,212 | 3,822,805 | 48.2 | 8,032,894 | 3,620,045 | 45.1 |
| Aged 16 years to under 65 years | 41,052,645 | 5,499,055 | 13.4 | 40,857,447 | 5,203,834 | 12.7 |
| Aged 16 years to under 65 years extrapolated | 41,347,506 | 5,538,552 | 13.4 | 41,395,745 | 5,272,395 | 12.7 |
Location of vaccine delivery
The percentage of vaccinations administered at different locations for eligible groups are shown in Table 10 and Figure 7. Other healthcare settings vary by eligible group, but include antenatal clinics, nursery schools, care homes and private or occupational health services. This season still saw most vaccinations delivered within GP practices, but with lower percentages than the previous season (Table 10). The decrease in the percentages of vaccinations given in GP practices compared with 2024 to 2025 was 11.2 percentage points for all pregnant women, 6.3 percentage points for all aged 2 and 3 years, 2.1 percentage points for those aged 6 months to under 65 years clinical risk groups, and 1.1 percentage points for those aged 65 years and over.
Table 10. Percentage vaccine uptake by GP practices, pharmacies, and other healthcare settings in England in the 2025 to 2026 season compared with the 2024 to 2025 season
| Patient group | 2025 to 2026 GP practices | 2025 to 2026 pharmacies | 2025 to 2026 other healthcare settings and schools | 2024 to 2025 GP practices | 2024 to 2025 pharmacies | 2024 to 2025 other healthcare settings and schools |
|---|---|---|---|---|---|---|
| Aged 65 years and over | 62.7 | 29.5 | 7.7 | 63.8 | 28.1 | 8.1 |
| Aged 6 months to under 65 years in a clinical risk group | 54.8 | 28.8 | 16.4 | 56.9 | 26.7 | 16.4 |
| All pregnant women | 39.5 | 15.5 | 44.9 | 50.7 | 13.4 | 35.9 |
| All aged 2 and 3 years | 91.2 | 1.7 [note 1] | 7.1 [note 1] | 97.5 | 0.1 | 2.4 |
Note 1: there was a coding discrepancy between the GP IT system suppliers for those aged 2 to 4 years vaccinated outside the GP setting; therefore, vaccination percentages for pharmacy and other healthcare settings must be interpreted with caution for those aged 2 and 3 years. In this age group, percentages for other healthcare settings may be overestimated and percentages for pharmacies may be underestimated.
For this season compared with the previous season, in those aged 65 years and over, delivery in pharmacies increased by 1.4 percentage points (29.5% compared with 28.1% in 2024 to 2025). Delivery in other healthcare settings was comparable (an increase of 0.4 percentage points; 7.7% compared with 8.1% in the previous season) (Table 10).
For those aged 6 months to under 65 years in a clinical risk group, there was a 2.1 percentage point increase in pharmacy delivery (28.8% this season compared with 26.7% in the previous season). Delivery in other healthcare settings was comparable (16.4% for both seasons) (Table 10).
Pregnant women saw a 9.0 percentage point increase in vaccination delivery in other healthcare settings (antenatal clinics) (44.9% this season compared with 35.9% in the previous season) (Table 10).
Those aged 2 and 3 years saw a decrease in vaccination in a GP setting; however, due to a coding discrepancy between the GP IT system suppliers the number vaccinated via pharmacy and other healthcare settings must be interpreted with caution.
Figure 7. Percentage of seasonal influenza vaccinations given by location for those aged 65 years and over, patients aged 6 months to under 65 years and in one or more clinical risk groups, pregnant women, all aged 2 and 3 years in England in the 2025 to 2026 season compared with the 2024 to 2025 season

Note 1: There was a coding a coding discrepancy between the GP IT system suppliers for those aged 2 to 4 years vaccinated outside the GP setting; therefore, vaccination percentages for pharmacy and other healthcare settings must be interpreted with caution for those aged 2 and 3 years.
Historical trends in vaccination delivery location from 2019 to 2020 (pre-COVID-19 pandemic) to the 2025 to 2026 season are presented in supplementary table 16. Since the 2019 to 2020 season there has been a continued decline in vaccinations delivered in GP practices for those aged 65 years and over, clinical risk groups and pregnant women. There have been continued increases in vaccinations delivered in pharmacies and other healthcare settings. The group that has had the largest change in the location of vaccination delivery during this time is pregnant women. For this group, 90.0% of vaccinations were delivered in GP practices in 2019 to 2020 season, compared with 39.5% this season. This season 15.5% of vaccinations were delivered in pharmacies compared with 4.2% in 2019 to 2020 season, while 44.9% of vaccinations were delivered in other healthcare settings (antenatal clinics) this season compared with 5.8% in the 2019 to 2020 season (supplementary table 16).
Recording of vaccinations given in another healthcare setting outside of the GP practice does not come under an existing information standard, therefore location recording can vary among GP practices and GP IT system suppliers (see Data limitations).
Vaccine uptake in carers
This season, vaccine uptake for carers aged 16 to under 65 years and not in a clinical risk group was 31.3% compared with 31.8% the previous season, a 0.5 percentage point decrease compared with the previous season (Table 11). Caution should be used when interpreting this data as carer status is poorly recorded in the GP record and is not likely to be kept up to date.
Table 11. Observed and extrapolated figures for carers who received a seasonal influenza vaccine in England during the 2025 to 2026 season compared with the 2024 to 2025 season
| Aged 16 years to under 65 years not in clinical risk groups who fulfil the carer definition | 2025 to 2026 number of patients registered | 2025 to 2026 number of patients vaccinated | 2025 to 2026 percentage vaccine uptake (%) | 2024 to 2025 percentage vaccine uptake (%) |
|---|---|---|---|---|
| Observed | 826,286 | 258,584 | 31.3 | 31.8 |
| Extrapolated | 832,000 | 260,000 | 31.3 | 31.8 |
Vaccine uptake in social care workers
The collection of vaccination data for GP-registered patients who are social care workers was introduced to the GP survey in the 2019 to 2020 season as an experimental group. This season, data was available for 68.5% (4,225 out of 6,170) of all GP practices in England. This is compared with 67.0% (4,172 out of 6,230) of all GP practices in England in the previous season. The response rate ranged from 35.2% in London to 95.1% in the South West. Therefore, caution should be used when interpreting the data.
There were 33,775 social care workers who were recorded on data submitted by GP practices, increasing from 32,823 in the previous season. This is likely to account for around 2.1% of social care workers (1.6 million in adult social care). Of social care workers included in this data collection, 31.4% were vaccinated and is comparable to last season. At the regional level, vaccine uptake ranged from 17.1% in London to 35.0% in the East of England.
Despite SNOMED CT codes for social care occupations being added in 2018, this is still poorly recorded in the GP record and is not likely to be kept up to date on such a fluid workforce with very little available occupational health support. Data flows from social care employers and pharmacies will need to improve to ensure that vaccination status is reflected accurately in the GP record similar to other vaccinations given in other settings.
Vaccine uptake by sex
Aged 65 years and over by sex
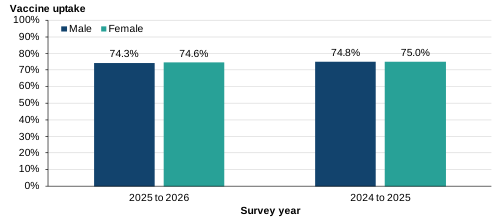
For those aged 65 years and over, uptake was similar between males and females for the last 3 seasons (Figure 8a). Those with sex not specified or unknown were removed because of small numbers.
Figure 8a. Seasonal influenza vaccine uptake percentage (%) in those aged 65 years and over, by sex, in England for the 2025 to 2026 season compared with the 2024 to 2025 season
Patients in clinical risk groups aged 16 to under 65 years by sex
For this season and previous seasons, data was collected for patients in clinical risk groups aged 16 years to under 65 years. The clinical risk groups include pregnant women with other risk factors but excludes otherwise ‘healthy’ pregnant women. This season, vaccine uptake in patients in clinical risk groups was 8.8 percentage points higher in females (34.0%) than males (25.2%) (Figure 8b). This does not account for differences caused by the vaccination of pregnant women. The previous season saw a 8.3 percentage point difference between males (24.2%) and females (32.5%).
Figure 8b. Seasonal influenza vaccine uptake percentage (%) in patients in clinical risk groups aged 16 to under 65 years, by sex, in England for the 2025 to 2026 season compared with the 2024 to 2025 season

Vaccine uptake by ethnicity
Trends in ethnicity data are comparable to previous seasons. Ethnicity data was presented for the following groups: adults aged 65 years and over, those aged 16 to under 65 years in a clinical risk group, pregnant women and pre-school aged children (aged 2 and 3 years). The data presented in Table 12a, Table 12b, Table 12c, and Table 12d. Ethnicity is coded using the 16+1 ethnic data categories defined in the 2001 census that forms the national mandatory standard for the collection and analysis of ethnicity.
At a national level, the ‘Black and Black British - Caribbean’ group had the lowest uptake in all 4 groups. However, at a regional level (presented in the ethnicity data by region on the ethnicity ranked tab in supplementary table 9), the group with the lowest uptake varied by region. Regional ethnicity uptake data in supplementary table 9 is presented in descending order.
At a national level, the highest uptake for those aged 16 to under 65 years in a clinical risk group, as well as those aged 65 years and over, was in the ‘White - British’ group. For pregnant women and the pre-school aged cohort, the highest uptake was in the ‘Other ethnic group - Chinese’.
For both pregnant women and those aged 65 years and over, the ethnic group with the highest uptake was the same across all regions and nationally. However, for the clinical risk groups, the White - British group had the highest uptake in 5 regions (South West, South East, Midlands, North West, North East and Yorkshire). In the East of England, Other ethnic group - Chinese had the highest uptake, and the White - British group the second highest uptake. In London, 3 groups (‘Asian or Asian British - Bangladeshi’, ‘Asian or Asian British - any other Asian background’, Other ethnic groups - Chinese) had higher uptake than the White - British group, which had the fourth highest uptake.
Aged 65 years and over by ethnicity
For those aged 65 years and over, 88.9% were recorded with a 2001 code, 2.2% were recorded with no code and 8.5% were recorded with a non-2001 census code, and 0.4% refused to give ethnicity. Vaccine uptake for those who refused to give their ethnicity data was 60.4% (Table 12a).
Table 12a. Seasonal influenza vaccine uptake in those aged 65 years and over by ethnic group, in England in the 2025 to 2026 season
| Ethnic group | Number of patients registered aged 65 years and over | Number of patients vaccinated aged 65 years and over | Vaccine uptake (%) |
|---|---|---|---|
| White - British | 8,631,030 | 6,788,724 | 78.7 |
| White - Irish | 98,968 | 72,738 | 73.5 |
| White - Other | 416,125 | 234,318 | 56.3 |
| Mixed - White and Black Caribbean | 18,300 | 8,896 | 48.6 |
| Mixed - White and Black African | 13,380 | 6,299 | 47.1 |
| Mixed - White and Asian | 13,293 | 8,672 | 65.2 |
| Mixed - any other mixed background | 33,442 | 19,583 | 58.6 |
| Asian or Asian British - Indian | 244,567 | 155,517 | 63.6 |
| Asian or Asian British - Pakistani | 115,346 | 51,959 | 45.0 |
| Asian or Asian British - Bangladeshi | 33,314 | 20,025 | 60.1 |
| Asian or Asian British - any other Asian background | 118,791 | 73,824 | 62.1 |
| Black or Black British - Caribbean | 91,817 | 36,122 | 39.3 |
| Black or Black British - African | 103,722 | 43,585 | 42.0 |
| Black or Black British - any other Black background | 29,110 | 13,053 | 44.8 |
| Other ethnic groups - Chinese | 50,513 | 29,989 | 59.4 |
| Other ethnic groups - any other ethnic group | 94,472 | 49,958 | 52.9 |
| Ethnicity not stated | 226,742 | 140,839 | 62.1 |
| Ethnicity code not recorded (no code) | 261,318 | 144,840 | 55.4 |
| Ethnicity not given - patient refused | 43,435 | 26,218 | 60.4 |
| Ethnicity code is a non-2001 ethnicity code | 986,533 | 734,542 | 74.5 |
| Total | 11,624,218 | 8,659,701 | 74.5 |
For those aged 65 years and over, when grouped by ethnicity at a national level, only one ethnic group was higher than the national average vaccine uptake of 74.5%, which was White - British (Table 12a). This group was 4.2 percentage points higher than average. The 6 groups with the lowest uptake (ranging from 39.3% to 48.6%) were:
- Asian or Asian British - Pakistani group (45.0%)
- Black or Black British - Caribbean (39.3%)
- Black or Black British - African (42.0%)
- Black or Black British - any other Black background (44.8%)
- Mixed - White and Black Caribbean (48.6%)
- Mixed - White and Black African (47.1%)
All Black and Mixed Black groups had uptake below 49.0%, with percentage point differences below the national average ranging from 25.9 to 35.2. The ‘Asian or Asian British - Pakistani’ group was 29.5 percentage points lower than average.
Patients in clinical risk groups aged 16 to under 65 years by ethnicity
All those aged 6 months to under 65 years in clinical risk groups are eligible for the national programme. However, in this section of the report, a subset of the data for those aged 16 to under 65 years is given. This accounts for the difference in total percentages for all of England in this section (Table 12b) (39.7% compared with 40.6% in Table 2 and Table 3 which is for all patients aged 6 months to under 65 years).
Table 12b. Seasonal influenza vaccine uptake in those 16 to under 65 years in a clinical risk group by ethnicity group in England in the 2025 to 2026 season
| Ethnic group | Number of patients registered aged 16 to under 65 years in a clinical risk group | Number of patients vaccinated aged 16 to under 65 years in a clinical risk group | Vaccine uptake (%) |
|---|---|---|---|
| White - British | 5,523,505 | 2,447,705 | 44.3 |
| White - Irish | 49,732 | 20,912 | 42.0 |
| White - Other | 533,091 | 144,434 | 27.1 |
| Mixed - White and Black Caribbean | 47,913 | 11,709 | 24.4 |
| Mixed - White and Black African | 39,463 | 11,482 | 29.1 |
| Mixed - White and Asian | 32,301 | 12,110 | 37.5 |
| Mixed - any other mixed background | 69,539 | 21,874 | 31.5 |
| Asian or Asian British - Indian | 314,004 | 122,323 | 39.0 |
| Asian or Asian British - Pakistani | 307,587 | 77,113 | 25.1 |
| Asian or Asian British - Bangladeshi | 124,715 | 50,680 | 40.6 |
| Asian or Asian British - any other Asian background | 200,808 | 81,647 | 40.7 |
| Black or Black British - Caribbean | 101,681 | 21,994 | 21.6 |
| Black or Black British - African | 285,628 | 83,979 | 29.4 |
| Black or Black British - any other Black background | 72,017 | 18,333 | 25.5 |
| Other ethnic groups - Chinese | 43,584 | 18,519 | 42.5 |
| Other ethnic groups - any other ethnic group | 157,630 | 46,380 | 29.4 |
| Ethnicity not stated | 170,443 | 49,013 | 28.8 |
| Ethnicity code not recorded (no code) | 147,852 | 39,416 | 26.7 |
| Ethnicity not given - patient refused | 34,940 | 9,651 | 27.6 |
| Ethnicity code is a non-2001 ethnicity code | 645,050 | 243,336 | 37.7 |
| Total | 8,901,483 | 3,532,610 | 39.7 |
For those aged 16 to under 65 years in a clinical risk group, 90.7% were recorded with a 2001 code, 1.7% were recorded with no code and 7.2% with a non-2001 census code and 0.4% refused to give ethnicity. Vaccine uptake for those who refused to give their ethnicity data was 27.6%.
For those in clinical risk groups and aged 16 to under 65 years when grouped by ethnicity at a national level, 5 groups had vaccine uptake higher or equivalent to the national average of 39.7% (Table 12b):
- Asian and Asian British - Bangladeshi (40.6%)
- Asian and Asian British - any other Asian background (40.7%)
- White - British (44.3%)
- White - Irish (42.0%)
- Other ethnic groups - Chinese (42.5%)
The highest uptake was in the White - British group, which was 4.6 percentage points higher than average. The 5 groups with the lowest uptakes (ranging from 21.6% to 27.1%) were:
- Asian or Asian British - Pakistani (25.1%)
- Black or Black British - Caribbean (21.6%)
- Black or Black British - any other Black background (25.5%)
- Mixed - White and Black Caribbean (24.4%)
- White - Other (27.1%)
In these 5 groups the percentage point differences below the national average ranged from 12.6 to 18.1.
Pregnant women by ethnicity
For pregnant women, 92.3% were recorded with a 2001 code, 2.0% were recorded with no code and 5.4% with a non-2001 census code and 0.3% refused to give ethnicity. Vaccine uptake for those who refused to give their ethnicity data was 34.6% (Table 12c).
Table 12c. Seasonal influenza vaccine uptake in all pregnant women by ethnicity group in England in the 2025 to 2026 season
| Ethnic group | Number of pregnant women registered | Number of pregnant women vaccinated | Vaccine uptake (%) |
|---|---|---|---|
| White - British | 325,706 | 140,195 | 43.0 |
| White - Irish | 3,272 | 1,441 | 44.0 |
| White - Other | 55,545 | 16,090 | 29.0 |
| Mixed - White and Black Caribbean | 4,911 | 1,158 | 23.6 |
| Mixed - White and Black African | 4,595 | 1,455 | 31.7 |
| Mixed - White and Asian | 3,607 | 1,378 | 38.2 |
| Mixed - any other mixed background | 7,772 | 2,614 | 33.6 |
| Asian or Asian British - Indian | 38,139 | 16,966 | 44.5 |
| Asian or Asian British - Pakistani | 34,551 | 9,470 | 27.4 |
| Asian or Asian British - Bangladeshi | 14,131 | 5,066 | 35.9 |
| Asian or Asian British - any other Asian background | 22,204 | 9,224 | 41.5 |
| Black or Black British - Caribbean | 4,955 | 926 | 18.7 |
| Black or Black British - African | 32,701 | 10,309 | 31.5 |
| Black or Black British - any other Black background | 5,685 | 1,535 | 27.0 |
| Other ethnic groups - Chinese | 3,425 | 1,702 | 49.7 |
| Other ethnic groups - any other ethnic group | 20,735 | 6,263 | 30.2 |
| Ethnicity not stated | 11,247 | 3,587 | 31.9 |
| Ethnicity code not recorded (no code) | 13,114 | 4,184 | 31.9 |
| Ethnicity not given - patient refused | 1,989 | 689 | 34.6 |
| Ethnicity code is a non-2001 ethnicity code | 34,525 | 12,782 | 37.0 |
For pregnant women, when grouped by ethnicity at a national level, 5 groups had vaccine uptake higher or equivalent to the national average of 38.4% (Table 12c). The highest uptake, in the Other ethnic groups - Chinese, was 11.3 percentage points higher than average. The other groups reaching above average uptake were some White (British and Irish) and some Asian (Asian or Asian British - Indian; and any other Asian background) groups. The group with the lowest uptake (Black or Black British - Caribbean) was 19.7 percentage points lower than the national average. The 5 groups with the lowest uptake (ranging from 18.7% to 29.0%) were:
- Asian or Asian British - Pakistani (27.4%)
- Black or Black British - Caribbean (18.7%)
- Black or Black British - any other Black background (27.0%)
- Mixed - White and Black Caribbean (23.6%)
- White - Other (29.0%)
Pre-school children (aged 2 and 3 years) by ethnicity
For pre-school aged children, 91.3% were recorded with a 2001 code, 5.6% were recorded with no code and 2.8% with a non-2001 census code and 0.3% refused to give ethnicity. Vaccine uptake for those who refused to give their ethnicity data was 37.9%.
For those aged 2 and 3 years, when grouped by ethnicity at a national level, 5 groups had vaccine uptake higher than or equivalent to the national average of 44.2% (Table 12d). The highest uptake in the Other ethnic groups - Chinese, was 22.3 percentage points higher than average. The other groups reaching above average uptake were White - British and some Asian (Asian or Asian British - Indian; Mixed White and Asian; and any other Asian background) groups. The group with the lowest uptake (Black or Black British - Caribbean) was 26.4 percentage points lower than the national average. The 5 groups with the lowest uptake were:
- Asian or Asian British - Pakistani (23.5%)
- Black or Black British - Caribbean (17.8%)
- Black or Black British - any other Black background (29.8%)
- Mixed - White and Black Caribbean (38.7%)
- White - Other (29.5%)
In these 5 groups, the percentage point difference below the national average ranged from 14.4 to 26.4.
Table 12d. Seasonal influenza vaccine uptake in those aged 2 and 3 years by ethnicity group in England in the 2025 to 2026 season
| Ethnic group | Number of patients registered aged 2 and 3 years | Number of patients vaccinated aged 2 and 3 years | Vaccine uptake (%) |
|---|---|---|---|
| White - British | 619,102 | 310,913 | 50.2 |
| White - Irish | 3,189 | 1,355 | 42.5 |
| White - Other | 95,343 | 28,110 | 29.5 |
| Mixed - White and Black Caribbean | 15,666 | 4,182 | 26.7 |
| Mixed - White and Black African | 12,080 | 4,676 | 38.7 |
| Mixed - White and Asian | 16,458 | 8,272 | 50.3 |
| Mixed - any other mixed background | 31,203 | 11,539 | 37.0 |
| Asian or Asian British - Indian | 51,842 | 27,883 | 53.8 |
| Asian or Asian British - Pakistani | 55,252 | 12,982 | 23.5 |
| Asian or Asian British - Bangladeshi | 19,729 | 6,503 | 33.0 |
| Asian or Asian British - any other Asian background | 33,608 | 15,584 | 46.4 |
| Black or Black British - Caribbean | 7,179 | 1,276 | 17.8 |
| Black or Black British - African | 47,956 | 19,391 | 40.4 |
| Black or Black British - any other Black background | 11,430 | 3,408 | 29.8 |
| Other ethnic groups - Chinese | 4,668 | 3,104 | 66.5 |
| Other ethnic groups - any other ethnic group | 34,597 | 11,507 | 33.3 |
| Ethnicity not stated | 27,841 | 11,338 | 40.7 |
| Ethnicity code not recorded (no code) | 66,485 | 26,633 | 40.1 |
| Ethnicity not given - patient refused | 3,960 | 1,502 | 37.9 |
| Ethnicity code is a non-2001 ethnicity code | 33,703 | 16,179 | 48.0 |
| Total | 1,191,291 | 526,337 | 44.2 |
Vaccine uptake by deprivation
Vaccine uptake by deprivation is presented below using indices of multiple deprivation 2025 (IMD) deciles for the following cohorts: aged 65 years and over; aged 16 to under 65 years in clinical risk groups; and pregnant women. GP postcode is used as a proxy for the IMD of the patients in the practice, therefore caution is advised.
Vaccinations in these groups all show the same trend where vaccine uptake is highest in the least deprived areas and the lowest uptake in the most deprived areas (Table 13). The largest difference in vaccine uptake by IMD is in pregnant women Figure 9c. This varies by 15.6 percentage points, compared with 12.6 percentage points in those aged 65 years and over Figure 9a; and 12.3 percentage points in those aged 16 to under 65 years who are in clinical risk groups Figure 9b.
Table 13. Seasonal influenza vaccination uptake in those aged 65 years and over, those aged 16 to under 65 years in a clinical risk group and all pregnant women by index of multiple deprivation in England in the 2025 to 2026 season
| Index of multiple deprivation | Target group influenza vaccination uptake (%) aged 65 years and over | Target group influenza vaccination uptake (%) aged 16 to under 65 years in clinical risk groups | Target group influenza vaccination uptake (%) all pregnant women |
|---|---|---|---|
| 1 (most deprived) | 67.5 | 33.7 | 30.7 |
| 2 | 69.6 | 36.2 | 34.5 |
| 3 | 72.5 | 38.4 | 37.3 |
| 4 | 74.1 | 39.6 | 38.6 |
| 5 | 75.4 | 41.2 | 40.4 |
| 6 | 76.9 | 42.6 | 41.7 |
| 7 | 76.8 | 42.4 | 42.2 |
| 8 | 78.2 | 44.2 | 44.1 |
| 9 | 78.8 | 44.5 | 44.6 |
| 10 (least deprived) | 80.1 | 46.0 | 46.3 |
Deprivation by those aged 65 years and over
Vaccine uptake by IMD varies by region in those aged 65 years and over (Figure 9a). The largest variation by IMD is seen in the London region where vaccine uptake is 24.8 percentage points lower in the most deprived group compared with the least deprived group. The region with the least variation by IMD was in the South West region with around 7.6 percentage points variation between the least and most deprived groups (Figure 8a).
Figure 9a. Seasonal influenza vaccine uptake in those aged 65 years and over by index of multiple deprivation decile in each NHS commissioning region in England in the 2025 to 2026 season
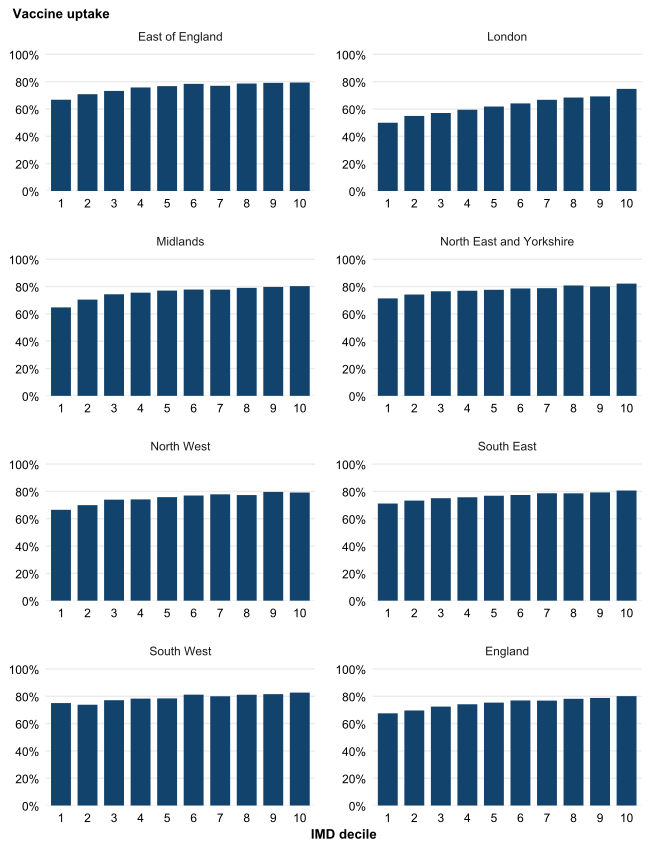
Note: 1 to 10 is a scale for the IMD, with 1 being the most deprived and 10 being the least deprived.
Deprivation by those in clinical risk groups and aged 16 to under 65 years
All those aged 6 months to under 65 years in clinical risk groups are eligible for the national programme. However, in this section of the report, a subset of the data for those aged 16 to under 65 years is given. Vaccine uptake by IMD varies by region in those aged 16 to under 65 years and in clinical risk groups (Figure 9b). The largest variation by IMD is seen in the London region, where vaccine uptake is 14.0 percentage points lower in the most deprived group compared with the least deprived groups. The regions with the least variation by IMD was in the South East region with around 7.6 percentage points variation between the least and most deprived groups (Figure 9b).
Figure 9b. Seasonal influenza vaccine uptake in those aged 16 to under 65 years in a clinical risk group by index of multiple deprivation decile in each NHS commissioning region in England in the 2025 to 2026 season
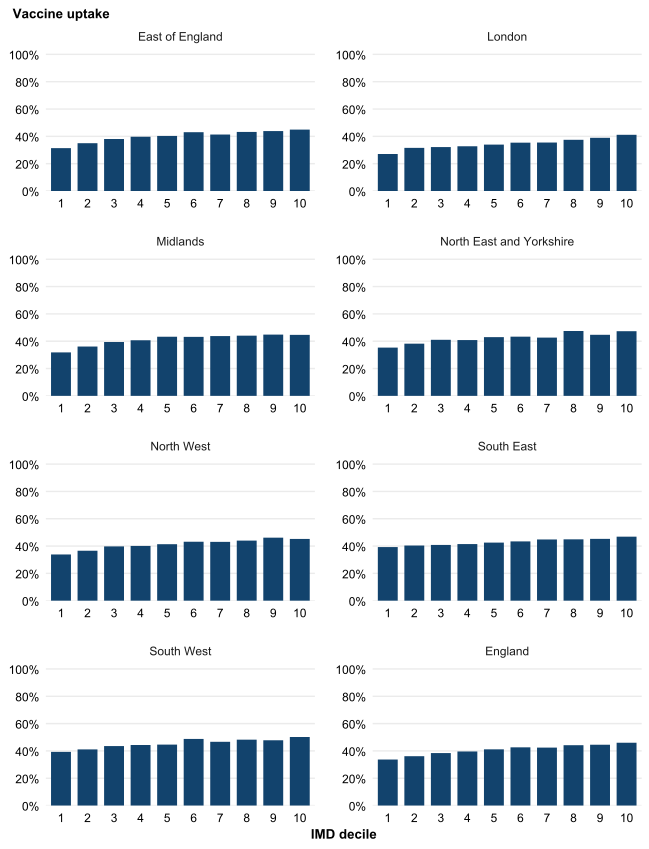
Note: 1 to 10 is a scale for the IMD, with 1 being the most deprived and 10 being the least deprived.
Deprivation by pregnant women
Vaccine uptake by IMD varies by region in all pregnant women (Figure 9c), the largest variation by IMD is seen in the London region where vaccine uptake is 20.8 percentage points lower in the most deprived cohort compared with the least deprived group. The region with the least variation by IMD was the South East region with 10.0 percentage points variation between the least and most deprived groups (Figure 9c).
Figure 9c. Seasonal influenza vaccine uptake in all pregnant women by index of multiple deprivation decile in each NHS commissioning region in England in the 2025 to 2026 season

Note: 1 to 10 is a scale for the IMD, with 1 being the most deprived and 10 being the least deprived.
Vaccine type
Vaccine type was introduced to the GP survey in 2018 to 2019 as experimental data. For the influenza vaccines advised by the Joint Committee on Vaccination and Immunisation (JCVI) for each age group, see the sub-section Vaccine type in the Data sources and methodology.
For those aged 65 years and over, this season, vaccine type data was available for 99.8% of those vaccinated. Despite the high return, only 51.5% had vaccinations which were coded with a defined vaccine type (48.3% were entered into the GP record as vaccine type not stated) (Table 14a). Therefore, caution should be used when interpreting the data.
For those aged 65 years and over, where vaccine type was provided (51.5%), 96.2% received the recommended JCVI preferred vaccines. Adjuvanted inactivated influenza vaccine (aIIV) was administered to 82.4%, with an additional 11.5% vaccinated with recombinant inactivated influenza vaccine (IIVr). Additionally, 2.3% were vaccinated with the high-dose inactivated influenza vaccine (IIV-HD), see Table 14b. Cell-cultured inactivated influenza vaccine (IIVc) was administered to 3.7%. Egg-cultured inactivated influenza vaccine (IIVe), which was not advised by the JCVI for those aged 65 years and over, was given to 0.1%.
Table 14a. Data quality for vaccine type recorded in the GP record for seasonal influenza vaccines in patients aged 65 years and over during the 2025 to 2026 season
| Vaccine type | Percentage of those aged 65 years or older (%) |
|---|---|
| Vaccine type specified | 51.5 |
| Recorded as vaccine type not stated | 48.3 |
| No vaccine type data in the GP record | 0.2 |
Note 1: vaccine type data was available for 99.8% of those vaccinated (vaccine type specified (51.5% and vaccine type not stated (48.3%)).
Table 14b. Seasonal influenza vaccinations given by vaccine type in patients aged 65 years and over during the 2025 to 2026 season
| Vaccine type (JCVI preferred vaccines listed in alphabetical order) | Percentage of those vaccinated aged 65 years or older where vaccine type is specified (%) |
|---|---|
| Adjuvanted inactivated influenza vaccine (aIIV) | 82.4 |
| High-dose inactivated influenza vaccine (IIV-HD) | 2.3 |
| Recombinant inactivated influenza vaccine (IIVr) | 11.5 |
| Cell-cultured inactivated influenza vaccine (IIVc) [note 1] | 3.7 |
Note 1: non-JCVI preferred vaccine for this age group.
All those aged 6 months to under 65 years in clinical risk groups are eligible for the national programme, however, in this section of the report, a subset of the data for those aged 16 to under 65 years is given.
For those aged 16 to under 65 years in a clinical risk group, this season data was available for 99.1% of those vaccinated, of which 48.0% had vaccinations coded with a defined vaccine type (51.1% were entered into the GP record as vaccine type not stated), (Table 14c). Therefore, caution should be used when interpreting the data.
For those aged 16 to under 65 years in a clinical risk group, where vaccine type was provided, 97.7% received the recommended JCVI preferred vaccines (77.9% received IIVc and 12.2% received IIVr). Both aIIV and IIV-HD were advised in a subset of this group with vaccine uptake at 7.3% and 0.3% respectively; see Table 14d. A further 2.3% were vaccinated with the IIVe.
Table 14c. Data quality for vaccine type recorded in the GP record for seasonal influenza vaccines in patients aged 16 to under 65 years and in one or more clinical risk groups during the 2025 to 2026 season
| Vaccine type | Percentage of those vaccinated aged 16 to under 50 years and in a clinical risk group (%) | Percentage of those vaccinated aged 50 to under 65 years and in a clinical risk group (%) | Percentage of those vaccinated aged 16 to under 65 years and in a clinical risk group (%) |
|---|---|---|---|
| Vaccine type specified | 46.0 | 49.1 | 48.0 |
| Recorded as vaccine type not stated | 51.8 | 50.7 | 51.1 |
| No vaccine type data in the GP record | 2.1 | 0.2 | 0.9 |
Note 1: vaccine type data was available for 99.1% of those vaccinated (vaccine type specified (48.0% and vaccine type not stated (51.1%)).
Table 14d. Seasonal influenza vaccinations given by vaccine type in patients aged 16 to under 65 years and in one or more clinical risk groups during the 2025 to 2026 season
| Vaccine type (JCVI preferred vaccines listed in alphabetical order) | Percentage of those vaccinated aged 16 to under 50 years and in a clinical risk group (%) | Percentage of those vaccinated aged 50 to under 65 years and in a clinical risk group (%) | Percentage of those vaccinated aged 16 to under 65 years and in a clinical risk group (%) |
|---|---|---|---|
| Cell-cultured inactivated influenza vaccine (IIVc) | 85.2 | 73.6 | 77.9 |
| Recombinant inactivated influenza vaccine (IIVr) | 12.1 | 12.3 | 12.2 |
| Adjuvanted inactivated influenza vaccine (aIIV) [note 1] | [note 4] | 11.6 | 7.3 |
| High-dose inactivated influenza vaccine (IIV-HD) [note 2] | [note 4] | 0.4 | 0.3 |
| Egg-cultured inactivated influenza vaccine (IIVe) [note 3] | 2.7 | 2.1 | 2.3 |
Note 1: advised for those aged 50 years and over.
Note 2: advised those aged 60 years and over.
Note 3: non-JCVI preferred vaccine for this age group.
Note 4: data not collected.
The number of live attenuated influenza vaccine (LAIV) vaccinations recorded for patients aged 2 and 3 years have been collected as an experimental cohort for the last 6 seasons. Vaccine type was provided for 94.4% of GP practices responding, with no vaccine type recorded in 5.6% (Table 15a). For all those aged 2 and 3 years who were vaccinated, 92.7% were reported as receiving LAIV (Table 15b).
Table 15a. Data quality for vaccine type recorded in the GP record for seasonal influenza vaccines in patients aged 2 and 3 years during the 2025 to 2026 season
| Vaccine type | All aged 2 and 3 years |
|---|---|
| Vaccine type specified | 94.4 |
| No vaccine type data in the GP record | 5.6 |
Table 15b. The proportion of LAIV vaccinations in those aged 2 and 3 years in from 2019 to 2020 season to 2025 to 2026 season
| All aged 2 and 3 years | 2025 to 2026 | 2024 to 2025 | 2023 to 2024 | 2022 to 2023 | 2021 to 2022 | 2020 to 2021 | 2019 to 2020 |
|---|---|---|---|---|---|---|---|
| Percentage of all vaccinated who received LAIV | 92.7 | 95.3 | 93.7 | 96.2 | 97.5 | 92.1 | 96.2 |
Glossary
Child GP survey
The seasonal influenza vaccination uptake survey that collects the child cohort data.
Clinical risk groups
Patients in clinical risk groups, as listed in the Influenza: the Green Book, chapter 19.
dm+d
Dictionary of medicines and devices.
Green Book
The Green Book, also known as Immunisation against infectious disease, is a UKHSA publication on vaccines, vaccine-preventable infectious diseases and vaccination procedures. Chapter 19 refers to influenza.
ImmForm
ImmForm is a website that provides a secure online platform for vaccine uptake data collection for several immunisation surveys, including the seasonal influenza vaccine uptake collection.
Main GP survey
The seasonal influenza vaccine uptake survey that collects data on all adult cohorts and children in clinical risk groups.
School-age year
The school-age year is determined by their age on the 31 August 2025. This will be correct for the majority of children.
SNOMED CT codes
Systematized Nomenclature of Medicine Clinical Terminology. This is a structured clinical vocabulary for use in electronic health records.
Data sources and methodology
Prior to the start of the seasonal data collection, the seasonal influenza surveillance team produce a data set for the collection. The team commissioned PRIMIS to write an accompanying coding specification for GP system suppliers (GPSS) to extract the data from GP practices. The PRIMIS specification provides rules for the extraction of the data from GP systems using the following clinical code terminologies: Systematized Nomenclature of Medicine Clinical Terminology (SNOMED CT).
Cumulative data on seasonal influenza vaccine uptake was collected for all GP practices responding to automated collections in England between 1 September 2025 to 28 February 2026 using the ImmForm website.
The data collections consist of:
- a weekly sentinel survey using an automated extraction only (XML bulk upload or a web service)
- 5-monthly surveys starting with a collection covering the 1 September 2025 up to 31 October which is then refreshed each month up until the end of February 2026.
GP-practice level data was submitted to the ImmForm website either via an automated extraction provided by GPSS (who extract data directly from GP practice systems) or via manual upload, across England. Automated data extraction results in almost no burden on GP practices providing the data. The weekly data allows near ‘real-time’ monitoring of the programme at a national level from calendar week 36 (week ending 7 September 2025) to calendar week 4 (week ending 25 January 2026).
The vaccine uptake figures reported here are based on the practices which have supplied data. This report includes extrapolated estimates of the total eligible population and the total number vaccinated in each cohort, if there was a 100% response rate to the survey.
The extrapolated number of vaccinations is derived by multiplying the mean number of vaccinations per practice by the total number of practices. This calculation assumes that the GP-practice population is the same across all practices and that the uptake rate is the same as that seen nationally.
Mean calculations are based on sub-ICB level data. There were no configuration changes between ICBs and sub-ICBs for 2025 to 2026 season.
In the 2021 to 2022 and the 2022 to 2023 seasons an additional survey was added for September. February surveys were introduced as an experimental collection in 2017 to 2018, extending the data collection period by a month to allow for better inclusion of data returning from outside the practice and later in-practice vaccinations. Following the evaluation, the February collection was adopted for the end of season figures.
ImmForm
Influenza vaccine uptake data is submitted via the ImmForm website. Data is submitted at GP practice level and can then be aggregated as required to the different hierarchies such as sub-ICB, ICB or local authority. During the season, specific functions were available weekly and monthly on ImmForm to enable local management of the vaccination programme. These functions include the ability to:
- view and evaluate influenza vaccine uptake rates by cohort and age band for their area down to the GP practice level
- compare GP-practice level data within the sub-ICB and to previous years
- validate data at point of data entry
- download ‘non-responder’ reports to aid local areas following up GP practices that have yet to respond to the survey
Indices of multiple deprivation (IMD)
The English indices of deprivation (IoD25) measure relative levels of deprivation in 33,755 small areas or neighbourhoods, called Lower-layer Super Output Areas (LSOAs), covering all of England. The 2025 release updates the 2019 release used in previous annual publications. The IoD25 suite of resources comprises of 7 standalone indexes which assess income, employment, education, health, crime, barriers to housing and services and living environment. These indexes are combined and weighted together to form the Index of Multiple Deprivation 2025 (IMD 2025), which is the official measure of deprivation in England. These scores are then grouped into deciles, with 1 being the most deprived areas and 10 being the least deprived areas. For this report, GP postcode for responding practices was used as a proxy for patient address and mapped to IMD 2025 deciles to calculate uptake by decile.
Data validation
Data validations are built into the ImmForm website to validate at point of entry. Data is then further validated by the UKHSA influenza surveillance team on a weekly and monthly basis. PRIMIS are commissioned by UKHSA to write the clinical code specification for the surveys and commissioned to conduct 2 data validation reports to check alignment with the clinical code specification.
Data limitations
Denominator data for some localities and clinical risk groups should be interpreted with caution due to data validation and data quality issues. A summary of these limitations is provided below.
Snapshot of influenza vaccine uptake data
Seasonal influenza vaccine uptake data presented in this report is a snapshot of GP-registered patients vaccinated at the time of data extraction. The annual report includes data up until the end of February to allow time for data to flow from other services to the GP record when vaccines are delivered in other settings. Patients who are vaccinated but have not had their electronic patient record updated by the time of data extraction, will be included within the denominator, but will not be included in the count of ‘number vaccinated’. This data will, therefore, not include patients in the numerator or denominator who have received the vaccine but have subsequently died; or changed clinical status (for example, ‘joining’ or ‘leaving’ a clinical risk group); or patients changing carer status; and ‘temporary’ patients who may have received the vaccine but were not registered on the date of data extraction. The extract will also exclude the prison population unless the individuals were registered with a GP practice at the time of data extraction and their vaccination details were recorded on their primary care electronic record. Healthcare workers and social care workers will only be counted in the number vaccinated if they were vaccinated at the GP practice or their vaccination details were entered on their GP practice’s electronic record.
Transition to SNOMED CT
In the 2019 to 2020 season all GPSS in England moved over to SNOMED CT. However, some GPSS are still working with older versions of SNOMED CT. Because of the transition, mapping errors between SNOMED CT and previous clinical terminologies are being identified and corrected across GPSS but small numbers of mapping issues may remain.
Despite these data limitations, the granular data is considered valid with a degree of caution, especially when drawing comparisons to historical data where they may be affected by the SNOMED transition.
Clinical coding changes
It is important to note that clinical coding frequency can increase or decrease depending on the coding behaviour of GP practices and other NHS organisations; and the definitions used to extract the data. These changes in coding frequency can be driven by policies such as changes to the Quality Outcomes Framework (QOF) or the introduction of new initiatives to drive better quality of data through better coding of data. Changes to the coding can greatly affect smaller groups such as the data we collect on individual clinical risk groups. We monitor this each year by looking at the prevalence of each risk group within the general population and the clinical risk population while considering any wider changes to the health system that may impact the data.
Pregnant women: denominator variance
Determining an accurate denominator for eligible pregnant women is challenging because of the complexities in the way pregnancy is recorded and coded on local clinical systems in primary care. In addition, in recent years, seasonal influenza vaccine for pregnant women has increasingly been delivered through midwifery services and pharmacies (supplementary data Table 16) and so vaccination data needs to flow back to the GP record in the appropriate format to allow capture in the ImmForm collection.
Reported influenza vaccine coverage in pregnant women is likely to be an underestimate for the following reasons:
- the dynamic nature of the denominator with women continually entering and leaving the cohort throughout the season through conception, miscarriage, abortion or delivery
- there are multiple ways to record ‘pregnancy’ in the GP record with a range of SNOMED codes available
- delay or gaps in data flows that allow capture of vaccines delivered outside the GP practice
The scale of the underestimation is not clear and could vary between GP practices and regions.
Vaccination in other healthcare settings
The number of individuals vaccinated in a school, pharmacy and other healthcare setting was captured by the survey. It is important to note that the evaluation of vaccines delivered outside of GP practice does not come under an existing information standard therefore the quality of location recording may vary between GP practices and GPSS. In 2025 to 2026, pharmacies were commissioned to administer seasonal influenza vaccinations to:
- any patient aged 18 to under 65 years in a clinical risk group
- pregnant women
- carers
- people living in long-stay residential care homes or other long stay care facilities
- close contacts of immunocompromised individuals
- some community pharmacies administer seasonal influenza vaccinations to those aged 2 and 3 years
They were also commissioned to administer seasonal influenza vaccinations to frontline health and social care staff employed by:
- a registered residential care or nursing home
- registered domiciliary care provider
- a voluntary managed hospice provider
- direct payment (personal budgets) and/or personal health budgets, such as personal assistants
While the number of vaccinations reported as given in pharmacies can be taken as correct because there is a specific clinical code associated with this, there is likely to be a lag in data being fed back into the GP record.
There was a coding discrepancy between the GP IT system suppliers for those aged 2 to 4 years vaccinated outside the GP setting; therefore, vaccination percentages for pharmacy and other healthcare settings must be interpreted with caution for those aged 2 and 3 years. For this age group percentages for other healthcare settings may be overestimated and percentages for pharmacies may be underestimated.
For the 2025 to 2026 season some NHS school aged immunisation service providers offered vaccinations to eligible 2 and 3 years olds in nurseries on primary school premises. This would be recorded as an other healthcare setting.
As expected, vaccination delivered in other healthcare settings is much higher for the pregnant cohort because of increasing administration by midwifery services. The vast majority of school-aged children are vaccinated in school and therefore in the survey vaccines recorded in these age groups are assumed to be school-delivered in the survey unless specifically coded as ‘vaccinated in a pharmacy’. As data flows from school-aged immunisation services (SAIS) and the Child Health Information Systems (CHIS) to the GP record are not yet well established, vaccination data for the school-aged cohorts in the GP survey remain experimental. Improved data flows from other healthcare settings to the GP record are important to both reduce the administrative burden on GP practices and ensure timely and accurate vaccine coverage can be reported for all eligible cohorts. Results for the LAIV programme in primary and secondary school-aged children will be available in a separate report based on manual returns from local NHS teams. The national childhood influenza vaccination programme report is available online.
Vaccine type
Vaccine type can be coded using dictionary of medicines and devices (dm+d) codes and SNOMED CT codes. All GPSS in England have now moved over to SNOMED CT clinical terminology. Vaccine type was introduced to the GP survey in the 2018 to 2019 season and the experimental data collected thus far show that this information is not routinely recorded in the required coded format to allow extraction. The information is likely to be recorded in the GP record as free text and therefore not extractable using a clinical code specification. We expect this variable to become better recorded in the future.
Social care workers
Vaccine uptake in social care workers was included for the first time in the 2019 to 2020 data collection. The SNOMED CT codes for this workforce were introduced on the 1 April 2018 but appear to be poorly applied in the GP record therefore the denominator estimate in the survey is not currently reliable.
There are a range of options for employers offering the vaccine to social care workers which makes this group particularly difficult to evaluate. Only a minority will get vaccinated through their GP practice. Data flows for vaccinations delivered to social care workers outside of the GP setting are not well established, therefore, caution should be used when interpreting the data.
Learning disability
Vaccine uptake in those with wider learning disabilities including severe learning disability as a subset of this cohort was included for the first time in the 2020 to 2021 season as an experimental cohort and continues to be included in the 2025 to 2026 season. The clinical coding specification is defined within the PRIMIS specification. The wider learning disability cohort includes all those on the QOF learning disability register and a small number of additional patients with other learning disability coding. The clinical codes related to severe learning disability are also still included within the chronic neurological disease clinical risk group and therefore comparable to previous years. Please note that those who have a wider learning disability with no other clinical risk group are not included in the overall clinical risk category data.
Vaccine type
Influenza vaccines advised for the 2025 to 2026 season are outlined in the statement from the JCVI and in this UKHSA visual guide on flu vaccines (PDF).
For vaccination of adults 18 to 64 years of age in an at-risk group and pregnant women, JCVI advises the use of the following influenza vaccines (listed in alphabetical order):
- inactivated influenza cell-culture vaccine (IIVc)
- inactivated recombinant influenza vaccine (IIVr)
- the adjuvanted inactivated influenza vaccine for those aged 50 to 64 years
- the high dose influenza vaccine for those aged 60 to 64 years
The inactivated influenza egg-culture vaccine (IIVe) can also be considered for use in this age group if all other options are unavailable.
For vaccination of those aged 65 years and over, JCVI advises the use of the following vaccines (listed in alphabetical order):
- adjuvanted inactivated influenza vaccine (aIIV)
- high-dose inactivated influenza vaccine (IIV-HD)
- recombinant inactivated influenza vaccine (IIVr)
The inactivated influenza cell-culture vaccine (IIVc) can also be considered for use in this age group if JCVI preferred vaccines are not available.
The inactivated influenza egg-culture vaccine (IIVe) is not advised for use in this age group.
For children aged 2 to less than 18 years of age, JCVI advises the influenza vaccines below in the following order of preference:
- Live attenuated influenza vaccine (LAIV).
- Inactivated influenza cell-culture vaccine (IIVc) (where LAIV is medically contraindicated or otherwise unsuitable).
For vaccination of children less than 2 years of age in an at-risk group, JCVI advises the use of the inactivated influenza cell-culture vaccine (IIVc).
The inactivated influenza egg-culture vaccine (IIVe) can also be considered for use in this age group, if all other options are unavailable, but is not supplied by ImmForm.
Background information
The purpose of the national seasonal influenza immunisation programme in England is to offer protection to those who are most at risk of serious illness or death should they develop influenza.
In 2012, the JCVI recommended the implementation of a universal childhood influenza vaccine programme with LAIV. The childhood LAIV programme was introduced in 2013 to 2014 and progressively expanded across year groups in a phased implementation. In the 2025 to 2026 season, LAIV was offered to all those aged 2 and 3 years through primary care. It was also offered through a largely school-based programme to primary school-aged children (reception to year 6) and secondary school-aged children (years 7 to 11). The aim of the childhood programme is to both directly protect children and reduce influenza transmission. This provides indirect protection to the rest of the population, including those at increased risk of the severe consequences of influenza infection.
NHS England, through ICBs and regional public health commissioning teams, has responsibility for commissioning the influenza programme with GP practices, midwives and other healthcare professionals. Immunisation managers and coordinators in NHS teams play a significant role in delivery within their ICBs.
GP practices provide monthly coverage data between September and February, with most practices providing this through automated uploads from their electronic clinical systems. For 2021 to 2022 and 2022 to 2023, an additional collection was published in October (for all vaccination activity between 1 and 30 September). This was not continued from 2023 to 2024 onwards. Automated extraction provides near-complete data, with many practices also contributing data weekly, and gives consistent data for comparisons over time. The UKHSA influenza surveillance team has responsibility for collating the data and reporting on the progress in the uptake of the seasonal influenza vaccine. The ImmForm website enables the monitoring, tracking and reporting on provisional vaccine uptake on a weekly and monthly basis during the influenza season.
The seasonal influenza vaccine uptake survey in GP-registered patients was first split into the ‘main GP Survey’ and the ‘child GP survey’ in the 2017 to 2018 season. Data presented in this report and accompanying tables is for the end-of-season data, up to the end of February in England.
The data counts the cumulative number of GP-registered patients who have had at least one dose of influenza vaccine from 1 September 2025 to 28 February 2026. The survey does not include vaccinations given to patients who have since moved practice or who have died, but does include those vaccinated by another healthcare provider (provided the GP patient electronic record is updated). This end-of-season report provides the final seasonal influenza vaccine uptake figures in GP-registered patients. This data is collated for public health surveillance purposes only and this system is not designed to support GP-practice payments.
The programme for 2025 to 2026 was announced in the annual flu letter jointly issued to the NHS by UKHSA, the Department of Health and Social Care (DHSC) and NHS England (NHSE) on 13 February 2025 (with an amendment published on 28 July 2025 outlining community pharmacies would be able to offer those aged 2 and 3 years flu vaccinations during the 2025 to 2026 flu season). In February 2025 it was recommended that influenza vaccine be offered to:
- all children aged 2 and 3 years
- all children of school age in years reception to year 6 (aged 4 years rising to 10 years)
- secondary school-aged children (year 7 to year 11) (aged 11 years rising to 16 years)
- those aged 65 years and over
- those aged 6 months to under 65 years in clinical risk groups
- pregnant women
- those in long-stay residential care homes
- carers (as defined in Influenza: the green book, chapter 19)
- close contacts of immunocompromised individuals
- frontline health and social care staff
As in the previous season (2024 to 2025) for the 2025 to 2026 programme the letter also advised on the timing of programme delivery. This was based on the evidence that seasonal influenza vaccine’s effectiveness can wane over time in adults. The JCVI therefore advised moving the start of the programme for most adults to the beginning of October. This was on the understanding that the majority of the vaccinations would be completed by the end of November, closer to the time that the influenza season commonly starts. It is preferable to vaccinate individuals closer to the time when the flu virus is likely to circulate (which typically peaks in December or January), as this will provide optimal protection during the highest risk period. As influenza circulation in children normally precedes that in adults, the JCVI agreed that the children’s programme should continue to start in September as early as delivery and supply allows. No change in the timing of the offer for the maternal programme. It was also advised that all frontline health care workers, including both clinical and non-clinical staff who have contact with patients, should be offered seasonal influenza vaccine from October.
The national vaccine uptake ambition for 2025 to 2026 was to demonstrate a 100% offer to eligible groups and to achieve equal or above the uptake levels of 2024 to 2025 for each cohort. Providers were also asked to ensure they have robust plans in place to identify and address health inequalities for all underserved groups, and it was expected progress will be made on reducing unwarranted variation and improving uptake.
Further information and contact details
You are welcome to contact us directly by emailing influenza@ukhsa.gov.uk with any feedback you may have about this report and data.
Acknowledgements
The authors would like to thank everyone that contributed to the data collection, specifically:
- all those who participated in and supported the influenza vaccine uptake collection (GP patient survey), principally GP practice data providers, NHSE regional public health commissioning teams, screening and immunisation teams and screening and immunisation influenza coordinators in England
- the participation of GP IT system suppliers and third-party suppliers in providing the reporting tools and services for their customers; in particular EMIS and TPP, who enabled automated extracts of data
- the participation of the PRIMIS team based in Nottingham, which was commissioned to provide the SNOMED CT Codes specification for this collection
- the ImmForm helpdesk and development team that provided and supported the online survey
Official statistics
Our statistical practice is regulated by the Office for Statistics Regulation (OSR). OSR sets the standards of trustworthiness, quality and value in the Code of Practice for Statistics that all producers of official statistics should adhere to.
UKHSA is committed to ensuring that these statistics comply with the Code of Practice for Statistics. This means users can have confidence in the people who produce UKHSA statistics because our statistics are robust, reliable and accurate. Our statistics are regularly reviewed to ensure they support the needs of society for information.
UKHSA has conducted a formal review of these statistics. Following this review, an implementation plan has been developed to continue to improve the trustworthiness, quality, and value of these statistics. Key continuous improvements made will be highlighted within future releases of these statistics for transparency.