Sea Passenger Statistics: domestic sea passengers 2025
Published 29 July 2026

© Crown copyright 2026
This publication is licensed under the terms of the Open Government Licence v3.0 except where otherwise stated. To view this licence, visit nationalarchives.gov.uk/doc/open-government-licence/version/3 or write to the Information Policy Team, The National Archives, Kew, London TW9 4DU, or email: psi@nationalarchives.gov.uk.
Where we have identified any third party copyright information you will need to obtain permission from the copyright holders concerned.
This publication is available at https://www.gov.uk/government/statistics/sea-passenger-statistics-all-routes-2025/sea-passenger-statistics-domestic-sea-passengers-2025
About this release
This statistical release presents final statistics on sea passengers on domestic routes within the UK for 2025. Passengers on domestic routes include domestic sea crossings, domestic cruises, river ferries and inter-island journeys.
Domestic passengers cover a wide range of travel purposes and service types. Passengers are counted in the same way regardless of the reason for travel, but the journeys themselves can be very different. For example, some passengers use lifeline ferry services to access island communities in Scotland for work, education, healthcare and essential services, while others may be regular commuters travelling on passenger ferry services such as those operating on the River Thames. Domestic passenger totals also include leisure travel, such as domestic cruise and sightseeing trips.
These statistics include all vehicle drivers (including Heavy Goods Vehicle drivers), their passengers and foot passengers on ferries.
2025 release
Comparisons have been made with figures from 2024, as well as 2019, the last full year before the coronavirus pandemic started.
Definitions
River ferries: Figures for river ferries are collected annually from the operators. Routes are generally included in this statistical release when the passenger-km figure is greater than 500 passenger-kms. Most of the river ferry passengers are on journeys made along the River Thames. The notes and definitions accompanying this report have a breakdown of the routes that are included.
Inter-island: Covers routes between the mainland and UK islands, such as the Isles of Scilly or the Isle of Wight. It also covers internal ferry routes on loughs such as Strangford to Portaferry in Northern Ireland and routes between islands.
Major domestic crossings (short sea): includes all routes between Great Britain and Northern Ireland, Isle of Man and the Channel Islands.
Minor domestic crossings (short sea): all other short sea passenger routes including routes between Great Britain and Orkney and Shetland Islands.
Domestic cruise: passenger figures include all passengers on domestic cruises in the UK (with no cruise stops at foreign ports). These figures were collected for the first time in 2021 and can be found in table SPAS0201. Large domestic cruises did not previously occur but were a feature in 2021 when they were permitted under the domestic roadmap for England. This was the first stage of the wider restart of cruises following the industry’s pause during the coronavirus pandemic, with international cruises restarting from August 2021.
Headline figures
In 2025, domestic sea passenger numbers increased above 2024, however they remained below 2019 levels overall.
Domestic sea passenger numbers increased 2%, from 38.3 million in 2024 to 39.2 million in 2025. This follows a broadly stable trend in domestic sea passengers before 2019, a sharp decrease in 2020 due to the coronavirus pandemic and an upward trend since (chart 1).
Chart 1: UK domestic sea passengers, 2015 to 2025 (SPAS0201)
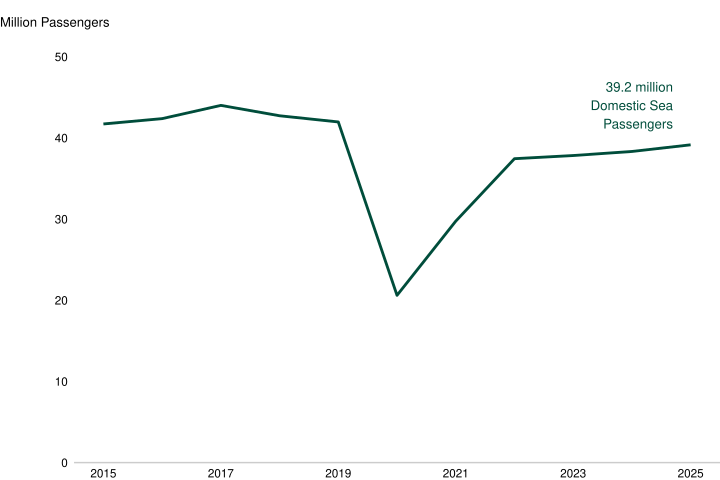
The total number of sea passengers on domestic routes comprises passengers on domestic sea crossings, domestic cruises, inter-island domestic routes and river ferries.
For domestic passengers in 2025:
-
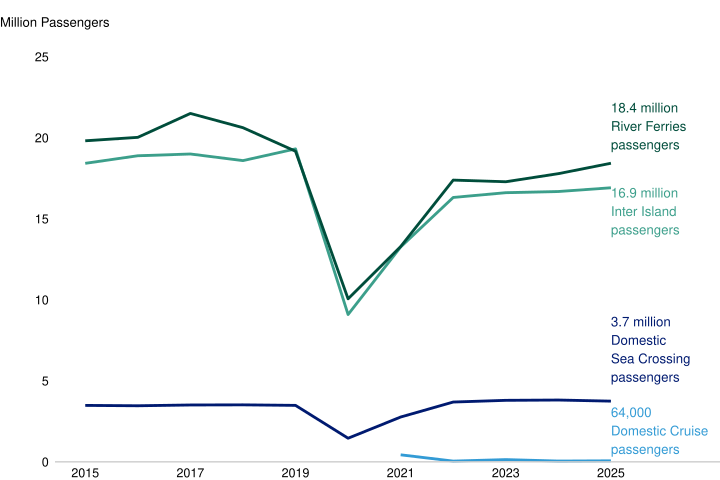
river ferries accounted for 18.4 million (47% of all domestic sea passengers), up 4% compared with 2024, but 4% lower than in 2019
-
inter-island services accounted for 16.9 million (43% of all domestic passengers), up 1% compared with 2024, but 12% lower than in 2019
-
domestic sea crossings accounted for 3.7 million passengers (10% of all domestic passengers), down 2% from 2024 and 8% higher than in 2019
-
domestic cruises accounted for 64,000 (less than 1% of all domestic passengers)
Chart 2: UK domestic sea passengers by type of route, 2015 to 2025(SPAS0201)
Passengers on river ferries
In 2025, there were 18.4 million passengers on river ferries, an increase of 4% compared with 2024 at 17.8 million passengers. This increase is driven largely by a 6% increase in passenger numbers on London services. This can be attributed to higher demand following the introduction of tolls at the Silvertown and Blackwall tunnels, alongside the introduction of a new operating model in May 2024 that expanded the service to a seven-day, two-vessel operation.
Data for one river ferry operator has been imputed since 2023, therefore no comparisons to pre 2023 have been made. The methodology for the imputation can be found in notes and definitions page.
Passengers on inter-island domestic routes
The number of passengers on inter-island journeys was stable from 2010 to 2019 but saw a large decrease from 19.3 million passengers in 2019 to 9.1 million in 2020. Passenger numbers recovered sharply until 2022, but have remained steady since at a level below 2019. In 2025, there were 16.9 million passengers, which is a 1% increase compared with 2024 and 12% below 2019 numbers.
There were 7.4 million passengers between Hampshire and the Isle of Wight in 2025, remaining stable with 2024 levels. Passengers on other inter-island routes combined saw an increase of 21% from 2024, largely driven by the Cowes-East Cowes route. This may reflect the return to normal service levels following planned maintenance works to the Cowes Floating Bridge in 2024.
In 2025, passengers on Scottish inter-island routes decreased 1% compared to 2024 passenger numbers. See the Transport Scotland Water Transport Statistics for further information, including figures for individual routes.
Passengers on domestic sea crossings
The number of passengers undertaking domestic sea crossings was relatively stable from 2010 to 2019. This dropped substantially from 3.5 million passengers in 2019 to 1.5 million in 2020 due to travel restrictions during the coronavirus pandemic. By 2022, passenger numbers on domestic sea crossings had recovered and, despite a 2% decrease compared with 2024, were 8% above 2019 levels in 2025, with 3.7 million passengers (chart 2).
Of all passengers on domestic sea crossings, 78% of passengers travelled on major domestic routes, with the remaining 22% of passengers travelling on minor domestic routes. These proportions are broadly consistent with previous years.
Passengers on major domestic routes (short sea)
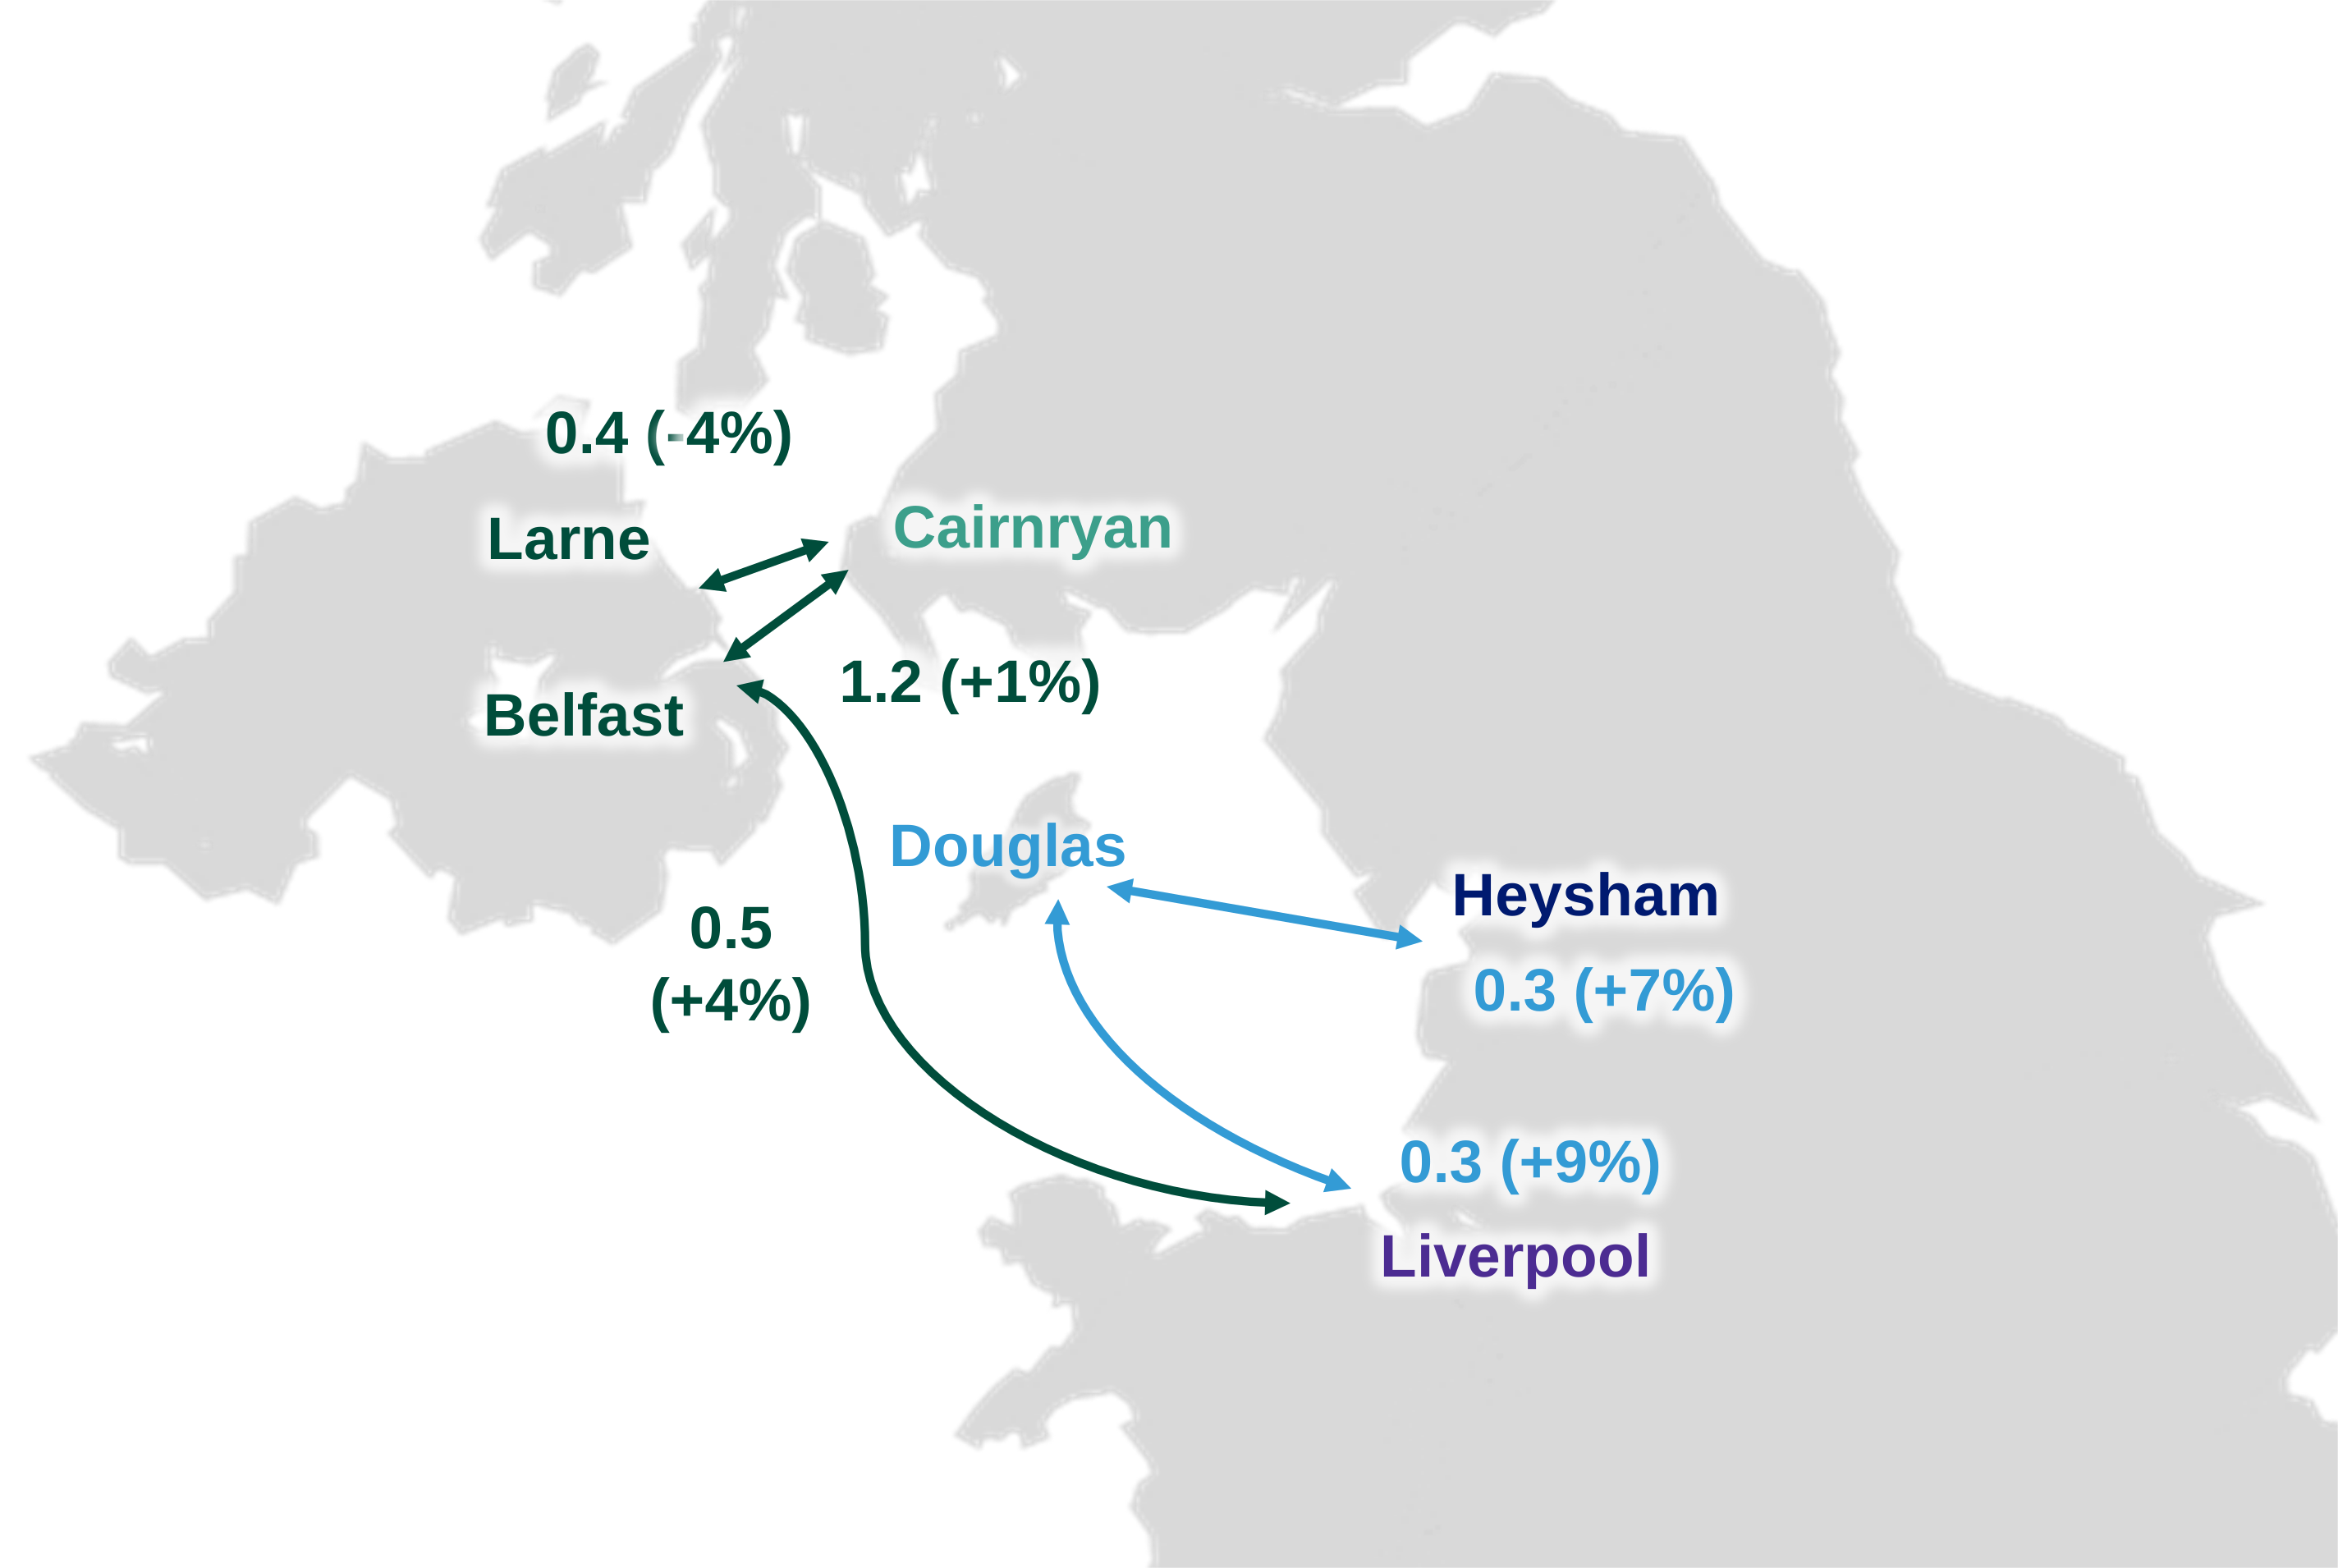
Map 1: Top 5 UK major domestic short sea routes in 2025 by number of passengers (millions) and change from 2024 (SPAS0201)
In 2025, passenger numbers on domestic short sea routes were 2% lower than in 2024 but remained 8% above 2019 levels.
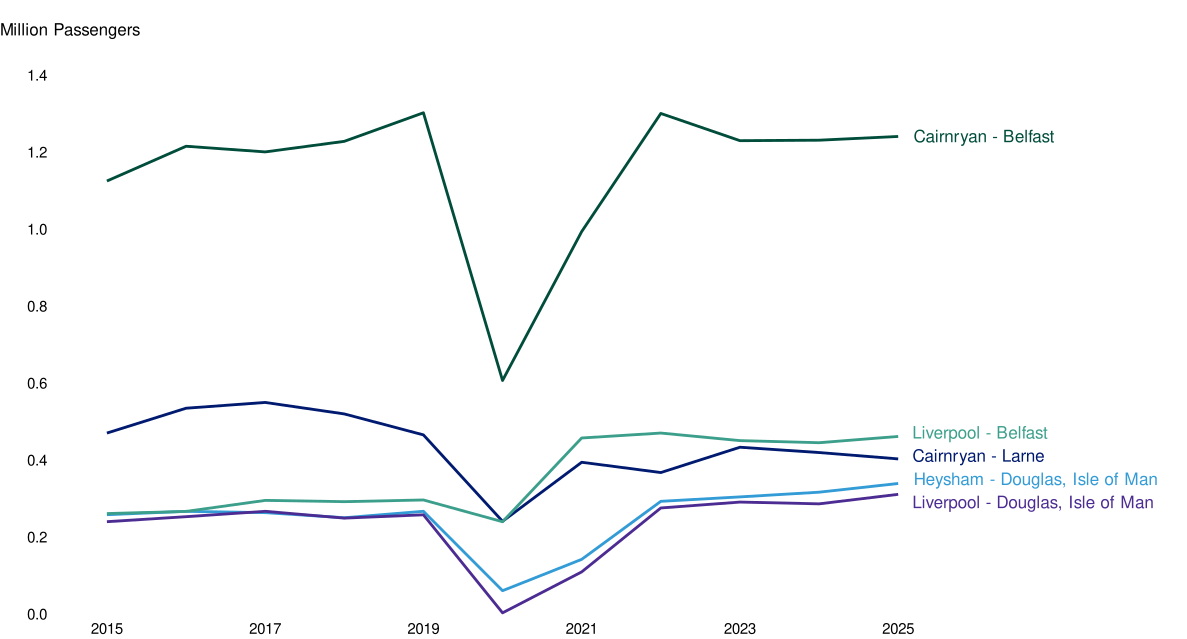
Domestic sea crossings from Great Britain to Northern Ireland were 2% above 2019 levels. Cairnryan-Belfast is consistently the busiest domestic short sea route. In 2025, this route saw 1.2 million passengers, a 1% increase compared with 2024. Liverpool-Belfast is the next busiest domestic short sea route, with 0.5 million passengers, closely followed by Larne-Cairnryan with 0.4 million passengers.
Both routes from Great Britain to the Isle of Man are in the top 5 UK domestic short sea routes with 0.3 million passengers each in 2025. Heysham – Douglas had a 7% increase from 2024 and Liverpool – Douglas had a 9% increase from 2024 (map 1, chart 3).
Chart 3: Top 5 busiest major domestic sea crossing routes, 2010 to 2025 (SPAS0201)
Passengers on domestic cruises
In May 2021, UK domestic cruises were allowed to operate as part of the gradual lifting of coronavirus restrictions and in 2021 there were 433,000 domestic cruise passengers. This decreased by 90% to 46,000 in 2022 following the reopening of international cruises. In 2025, domestic cruises carried around 64,000 passengers, up 32% from 48,000 in 2024.
Detailed statistics on domestic sea passengers can be found in data table SPAS0201.
Annex: timeline of coronavirus events affecting sea travel
A timeline of events during the coronavirus pandemic that affected sea travel since March 2020 until March 2022 can be found in the Notes and definitions section.
Background information
We would welcome any feedback on these statistics by sea-passenger.stats@dft.gov.uk. We will attempt to address any comments in a subsequent release.
The data tables for sea passenger statistics are available.
Full guidance on the methods used in the publication of these releases, and the quality of the data, and known users and uses of the statistics are available.
The sea passenger statistics are accredited official statistics. The statistics presented in this release were independently reviewed by the Office for Statistics Regulation in February 2013 and are therefore labelled ‘accredited official statistics’.
Details of ministers and officials who receive pre-release access to these statistics up to 24 hours before release are available.
Instructions for printing and saving
Depending on which browser you use and the type of device you use (such as a mobile or laptop) these instructions may vary.
You will find your print and save options in your browser’s menu. You may also have other options available on your device. Tablets and mobile device instructions will be specific to the make and model of the device.
How to search
Select Ctrl and F on a Windows laptop or Command and F on a Mac
This will open a search box in the top right-hand corner of the page. Type the word you are looking for in the search bar and press enter.
Your browser will highlight the word, usually in yellow, wherever it appears on the page. Press enter to move to the next place it appears.
Contact us
To hear more about DfT statistical publications as they are released, follow us on X at DfTstats.