Right to Buy sales and replacements, England: April 2025 to March 2026
Published 6 August 2026
Applies to England

© Crown copyright 2026
This publication is licensed under the terms of the Open Government Licence v3.0 except where otherwise stated. To view this licence, visit nationalarchives.gov.uk/doc/open-government-licence/version/3 or write to the Information Policy Team, The National Archives, Kew, London TW9 4DU, or email: psi@nationalarchives.gov.uk.
Where we have identified any third party copyright information you will need to obtain permission from the copyright holders concerned.
This publication is available at https://www.gov.uk/government/statistics/right-to-buy-sales-and-replacements-england-2025-to-2026/right-to-buy-sales-and-replacements-england-april-2025-to-march-2026
This release reports on the sales of council owned dwellings which are subject to the Right to Buy pooling of receipts provision. While a large proportion of these sales are Right to Buy, some are shared ownership sales and other eligible sales. Prior to the 2021-22 annual release, it was not possible to separate these types of sales, and these total sales will be referred to as “eligible sales” throughout this release.
Not all Right to Buy sales count as eligible sales, as sales of properties built after July 2008 are excluded from these statistics as they are excluded from the provisions in the pooling regulations.
The quarterly figures presented in earlier releases also refer to “eligible sales”. The latest statistics on all Right to Buy sales were published in the 2024-25 Social Housing Sales and Demolitions statistical release. The latest figures for sales of social housing are reflected in Table 678.
1. Key statistics
2,052,813
Since the start of the Right to Buy scheme in 1980, until 31 March 2026, there have been 2,052,813 sales to tenants through the Right to Buy scheme. [footnote 1]
14,275
In 2025-26, local authorities reported 14,275 eligible sales, an increase of 90% compared to 2024-25.
£1.61 billion
From these 14,275 sales, local authorities received £1.61 billion.
£112,900
The average receipt per dwelling was £112,900, an increase of 5% compared to 2024-25.
3,452
3,452 replacements were funded in 2025-26 through receipts from eligible sales, a decrease of 7% compared with 2024-25. Of these, local authorities started or acquired 3,442 properties and Homes England or the Greater London Authority started or acquired 10 properties. [footnote 2]
Release date: 06 August 2026
Lead Statistician: Maya Maxwell
Statistical queries: housing.statistics@communities.gov.uk
Media enquiries: 0303 444 1209 or NewsDesk@communities.gov.uk
This is the first full-year release affected by the reduction of Right to Buy maximum cash discounts, which applied to applications made on or after 21 November 2024. Applications made before that date remained eligible for the previous higher caps of £136,400 in London and £102,400 elsewhere in England. From 21 November 2024, maximum cash discounts returned to pre-2012 levels, ranging from £16,000 to £38,000 depending on location.
The timing of the change is important for interpreting activity in 2025-26. Right to Buy applications increased sharply before the lower discounts took effect, rising to 63,378 in 2024-25 from 18,755 in 2023-24.[footnote 3] Some sales completed in 2025-26 are likely to relate to applications made under the previous higher discount caps.
Following the Government response to the consultation on Reforming the Right to Buy published on 2 July 2025, these statistics will no longer report on the replacement target.
The replacements section in this bulletin therefore focuses on reported starts, acquisitions, completions and the characteristics of replacement homes, rather than performance against the former national target.
2. Comparison of eligible sales to total Right to Buy sales
This statistical release, and the accompanying tables, report data submitted by local authorities to the Ministry of Housing, Communities and Local Government (MHCLG) reporting:
-
the number of eligible sales of social houses to local authority tenants
-
the receipts collected through these sales
-
the number of properties started, completed and acquired funded through these receipts
The data submitted by local authorities forms part of the Pooling of Capital Receipts return which is used to calculate the amount of money which local authorities must pay to central government from the proceeds of eligible sales. The data collected for this release is financial information based on rules regarding the pooling of receipts which were created following the reinvigoration of the Right to Buy scheme in April 2012.
This means that the sales reported in these statistics are mainly Right to Buy sales, but also include a small number of shared ownership sales and other discounted sales to secure tenants. Right to Buy sales of properties built after July 2008 are excluded from these statistics as they are excluded from the provisions in the pooling regulations relating to Right to Buy sales [footnote 4].
This statistical release should be seen as a leading indicator of Right to Buy sales, as the statistics in the scope of this release do not include all Right to Buy sales and also include a small number of other sales. The definitive statistics on the overall number of Right to Buy sales are the Social Housing Sales and Demolitions statistics which will be released in January/February 2027 covering the period up until end March 2026.
At a national level, eligible sales can be used to approximate local authority Right to Buy sales, particularly for describing trends. However, when quoting exact figures for individual local authorities, the correct source of this information is the Social Housing Sales and Demolitions statistics.
3. Eligible sales
Local authorities reported 14,275 eligible sales in 2025-26 (i.e. the financial year ending in March 2026), an increase of 90% compared with 2024-25. This increase follows the rise in Right to Buy applications ahead of the reduction in discounts on 21 November 2024: applications increased to 63,378 in 2024-25, up from 18,755 in 2023-24.[footnote 3] Some of these applications are likely to have completed as sales during 2025-26. This is discussed in more detail in the Right to Buy context section.
Of this total, 14,187 of the eligible sales were Right to Buy sales, 39 shared ownership sales and none were classed as other eligible sales. The sale type was unknown for the remaining 49 sales [footnote 5]. This shows that, while Right to Buy sales do not make up all eligible sales, they account for over 99% of sales where the type is known. Changes to the Right to Buy scheme therefore have a direct impact on the number of eligible sales reported in this release. Not all Right to Buy sales count as eligible sales, as sales of properties built after July 2008 are excluded from these statistics as they are excluded from the provisions in the pooling regulations [footnote 4] The 2021-22 release was the first to collect the breakdown information on the type of eligible sale.
Figure 1 shows how the number of eligible sales has changed since 2006-07 in England. The number of eligible sales in 2025-26 is the highest since 2006-07.
Figure 1: Annual eligible sales from 2006-07 to 2025-26, England
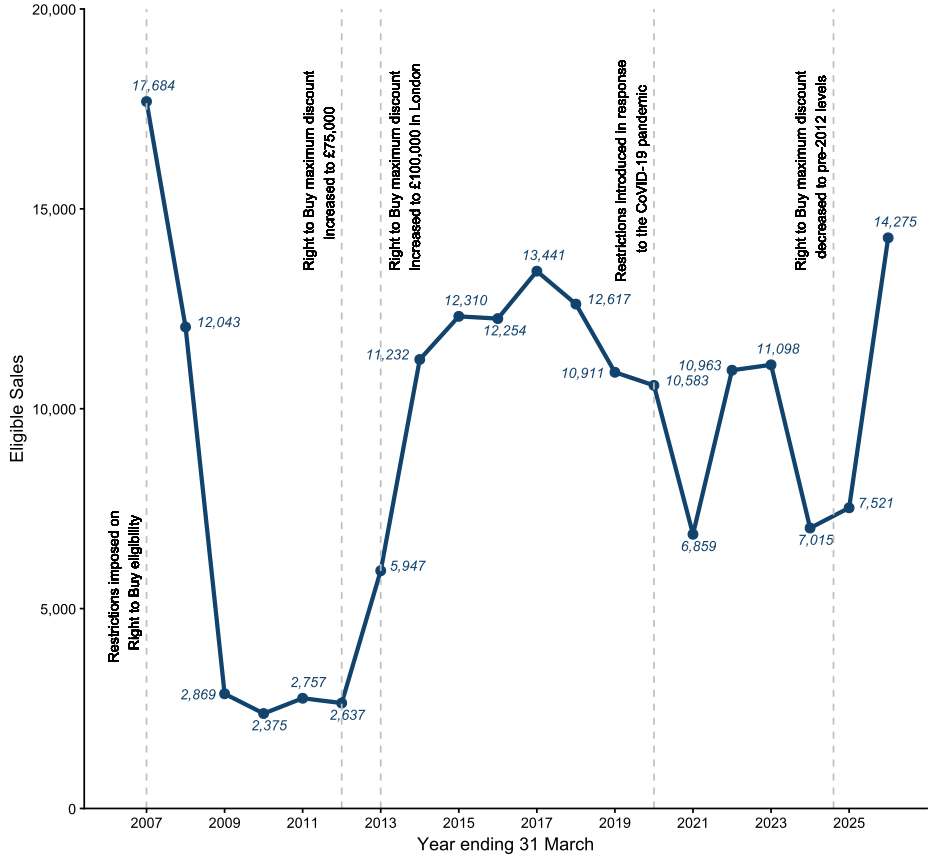
Eligible sales decreased between 2006-07 and 2008-09, following the introduction of caps on discounts in 2004-05. Sales began to rise again after reinvigoration in 2012-13, when discounts to tenants increased, and continued to rise after further increases to discounts in London in March 2013.
From 2016-17, there was a downward trend in the number of eligible sales. There was a particularly sharp decline in 2020-21 due to the restrictions introduced as a response to the COVID-19 pandemic. Sales reported in 2023-24 fell sharply before increasing slightly in 2024-25. In 2025-26, sales almost doubled compared to the previous year. This increase in eligible sales is likely to reflect the applications made before the reduced discounts took effect. Applications for Right to Buy increased to 63,378 in 2024-25, up from 18,755 in 2023-24.[footnote 3]
3.1 Eligible sales by region
Eligible sales were concentrated across a small group of local authorities. In 2025-26, 50% of all reported eligible sales were made by 25 local authorities, all of which were urban centres, including four London boroughs. This distribution has been similar in previous years.
Across the regions of England, there is a large variation in the number of local authority properties bought through Right to Buy. This variation reflects several factors, including:
-
the amount of local authority social housing stock: in some regions, a much larger proportion of social housing is owned by private registered providers rather than local authorities, reducing the number of possible sales compared to other regions
-
maximum Right to Buy discounts: until 21 November 2024, Right to Buy sales were higher than they currently are, and in London there was a higher maximum discount than those in the rest of England. Following the government’s review of Right to Buy discounts, maximum discounts returned to pre-2012 levels
-
house prices: there is a large variation in house prices across the regions of England, which means that Right to Buy is more affordable in some areas than others
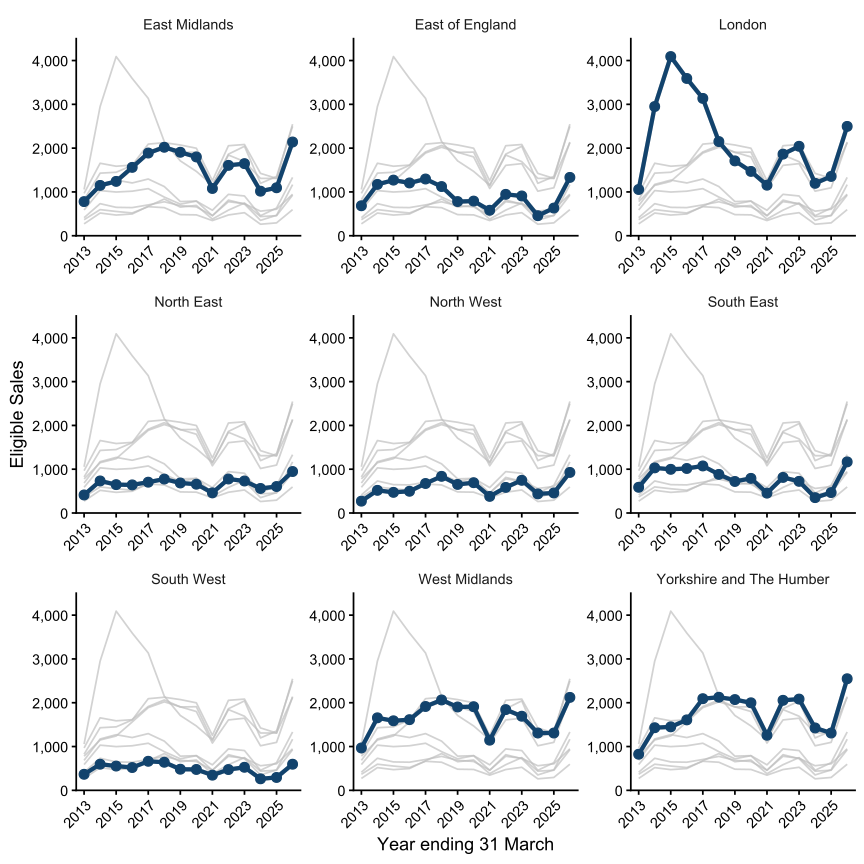
As figure 2 shows, in 2025-26 the highest numbers of eligible sales were in Yorkshire and the Humber, London, and the Midlands. All regions, except London and the South West, have recorded their highest numbers of eligible sales since 2012.
Sales in London increased substantially after 2013-14, following increases to the discounts available in London in April 2013.
Figure 2: Annual eligible sales by Region in England, 2012-13 to 2025-26
At 31 March 2025, there were 1,561,241 local authority owned social housing homes held within a Housing Revenue Account [footnote 6]. These homes were unevenly distributed across the regions of England. As the number of local authority owned social homes has a direct impact on the number of potential Right to Buy sales, Figure 3 shows eligible sales per 1,000 local authority stock at the end of the previous year.
Figure 3: Annual eligible sales per 1,000 local authority stock held in a housing revenue account by region in England, 2012-13 to 2025-26
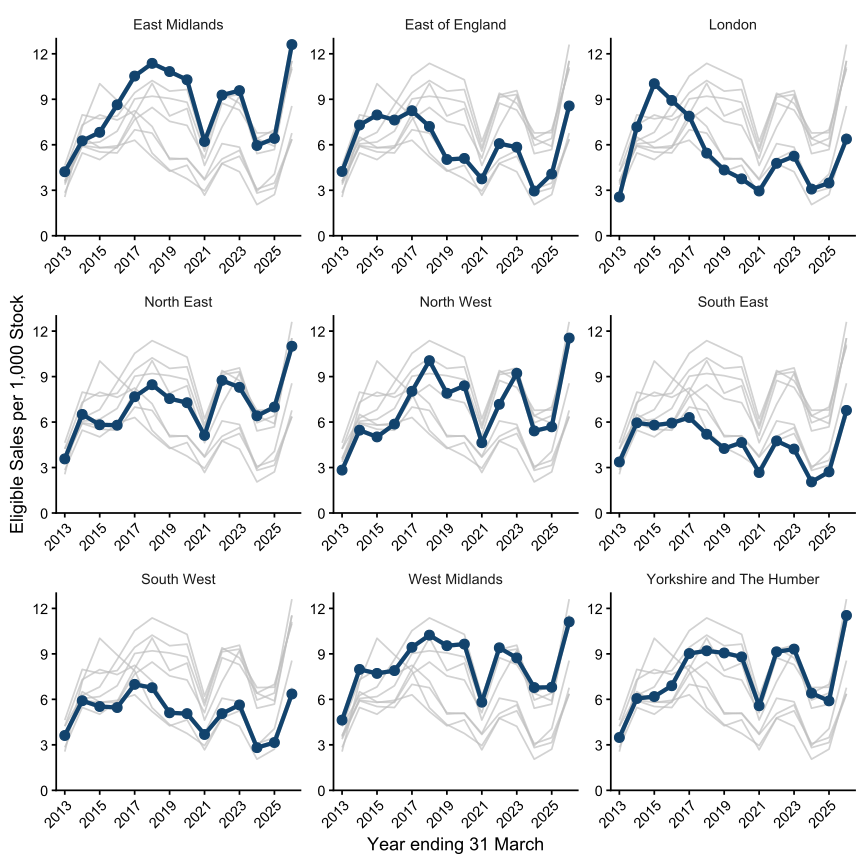
Figure 3 shows that, in 2025-26, eligible sales per 1,000 stock were highest in the East Midlands, North West, and Yorkshire and the Humber. In 2025-26, sales per 1,000 stock increased across all regions in 2025-26, suggesting that the increase in eligible sales was across all of England. London remained among the regions with the lowest sales per 1,000 stock, alongside the South West, despite the national increase.
4. Eligible sales receipts
In 2025-26, local authorities received £1.61 billion through reported eligible sales, an increase of 99.6% compared with 2024-25. The average receipt in 2025-26 was £112,900, an increase of 5% compared with 2024-25. The increase in total receipts mainly reflected the higher number of eligible sales, while the increase in average receipt per dwelling also contributed to the overall rise.
Figure 4 shows the total value of receipts received in England through eligible sales since 2012-13, alongside the average receipt per dwelling.
Figure 4: Total value of receipts and average receipts received through eligible sales, England 2012-13 to 2025-26
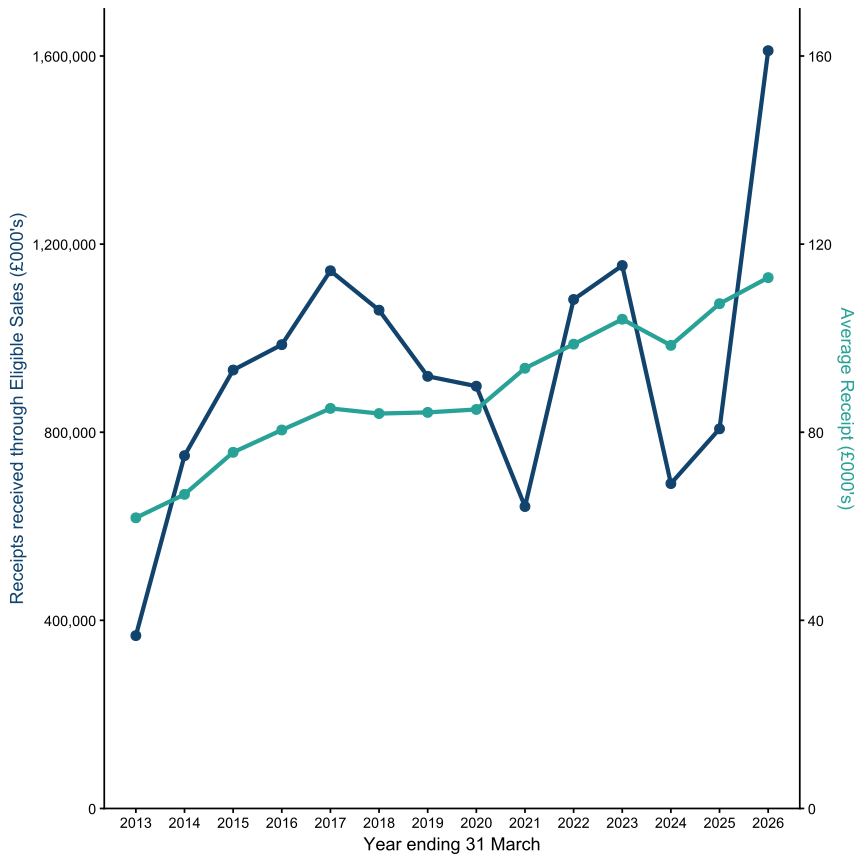
As figure 4 shows, the average receipt from eligible sales in England increased from £61,800 in 2012-13 to £112,900 in 2025-26, an increase of 83%. Over the same period, the average house price in England[footnote 7] increased by 74%. While average Right to Buy receipts are influenced by discount levels and the characteristics of properties sold, this comparison suggests that receipt values have broadly kept pace with, and slightly exceeded, growth in the wider housing market.
The receipts received by local authorities are dependent on the location and type of properties sold, the number of years that tenants have been living at the property (as this determines the discount to the property) and the change in house prices over the course of the year. For these reasons it is difficult to identify a single factor as to why average receipts in different regions change over a time period.
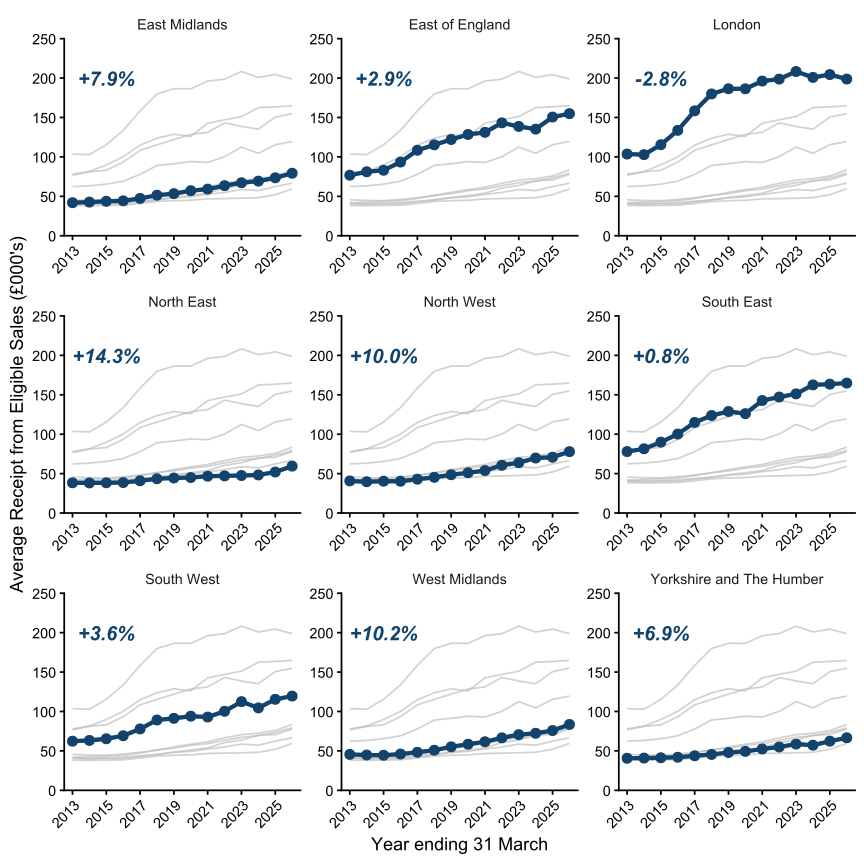
Figure 5 shows the average receipt in each region since 2012-13, with the blue figures representing the percentage change from 2024-25 to 2025-26. London has consistently recorded the highest average receipt in recent years and remained the highest in 2025-26. However, it was the only region to see a decrease in average receipts between 2024-25 and 2025-26. By contrast, average receipts increased in all other regions, with the largest increase observed in the North East.
Figure 5: Average receipt received through eligible sales, by region in England 2012-13 to 2025-26
The receipts received from eligible sales of social housing properties must be spent by local authorities within 5 years [footnote 8] on replacing sold properties, either by building new homes or acquiring existing properties. If the receipts are not spent within this period, they are returned to the department and then used by Homes England or the Greater London Authority to provide new homes, either through new build or acquisition of existing stock, including new build in the open market. There is more information on the replacement of eligible sales in the Background to the Right to Buy scheme section.
Local authorities are able to retain 100% of Right to Buy receipts on an ongoing basis. Further detail on the policy changes affecting receipts is included in the background section.
5. Replacements using Right to Buy receipts
5.1 Starts and acquisitions
Since the reinvigoration of Right to Buy in April 2012, MHCLG has collected data on the number of properties which have been started or acquired using the receipts of Right to Buy sales. Both starts on site for new builds, as well as acquisitions of properties from the market, count towards a local authority’s total Right to Buy replacements.
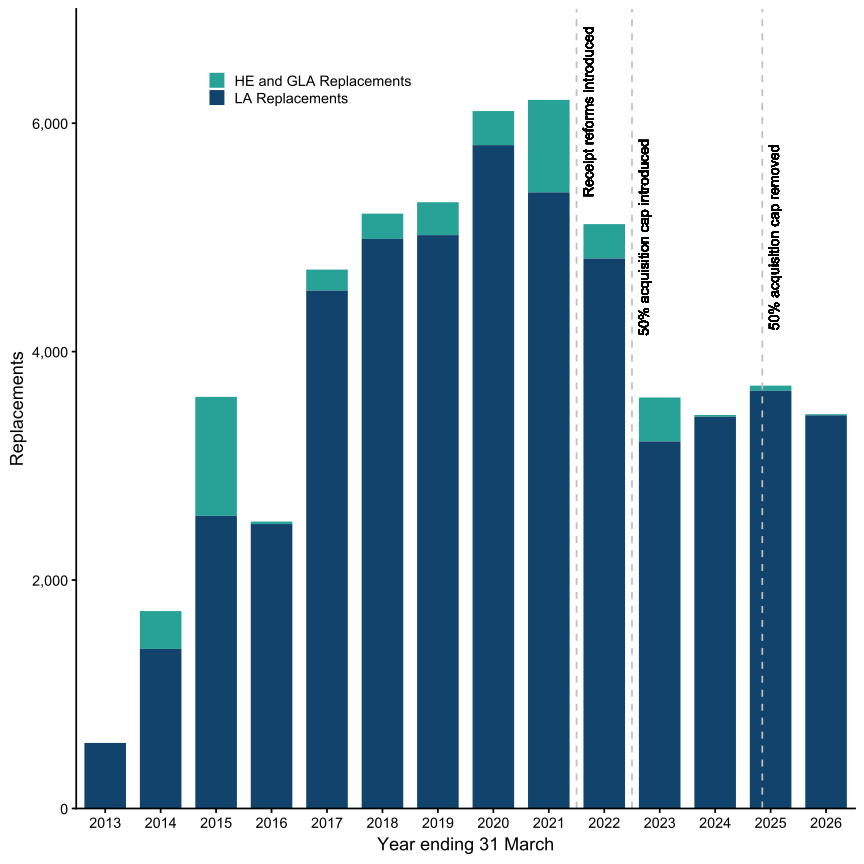
In 2025-26, there were 3,452 properties started or acquired using Right to Buy receipts, a decrease of 7% compared to 2024-25.[footnote 2]
In 2022-23, a 50% cap was introduced on the proportion of Right to Buy replacements that could be delivered as acquisitions, to help encourage new housing supply. This is relevant when interpreting the split between starts and acquisitions, but the cap was removed from July 2024 and the suspension was later extended indefinitely.[footnote 9]
The number of replacements in this section is calculated from the sum of starts and acquisitions [footnote 10]. Data on the split between starts and acquisitions was first collected in 2017-18. Since then, the split has varied but starts accounted for the majority of replacements in each year up to and including 2023-24, making up between 51% and 67% of all replacements annually. In 2024-25, this pattern reversed: starts on site accounted for 42% of replacements and acquisitions for 58%, likely reflecting the removal of the acquisition cap. In 2025-26, the balance shifted slightly back towards starts, which accounted for 45% of replacements, compared with 55% for acquisitions.
Figure 6 shows the number of replacements delivered by local authorities, Homes England and the GLA using Right to Buy receipts since 2012. It shows that the number of starts and acquisitions continued to increase from 2012-13 to reach a peak in 2020-21. Since 2012-13, the majority of replacements have been delivered by local authorities themselves, accounting for 51,323 (93%) of the 55,275 total replacements. Since 2023-24, Homes England have not separately recorded new starts funded with Right to Buy receipts. Therefore, this number may be an undercount of the total number of replacements. Replacements funded via the Greater London Authority continue to be included. The number of reported replacements delivered by the Greater London Authority decreased from 45 in 2024-25 to 10 in 2025-26.
Figure 6: Total replacements started and acquired by local authorities, Homes England and the Greater London Authority, 2012-13 to 2025-26
The 7% decrease in replacements contrasts with the substantial increase in eligible sales in 2025-26. However, replacements are funded over a longer period and do not necessarily correspond to sales in the same financial year.
There are several factors that may have had an impact on the number of starts since 2022-23 including difficulties sourcing raw materials, rising build costs and high inflation. Additionally, in April 2021, the time limit for local authorities to spend new and existing Right to Buy receipts was extended from 3 years to 5 years. This may have led local authorities to choose to spread out the spending of the same money across a longer period of time, leading to a reduction in the number of replacements in the short term.
5.2 Replacements by region
The delivery of replacements was concentrated across a small group of local authorities, as was also the case in previous years. In 2025-26, 50% of all replacements were delivered by 20 local authorities, compared with 25 local authorities accounting for around 50% of eligible sales.
As with eligible sales, these authorities were predominantly urban areas: 19 of the 20 were classified as urban or intermediate urban under the Rural Urban Classification. Six were London boroughs (Hammersmith and Fulham, Croydon, Ealing, Hillingdon, Lewisham and Newham), while South Cambridgeshire was the only majority rural authority in the group.
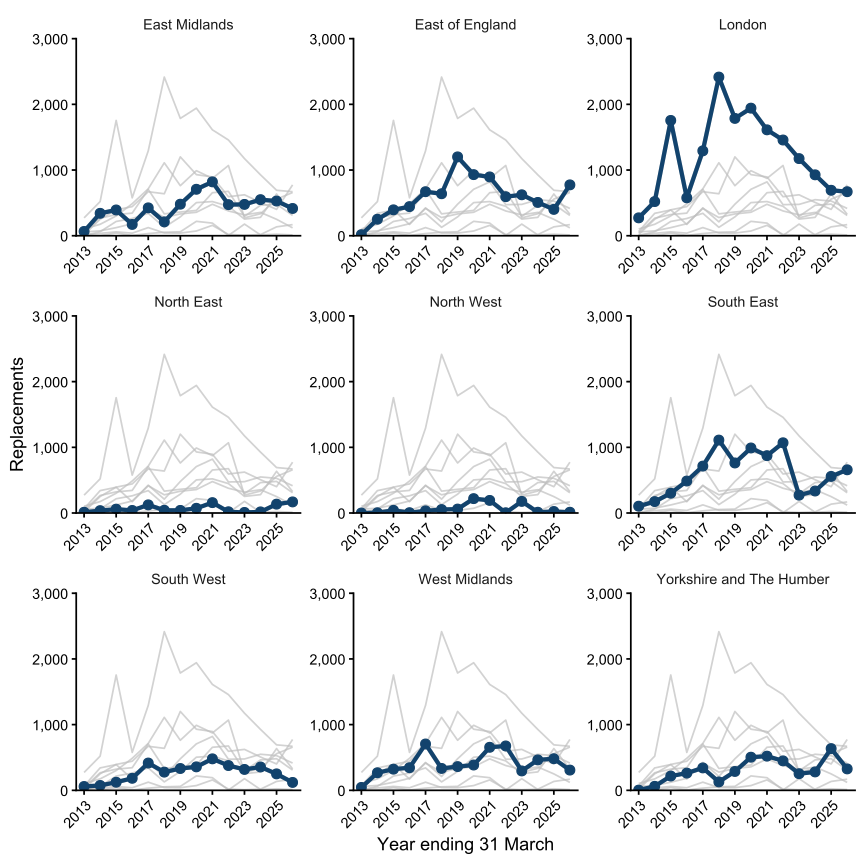
Across the different English regions, the number of replacements in 2025-26 fell in the North West, Yorkshire and the Humber, East Midlands, West Midlands, London and South West compared with the previous year, while it increased in the North East, East of England and South East.
Historically, as with eligible sales, the number of replacements has a large regional variation across England. Most of the replacements have been in London, the South East and the East of England, with comparatively fewer in the North East, North West and South West.
Figure 7 shows the total number of replacements delivered by local authorities, Homes England and the Greater London Authority across the 9 English regions.
Figure 7: Total replacements delivered by local authorities, Homes England and the Greater London Authority, by English region, 2012-13 to 2025-26
5.3 Completions
Following changes to the data collection from 2021-22, this release presents statistics on the number of new-build replacement properties funded through Right to Buy receipts that have been completed. Between 2012-13 and 2020-21, these data were collected through Local Authority Housing Statistics. Because the source changed from 2021-22 onwards, comparisons with earlier years should be made with care, as some variation may reflect differences in collection and methodology rather than actual changes in delivery.
In 2025-26 there were 2,597 reported completions of new-build replacement properties, an increase of 26% compared to 2024-25. Of these new-build completions, 2,547 were completed by local authorities. The remaining 50 new-build completions were delivered by the Greater London Authority.
Figure 8 shows the total number of new-build completions reported by local authorities, Homes England and the Greater London Authority since 2012-13.
Figure 8: Total new-build replacements completed by local authorities, Homes England and the Greater London Authority, 2012-13 to 2025-26
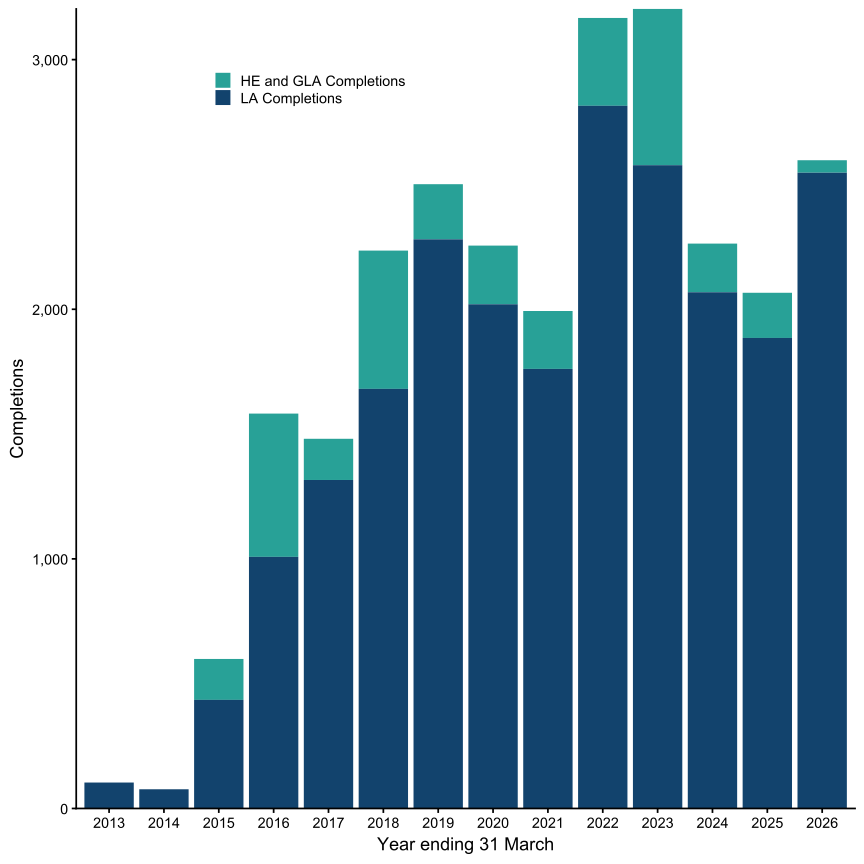
Figure 9 shows the comparison between starts and completions of new build properties by local authorities. Before 2017-18 there is no data available on starts, but a combined figure for starts and acquisitions (replacements) is available. The “Estimated Starts” figures for before 2017-18 in figure 9 are calculated by taking the proportion of replacements which were starts between 2017-18 and 2025-26 and applying this to total replacements figures from 2012-13 to 2016-17 to estimate the number of starts.
Figure 9: Comparison between starts and completions of new build properties by local authorities, 2012-13 to 2025-26
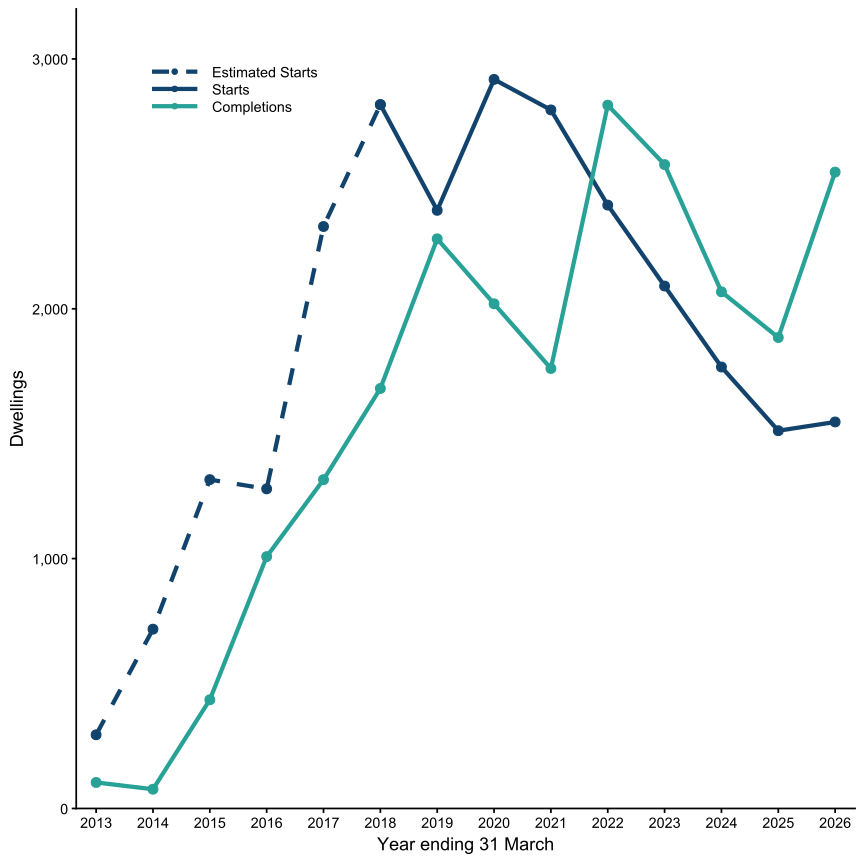
Completions have historically followed a similar trend to starts, although at a lower absolute level and with a delay of up to two years. This is expected due to the process for a property to move from start to completion.
However, this relationship is not found in 2025-26, where completions increased sharply despite no equivalent trend in starts in recent years.
The increased flexibility to combine Section 106 contributions with Right to Buy receipts may in part explain this difference, as some homes completed in 2025-26 may have used pooling receipts even though the associated starts would not have been recorded as eligible when they began under the funding rules in place at the time.
It is also possible that starts may have been underreported, as data quality for starts is generally lower than for completions. The increase in completions appears to be concentrated within a small number of local authorities, particularly in London and the West Midlands, and we are following up with these authorities to better understand the reported figures.
The decrease in completions in 2019-20 and 2020-21 may reflect restrictions introduced in response to the COVID-19 pandemic, while the increase in completions in 2021-22 may reflect a catch-up of new builds that were not completed until restrictions eased. The completions declined between 2022-23 and 2024-25, broadly reflecting the reduction in starts seen in previous years. However, this pattern changed in 2025-26, when completions increased despite no corresponding rise in starts in earlier years. We are working with local authorities to better understand the factors contributing to this increase.
5.4 Types of replacement
For these breakdowns, replacements are defined as acquisitions plus completions. This differs from the starts and acquisitions measure used earlier in this section.
Tenure
From 2021-22, data has been collected on the tenure of replacement dwellings (acquisitions and completions) delivered by local authorities. Data is also collected by Homes England and the Greater London Authority on the tenures of completed and acquired properties funded by the recycling of Right to Buy receipts. In order to match between data sources, homes delivered by the Greater London Authority as London Affordable Rent have been combined in the Affordable Rent figures.
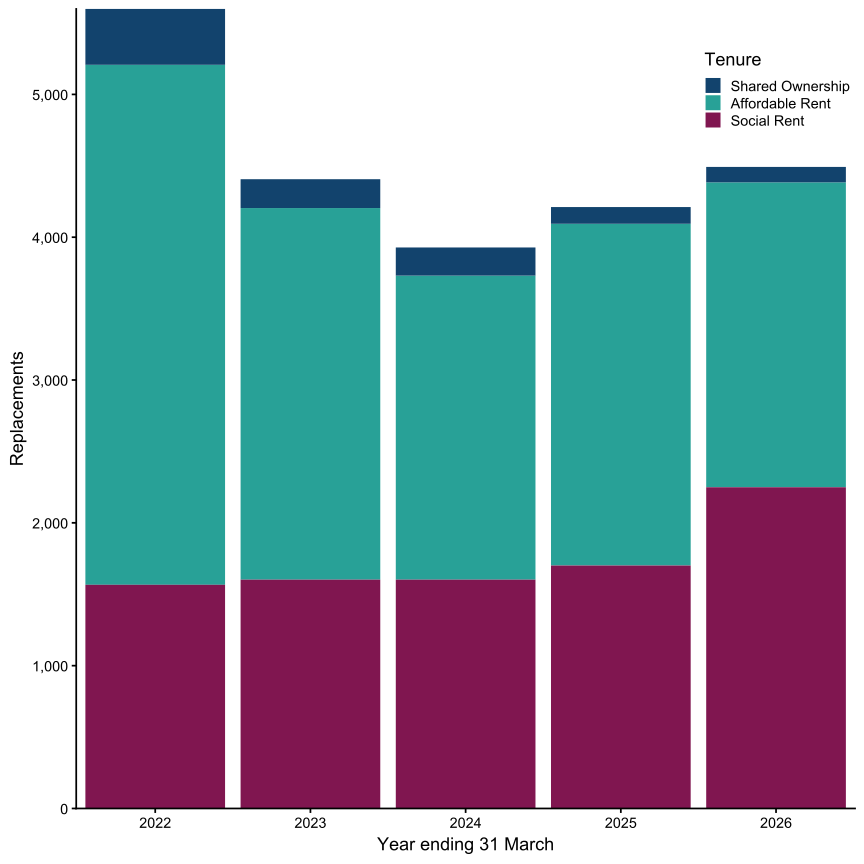
In 2025-26 there were 4,492 replacements (completions plus acquisitions), 50% (2,249) of replacement properties were for Social Rent, 48% (2,135) were for Affordable Rent, and 2% (108) were for Shared Ownership. Although absolute values have fluctuated slightly since data on the tenure of replacements started being collected, the percentage for each tenure has remained broadly similar year on year. However, between 2024-25 and 2025-26, Social Rent replaced Affordable Rent as the tenure with the largest proportion of replacement properties. To date, no First Homes replacements have been recorded using recycled Right to Buy receipts.
Figure 10 shows the number of replacement properties for each tenure by year since 2021-22.
Figure 10: Right to Buy replacements (new-build completions and acquisitions) by tenure, 2021-22 to 2025-26
The pooling return on which these statistics are based does not itself collect data on the tenure of the properties sold. However, Local Authority Housing Statistics data shows that local authority housing stock held within a Housing Revenue Account is primarily social rent (97%),[footnote 11] 97% of all sales of local authority rental stock are of social rent dwellings,[footnote 12] and 95% of all sales of local authority rental stock are Right to Buy sales.[footnote 13] It can therefore be inferred that the majority of eligible sales are of social rent dwellings.
Bedrooms
The Local Authority Housing Statistics collects data on the number of bedrooms of properties sold through Right to Buy and, from 2012-13 to 2020-21, it also collected the number of bedrooms of the replacement properties (acquisitions and completions). The information on replacement properties was moved to the Capital Receipts of Pooling Return in 2021-22. Replacements by numbers of bedrooms are not available from Homes England or the Greater London Authority, so the following statistics only apply to replacements delivered by local authorities.
On average, homes sold through Right to Buy are being replaced by homes with fewer bedrooms. Between 2012-13 and 2024-25,[footnote 14] 14% of Right to Buy sales were 1-bedroom properties, 34% had 2 bedrooms and 53% had 3 or more bedrooms. For acquisitions and completions between 2012-13 and 2025-26, 25% of these were 1-bedroom properties, 43% had 2 bedrooms and 32% had 3 or more bedrooms.
Local Authority Housing Statistics show that, at 31 March 2025, 48% of households on local authority housing registers (waiting lists) required a one-bedroom home (or studios), 26% required a two-bedroom home, 22% required a three or more bedroom home. The remaining 4% required an unspecified number of bedrooms. Although homes sold through Right to Buy are more likely to have three or more bedrooms than replacement homes, the larger share of one- and two-bedroom replacement properties does better reflect the bedroom requirements recorded on housing registers.
Figure 11 shows the comparison between sales, from 2012-13 to 2024-25, and completions and acquisitions (replacements), from 2012-13 to 2025-26, by number of bedrooms for England.
Figure 11: Comparison between Right to Buy sales, from 2012-13 to 2024-25, and replacement completions and acquisitions, from 2012-13 to 2025-26, by number of bedrooms for England
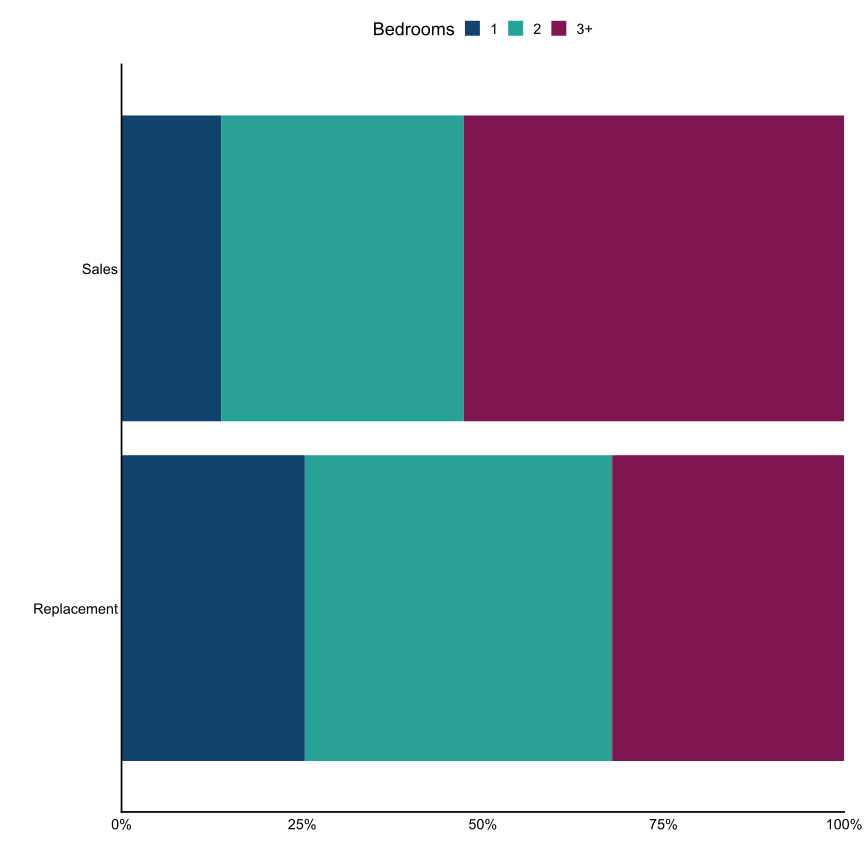
Figure 12 shows the comparison between sales, from 2012-13 to 2024-25, and completions and acquisitions (replacements), from 2012-13 to 2025-26, by number of bedrooms by region of England.
Figure 12: Comparison between Right to Buy sales, from 2012-13 to 2024-25, and replacement completions and acquisitions, from 2012-13 to 2025-26, by number of bedrooms by English region
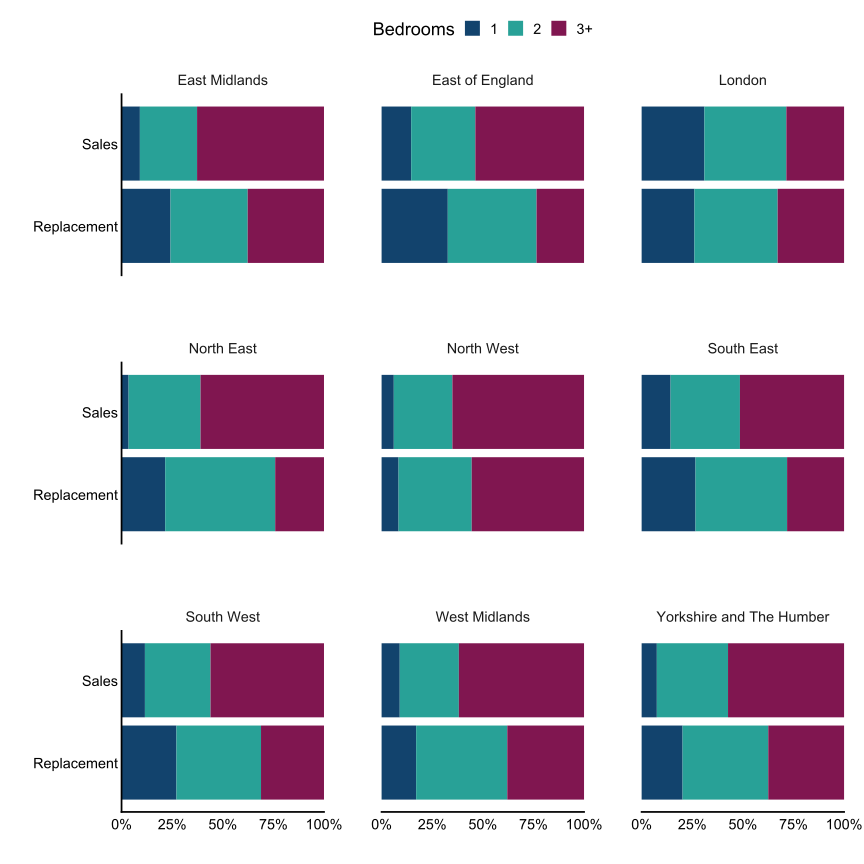
Figure 12 shows that in all regions, except the North West, 1- and 2-bedroom homes together accounted for the majority of acquired or completed replacement homes. Two-bedroom homes were the most common replacement property size in every region except the North West.
6. Background to the Right to Buy scheme
The Right to Buy scheme was introduced in 1980 and gives qualifying social tenants the opportunity to buy their rented home at a discount.
The scheme is open to secure tenants of local authorities and non-charitable PRPs, and to those assured tenants of PRPs who transferred with their homes from a local authority as part of a stock transfer. To qualify for the Right to Buy scheme, a social tenant must have accrued at least three years public sector tenancy. This does not need to be continuous, nor does it need to have been accrued whilst living in the tenant’s current property.
In 1998 and 2003, Discount Orders reduced Right to Buy discounts across England to maximums ranging from £16,000 to £38,000 (depending on the local authority where the property was located). Prior to that, the discount cap had been £50,000 across England.
In April 2012, the Department for Communities and Local Government (DCLG) reinvigorated the Right to Buy scheme by changing the maximum cash discount available for Right to Buy sales to a new higher level of £75,000 across England. In March 2013, in recognition of the increasing property prices in London, the government further increased the maximum discount available for tenants living in London boroughs to £100,000. In July 2014, DCLG changed the maximum cash discount available for the Right to Buy so that it changes annually in line with the Consumer Price Index (CPI) rate of inflation.
From 2012, local authorities were able to retain receipts from additional Right to Buy sales, measured against a baseline of sales forecast before the 2012 discount increases, to fund replacement affordable homes. Under the one-for-one replacement policy, additional homes sold through Right to Buy were expected to be replaced nationally by new affordable homes for rent. Between 2011-12 and 2020-21, local authorities generally had 3 years to spend retained receipts, which could fund up to 30% of the cost of each replacement home. Unspent receipts were returned to the Department for use by Homes England or the Greater London Authority.
Following the Government response to the consultation on Reforming the Right to Buy published on 2 July 2025, these statistics will no longer report on the replacement target.
The replacements section in this bulletin therefore focuses on reported starts, acquisitions, completions and the characteristics of replacement homes, rather than performance against the former national target.
On 20 March 2021, the Ministry of Housing, Communities and Local Government (MHCLG) published its response to a consultation on the use of Right to Buy (RTB) receipts which outlined some changes to how local authorities could spend the money they received from Right to Buy sales. These changes gave local authorities increased flexibility on how they could spend their receipts to help authorities build more homes.
In summary, the changes included:
-
extending the time available for local authorities to spend new and existing Right to Buy receipts from 3 years to 5 years. This was intended to make it easier for local authorities to undertake longer-term planning, including remediation of larger plots of land
-
increasing the percentage cost of a new home that local authorities could fund using Right to Buy receipts from 30% to 40%. This aimed to make it easier for authorities to fund replacement homes using Right to Buy receipts, as well as to build homes for social rent
-
introducing a cap on the use of Right to Buy receipts for acquisitions to help drive new supply with effect from 1 April 2022, and phased in over 2022-23 to 2024-25
-
allowing receipts to be used for shared ownership and First Homes, as well as housing at affordable and social rent, to help local authorities build the types of home most needed in their communities
These changes took effect from 1 April 2021, except for the acquisition cap, which was introduced from 1 April 2022, on a phased basis.
In March 2023, it was announced that councils would be able to retain 100% of the receipts from Right to Buy sales in 2022-23 and 2023-24 to help deliver more replacement homes. The acquisition cap was also frozen at 50% until 2025, at which point it would drop to 40% for 2025-26, and then 30% from 2026-27.
In July 2024, it was announced that the government was removing the caps on the percentage of replacements delivered as acquisitions and the percentage cost of a replacement home that can be funded using Right to Buy receipts, and councils would also be given the ability to combine Right to Buy receipts with section 106 contributions. These flexibilities would be in place for an initial 24 months, and subject to review.
At the Autumn Budget 2024, it was announced that councils would be able to retain 100% of the receipts from Right to Buy sales indefinitely. The Budget also confirmed changes to Right to Buy discounts, with maximum cash discounts returning to pre-2012 levels from 21 November 2024. The government also increased protections for newly built social homes by increasing the cost floor protection period from 15 to 30 years from 21 November 2024. The cost floor limits the discount on Right to Buy properties to ensure that the purchase price does not fall below what has been spent on building, buying, repairing or maintaining the property over a certain period of time.
For applications received before 21 November 2024, the maximum cash discount was £136,400 in London and £102,400 elsewhere in England. Following the government’s review of the increased Right to Buy discounts introduced in 2012, maximum cash discounts returned from 21 November 2024 to pre-2012 levels, ranging from £16,000 to £38,000 depending on location. The period between the announcement of the reduction and its implementation meant tenants could still submit applications under the previous higher caps before the new limits came into force. This is an important factor in interpreting 2025-26 sales, as the increase in applications before the change is likely to have fed through into sales during 2025-26.
7. Definitions
-
Right to Buy: The sale of a local authority-owned property to a secure tenant of more than 3 years at a discounted price.
-
Preserved Right to Buy: A scheme which allows tenants of properties which were initially owned by a local authority, but then transferred to a private registered provider (PRP), to maintain their statutory Right to Buy.
-
Voluntary Right to Buy: A pilot scheme in the Midlands which ran from 2018 to 2021 which gave an option for PRPs to sell properties to tenants on a voluntary basis, at the same discounts as statutory Right to Buy.
-
Additional receipts: Receipts generated by additional sales resulting from the 2012 Right to Buy discount increases (against a baseline of sales forecast before the increases) that can be retained by local authorities to fund replacement homes.
-
Pooling: The process of managing Right to Buy receipts nationally, and specifically the process of calculating and collecting the amount of these receipts that should be returned to MHCLG.
8. Live tables
See the data tables which accompany this release.
-
Live Table 691 Annual: Right to Buy sales, by Local Authority
-
Live Table 692 Annual: Right to Buy receipts, by Local Authority
-
Live Table 693 Annual: Replacements of Right to Buy sales, by Local Authority
-
Right to Buy sales open data
-
Right to Buy replacements open data
9. Technical notes
Please see the accompanying technical notes document for further details.
10. Enquiries
Media enquiries:
Office hours: 0303 444 1209
Email: NewsDesk@communities.gov.uk
Public enquiries:
Email: housing.statistics@communities.gov.uk
Information on Official Statistics is available via the UK Statistics Authority website.
Information about statistics at MHCLG is available via the Department’s website.
11. Next release
The date of the next release is pre-announced on GOV.UK.
-
This figure includes all Right to Buy sales, including voluntary and preserved Right to Buy sales to private registered provider tenants, local authority Right to Buy sales up to March 2025, plus all local authority eligible sales from April 2025 to March 2026 which were Right to Buy. Non-eligible local authority Right to Buy sales, eligible sales that are not Right to Buy sales, and private registered provider Right to Buy sales for the financial year 2025-26 are not included in this figure. ↩
-
Since 2023-24, Homes England have not separately recorded new starts funded with Right to Buy receipts. Therefore, this number may be an undercount of the total number of replacements. Replacements funded via the Greater London Authority are still included for 2023-24 onwards. ↩ ↩2
-
Hartlepool and Bradford are not classified as stock-holding authorities for the purposes of Right to Buy receipt pooling, despite having Housing Revenue Accounts (HRAs). When the current pooling arrangements were introduced in 2012, both authorities’ HRAs were closed, and all of their housing stock has been created since then. This means that none of their Right to Buy sales are eligible for reporting in this data collection nor are their receipts poolable. This results in values of zero or [z] (where data are not applicable), even in instances where they may have submitted the Pooling return. ↩ ↩2
-
Where a local authority has reported a total number of eligible sales in the pooling return but has not correctly recorded the type of sale (Right to Buy, shared ownership or other eligible sale), the unclassified sales are recorded as ‘unknown’. ↩
-
Data from Local Authority Housing Statistics. ↩
-
Data from Land Registry, calculated by working out the percentage increase of average house prices in England from April 2012 to March 2026. UK House Price Index. ↩
-
From 1 April 2021, the timeframe for local authorities to spend new and existing Right to Buy receipts was extended from 3 years to 5 years. ↩
-
Some acquisitions that contributed to net supply were exempt from the cap. This included acquisitions of new-build homes from a local authority’s own housing company or arms-length management organisation (ALMO), or acquisitions from regeneration projects that contributed to net supply. Acquisitions of new-build homes from private developers were not exempt. ↩
-
Please note that in Affordable Housing Supply statistics delivery, including that using Right to Buy receipts, is measured as new build completions and acquisitions. ↩
-
Local Authority Housing Statistics, stock at 31 March 2025. The proportion of stock that is social rent is calculated by dividing the number of Social Rent dwellings owned by local authorities with a housing revenue account (a2iaa) by the total number of dwellings owned by those local authorities (a2ia). ↩
-
Local Authority Housing Statistics, sales during 2024-25. The proportion of sales that are of social rent dwelling is calculated by dividing the number of sales of social rent properties (k1fa) by the total sales of rental stock (k1ff). ↩
-
Calculated from Live Table 678 using local authority Right to Buy sales, divided by the sum of local authority Right to Buy sales, other sales to sitting tenants by local authorities, and other sales by local authorities. ↩
-
Data for 2025-26 will be available alongside the publication of the 2025-26 Social Housing sales and demolitions statistical release in January/February 2027. ↩