Cases of tuberculosis (TB) reported to enhanced TB surveillance systems: UK, 2000 to 2025 report
Published 30 July 2026

© Crown copyright 2026
This publication is licensed under the terms of the Open Government Licence v3.0 except where otherwise stated. To view this licence, visit nationalarchives.gov.uk/doc/open-government-licence/version/3 or write to the Information Policy Team, The National Archives, Kew, London TW9 4DU, or email: psi@nationalarchives.gov.uk.
Where we have identified any third party copyright information you will need to obtain permission from the copyright holders concerned.
This publication is available at https://www.gov.uk/government/statistics/reports-of-cases-of-tb-to-uk-enhanced-tuberculosis-surveillance-systems-2000-to-2025/cases-of-tuberculosis-tb-reported-to-enhanced-tb-surveillance-systems-uk-2000-to-2025-report
Main points
In 2025:
- numbers of notifications and rates of tuberculosis (TB) for the UK were similar to 2024, with 5,937 people (5,938 in 2024) notified with TB at a rate of 8.58 notifications per 100,000 population (8.58 per 100,000 in 2024)
- notification numbers and rates were similar in England (0.7% decrease), increased in Wales (9.2% increase) and Scotland (12.3% increase) between 2024 and 2025, and decreased in Northern Ireland (8.1% decrease)
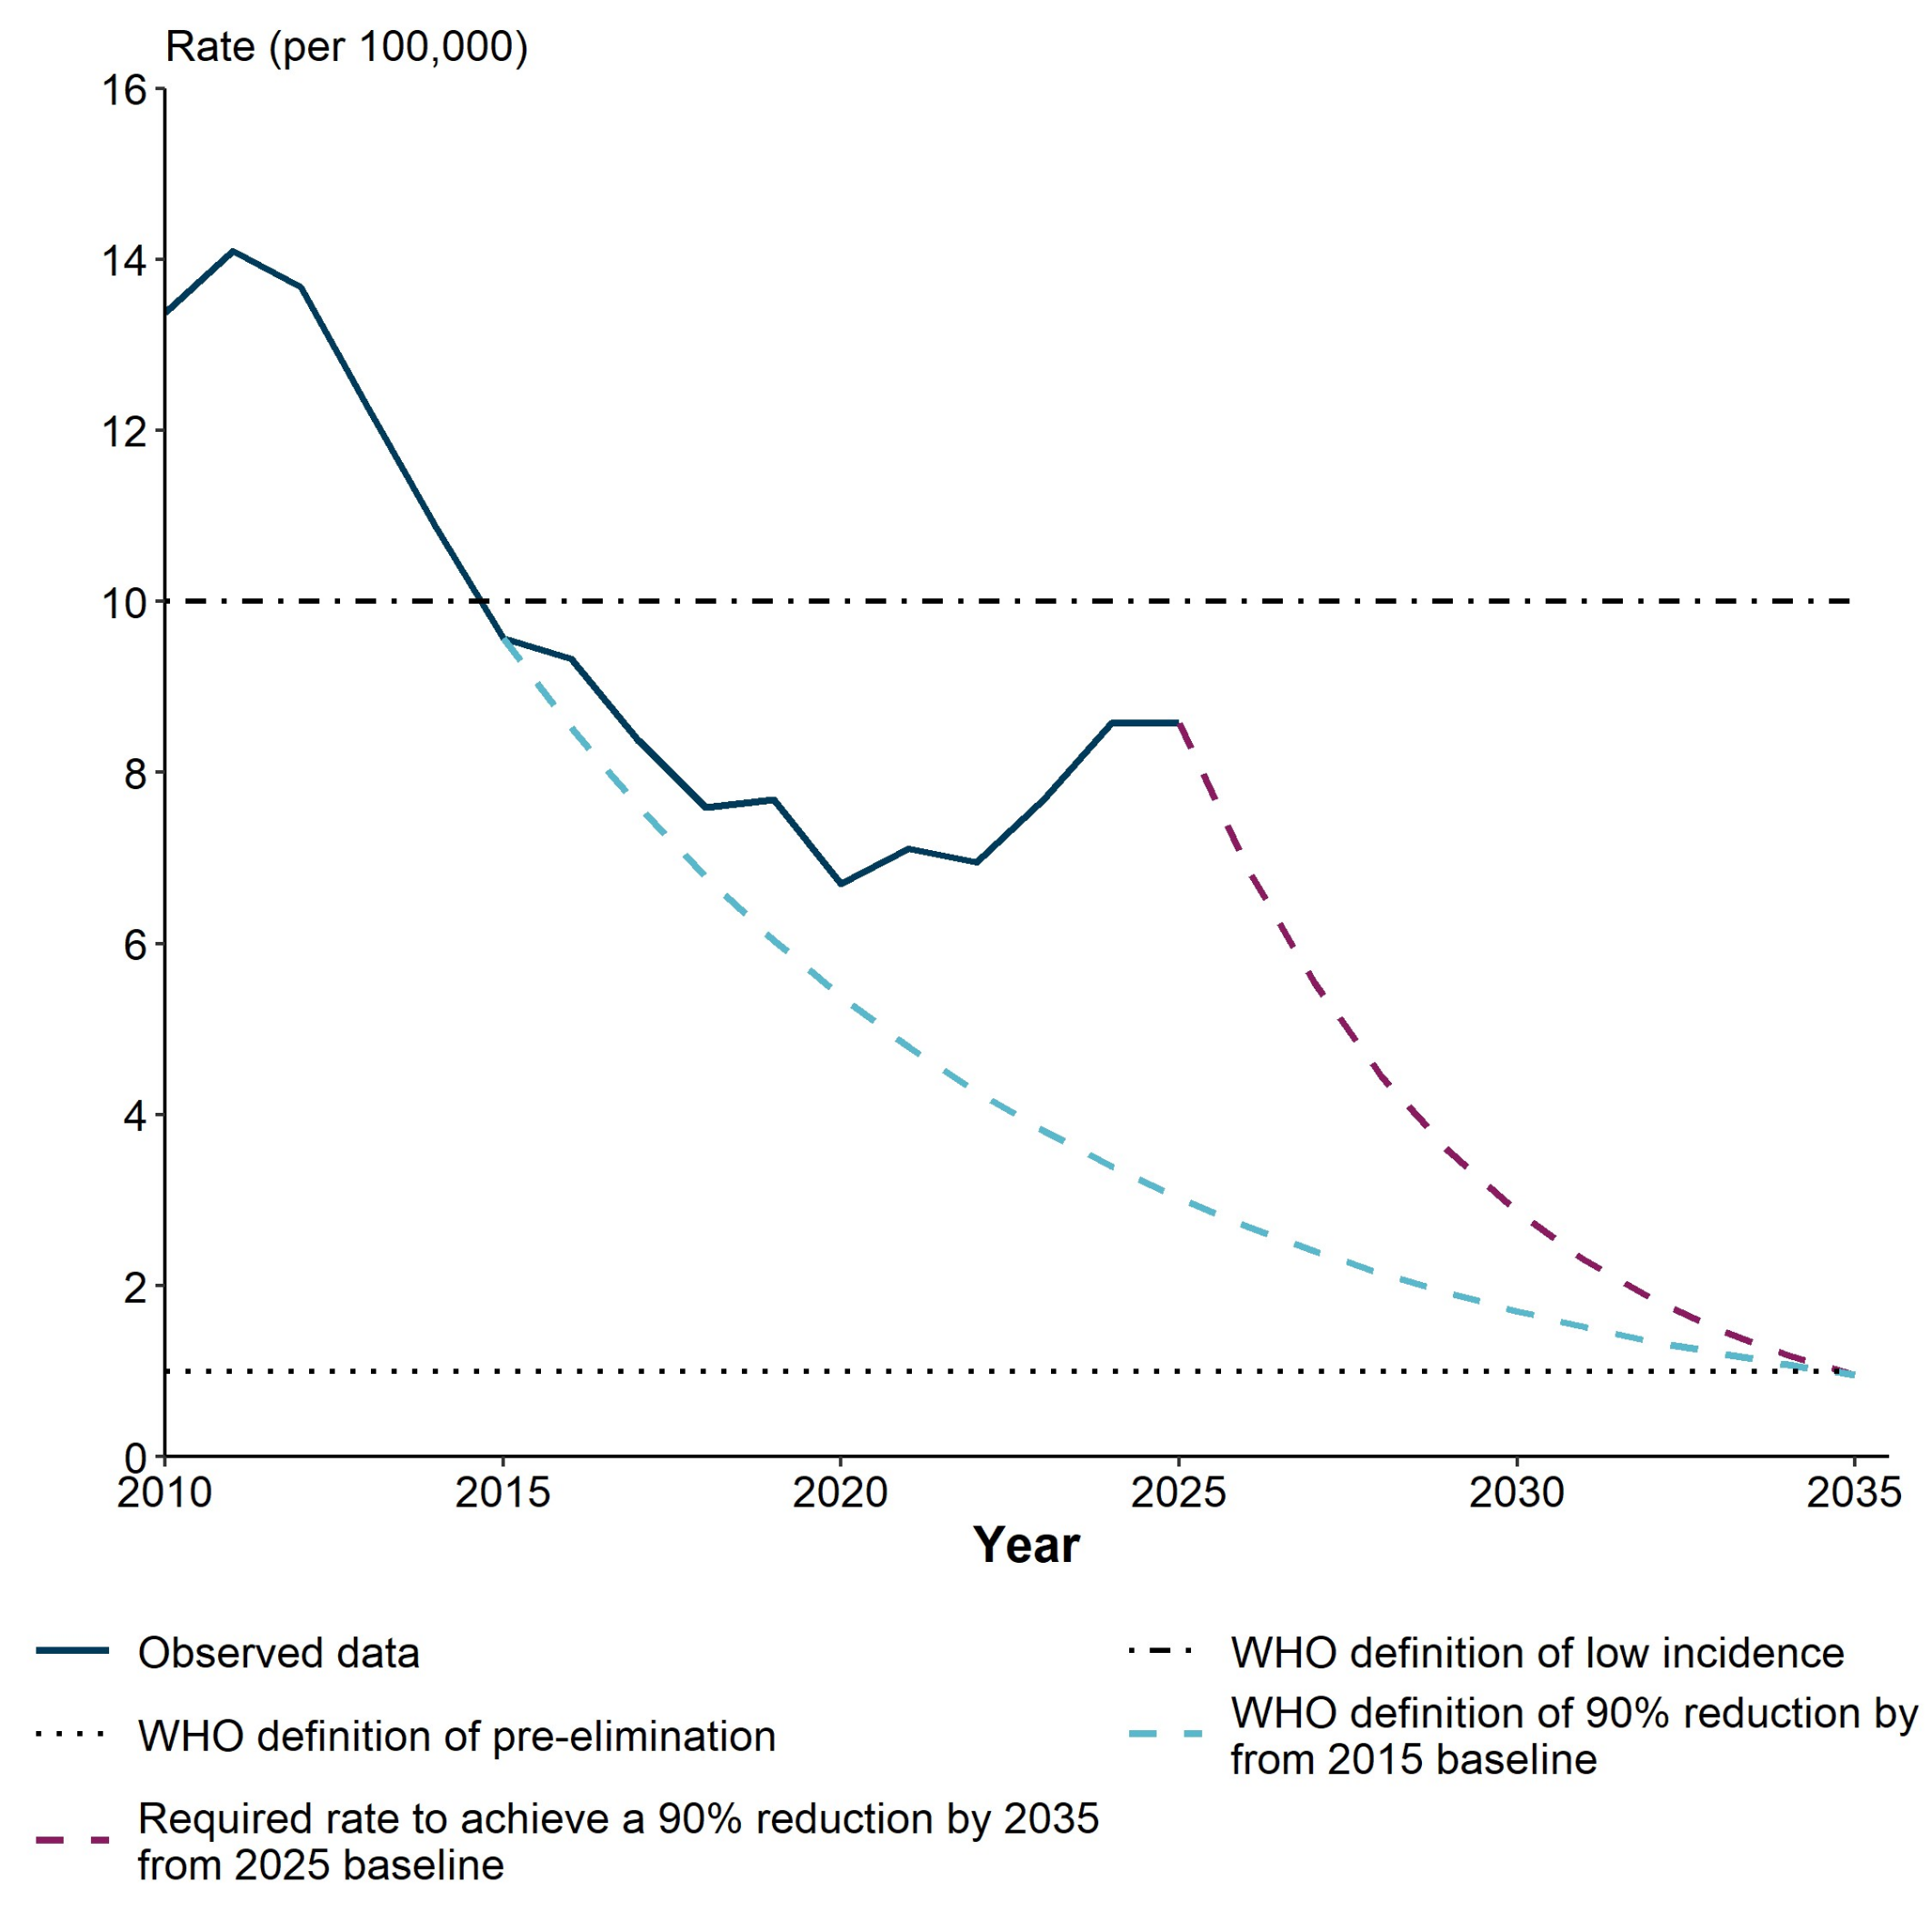
- an annual decrease of 19.7% will be needed for the UK to reach the World Health Organization (WHO) target of a 90% reduction in TB incidence between 2015 and 2035
- rifampicin-resistant or multidrug-resistant TB (RR or MDR) was detected in 2.1% of people (76 people overall) who were TB-culture positive, which is unchanged from 2024
- treatment completion for people expected to finish treatment within 12 months was similar to previous years at 84.5% across the UK; this ranged from 67.1% in Northern Ireland to 88.5% in Wales
TB notification rates in the UK and by country over time, 2000 to 2025
In 2025, the number of notifications fell by 1 to 5,937 (from 5,938) in 2024. The rate of TB notifications was 8.58 per 100,000 in 2025, the same as in 2024. This remains higher than the pre-pandemic years of 2017 to 2019 (Table 1). A decrease during the COVID-19 pandemic, and a rebound after, is observed in many countries, as reported in the WHO Global TB report. Tuberculosis rates reported by the UK Health Security Agency (UKHSA) are based on TB notifications whereas WHO rates are based on estimated incidence, leading to differences in reported TB rates between organisations.
Table 1. Number of TB notifications, rates and annual percentage change, UK, 2000 to 2025
| Year | Number of notifications | Notification rate per 100,000 | Lower CI | Upper CI | Annual change in notification numbers (percentage) | Annual change in rate (percentage) |
|---|---|---|---|---|---|---|
| 2000 | 6,685 | 11.35 | 11.08 | 11.63 | [z] | [z] |
| 2001 | 6,761 | 11.44 | 11.17 | 11.72 | 1.1 | 0.8 |
| 2002 | 7,288 | 12.28 | 12.00 | 12.57 | 7.8 | 7.3 |
| 2003 | 7,218 | 12.10 | 11.82 | 12.38 | -1.0 | -1.5 |
| 2004 | 7,588 | 12.66 | 12.38 | 12.95 | 5.1 | 4.6 |
| 2005 | 8,282 | 13.71 | 13.42 | 14.01 | 9.1 | 8.3 |
| 2006 | 8,307 | 13.66 | 13.37 | 13.96 | 0.3 | -0.4 |
| 2007 | 8,258 | 13.47 | 13.18 | 13.76 | -0.6 | -1.4 |
| 2008 | 8,489 | 13.73 | 13.44 | 14.03 | 2.8 | 1.9 |
| 2009 | 8,870 | 14.25 | 13.96 | 14.55 | 4.5 | 3.8 |
| 2010 | 8,395 | 13.38 | 13.10 | 13.67 | -5.4 | -6.1 |
| 2011 | 8,921 | 14.10 | 13.81 | 14.40 | 6.3 | 5.4 |
| 2012 | 8,715 | 13.68 | 13.40 | 13.97 | -2.3 | -3.0 |
| 2013 | 7,871 | 12.27 | 12.00 | 12.54 | -9.7 | -10.3 |
| 2014 | 7,032 | 10.88 | 10.63 | 11.14 | -10.7 | -11.3 |
| 2015 | 6,227 | 9.57 | 9.34 | 9.81 | -11.4 | -12.0 |
| 2016 | 6,119 | 9.33 | 9.10 | 9.57 | -1.7 | -2.5 |
| 2017 | 5,530 | 8.38 | 8.16 | 8.60 | -9.6 | -10.2 |
| 2018 | 5,030 | 7.59 | 7.38 | 7.80 | -9.0 | -9.4 |
| 2019 | 5,115 | 7.68 | 7.47 | 7.89 | 1.7 | 1.2 |
| 2020 | 4,475 | 6.70 | 6.51 | 6.90 | -12.5 | -12.8 |
| 2021 | 4,762 | 7.11 | 6.91 | 7.31 | 6.4 | 6.1 |
| 2022 | 4,702 | 6.95 | 6.75 | 7.15 | -1.3 | -2.3 |
| 2023 | 5,271 | 7.69 | 7.49 | 7.90 | 12.1 | 10.6 |
| 2024 | 5,938 | 8.58 | 8.36 | 8.80 | 12.7 | 11.6 |
| 2025 | 5,937 | 8.58 | 8.36 | 8.80 | 0.0 | 0.0 |
Note 1: CI stands for confidence interval (CI).
Note 2: [z] is not applicable.
Supplementary Table 1 of the accompanying data set shows the number of TB notifications and TB notification rates for England, Scotland, Wales and Northern Ireland from 2000 to 2025.
TB notifications and rates were similar in England between 2024 and 2025. They decreased in Northern Ireland, and increased in Scotland and Wales, as follows:
- England: 0.7% decrease, 5,449 notifications, rate 9.30 per 100,000, 95% CI (9.06 to 9.55)
- Wales: 9.2% increase, 107 notifications, rate 3.36 per 100,000, 95% CI (2.78 to 4.06)
- Scotland: 12.3% increase, 301 notifications, rate 5.48 per 100,000, 95% CI (4.89 to 6.14)
- Northern Ireland: 8.0% decrease, 80 notifications, rate 4.17 per 100,000, 95% CI (3.35 to 5.19)
Progress against WHO End TB elimination target
The WHO defines low TB incidence countries as those with fewer than 10 cases per 100,000 population. The WHO ‘end TB goal’ is a 90% reduction in TB incidence from 2015 to 2035 with a TB elimination target of less than 1 per 100,000. Figure 1 shows the rate of decline now required to reach these goals compared to that required in 2015 for each country and the UK combined. Supplementary Table 2 contains the projected rates for each devolved nation and the United Kingdom. From 2025 onwards, to achieve a 90% reduction from the 2015 baseline by 2035, the required average annual declines are:
- England: 19.6% decrease in notification rate
- Wales: 19.6% decrease in notification rate
- Scotland: 20.0% decrease in notification rate
- Northern Ireland: 22.4% decrease in notification rate
- United Kingdom: 19.7% decrease in notification rate
Figure 1a. Observed rates of decrease in TB notification in England from 2010 to 2035 compared with required rate of decrease to achieve the WHO End TB goal of a 90% reduction in TB incidence from 2015 to 2035
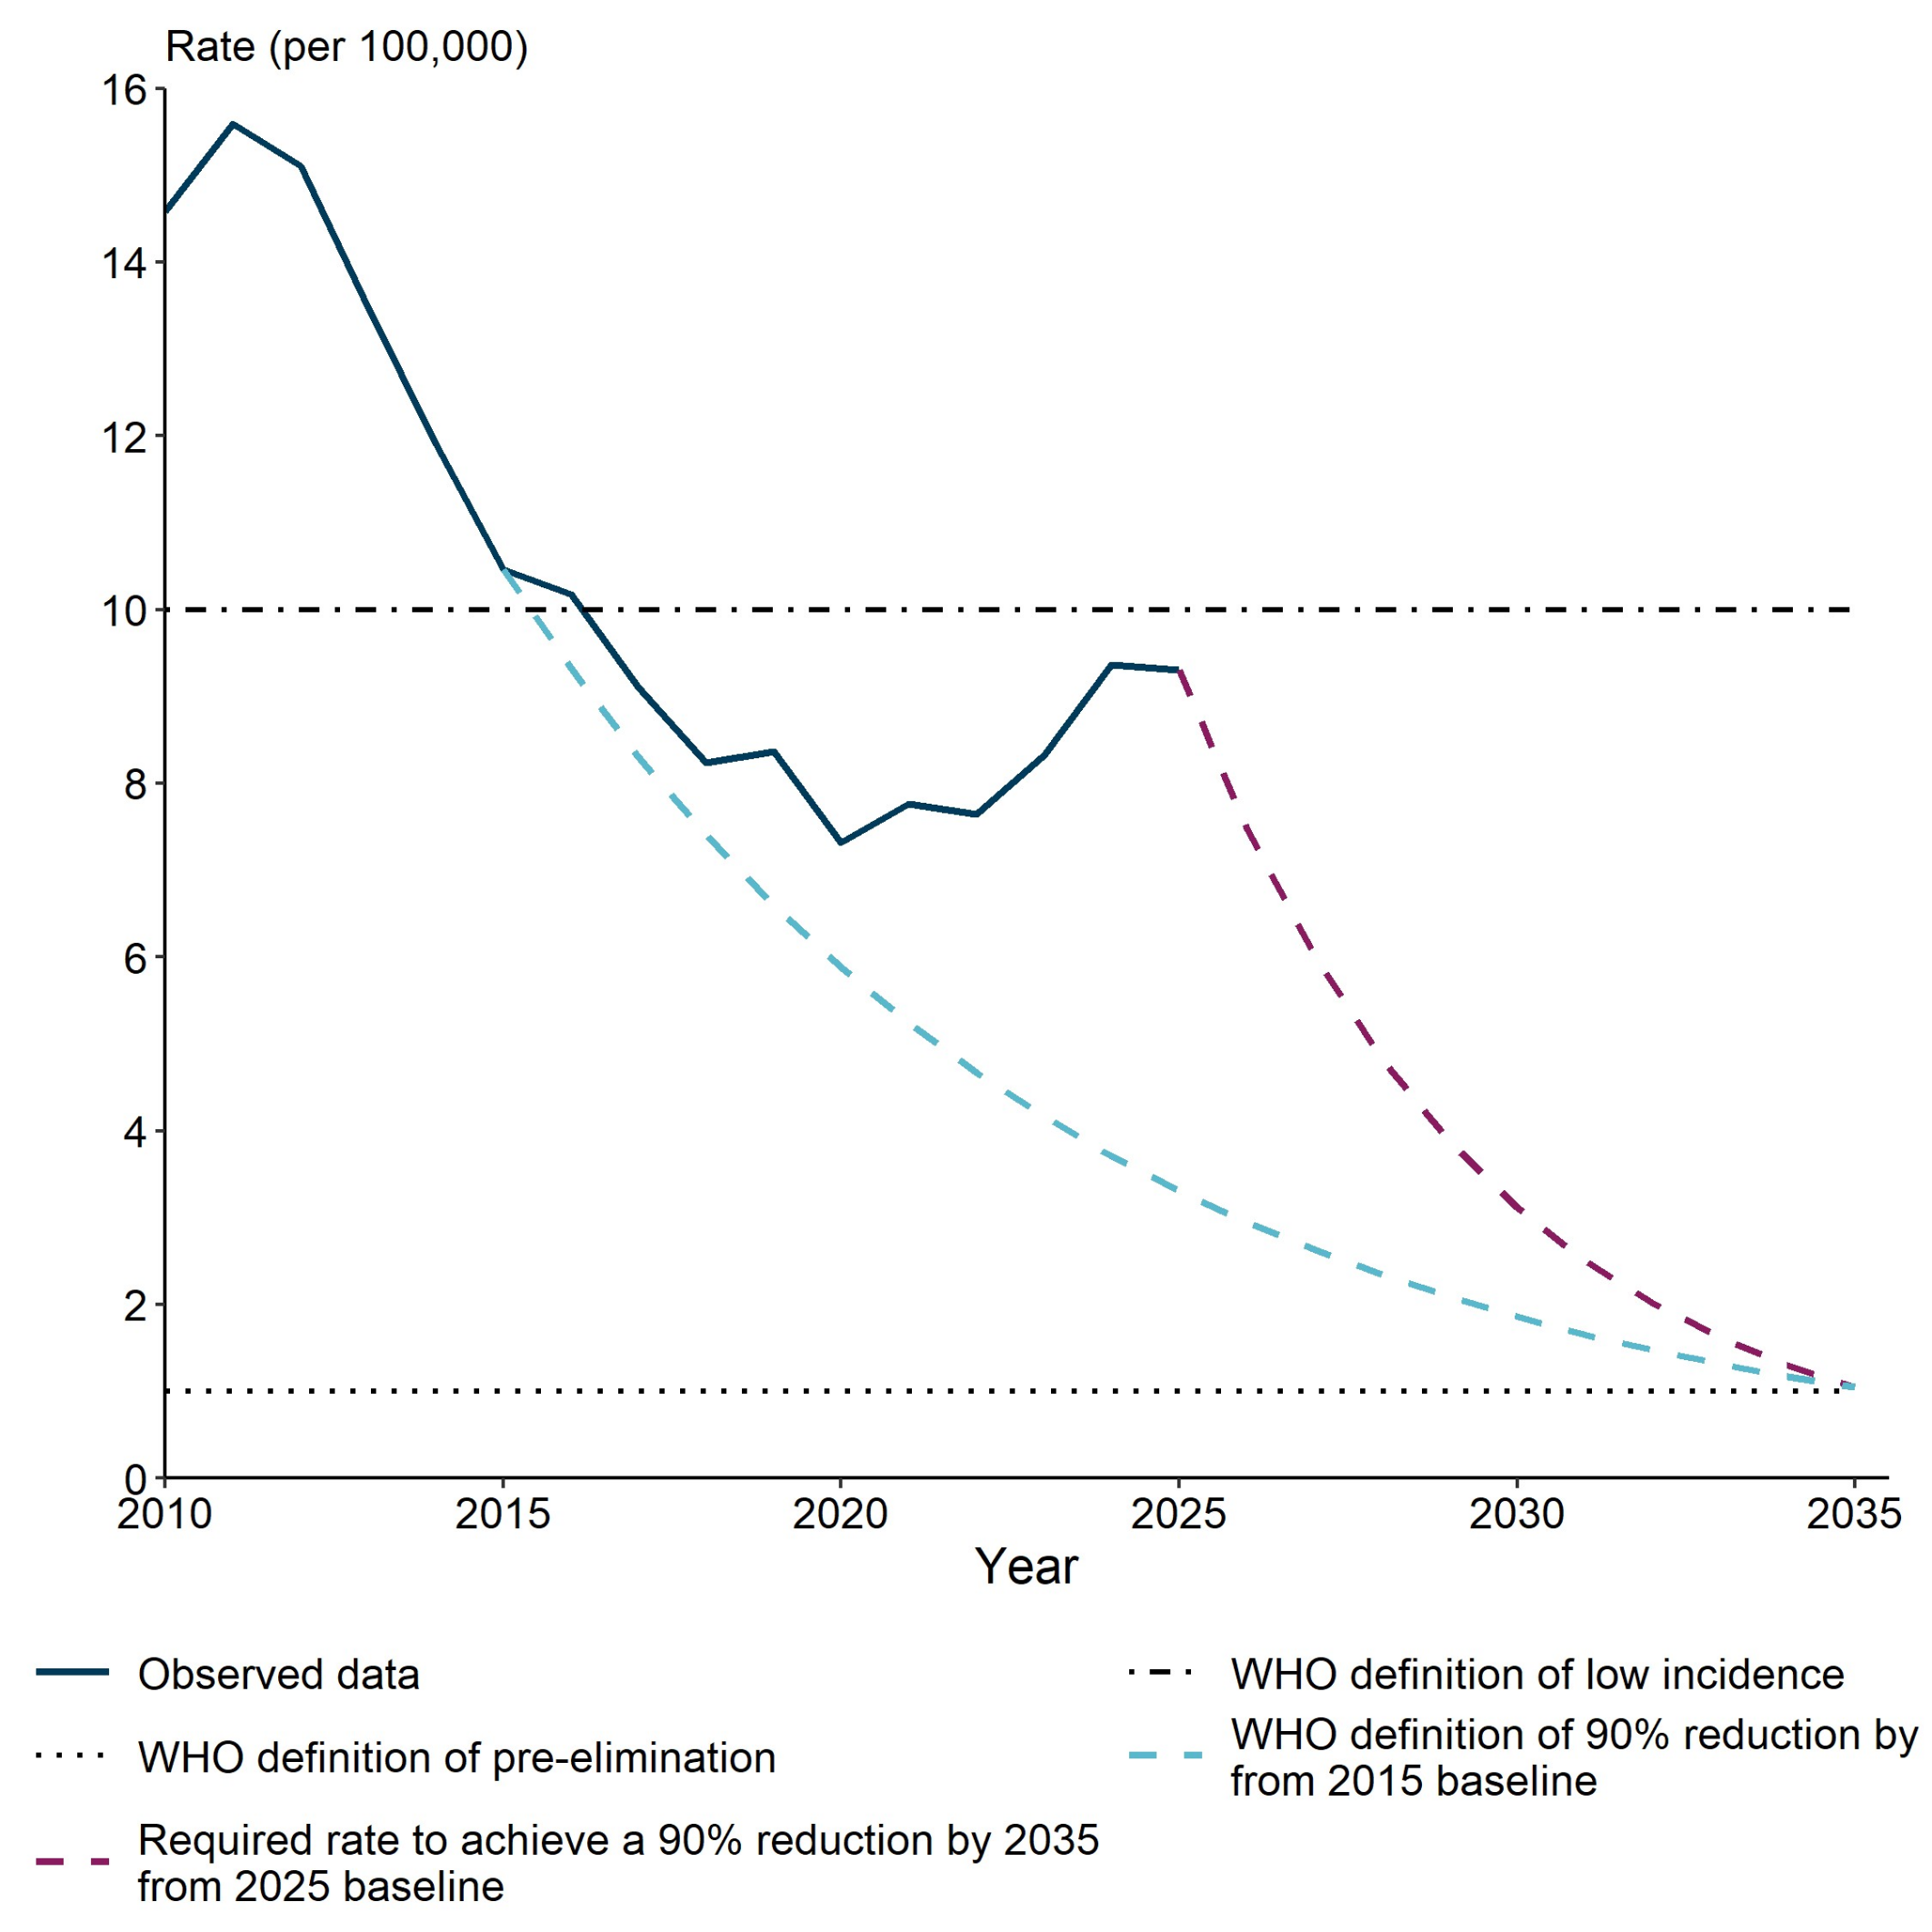
Figure 1b. Observed rates of decrease in TB notification in Wales from 2010 to 2035 compared with required rate of decrease to achieve the WHO End TB goal of a 90% reduction in TB incidence from 2015 to 2035
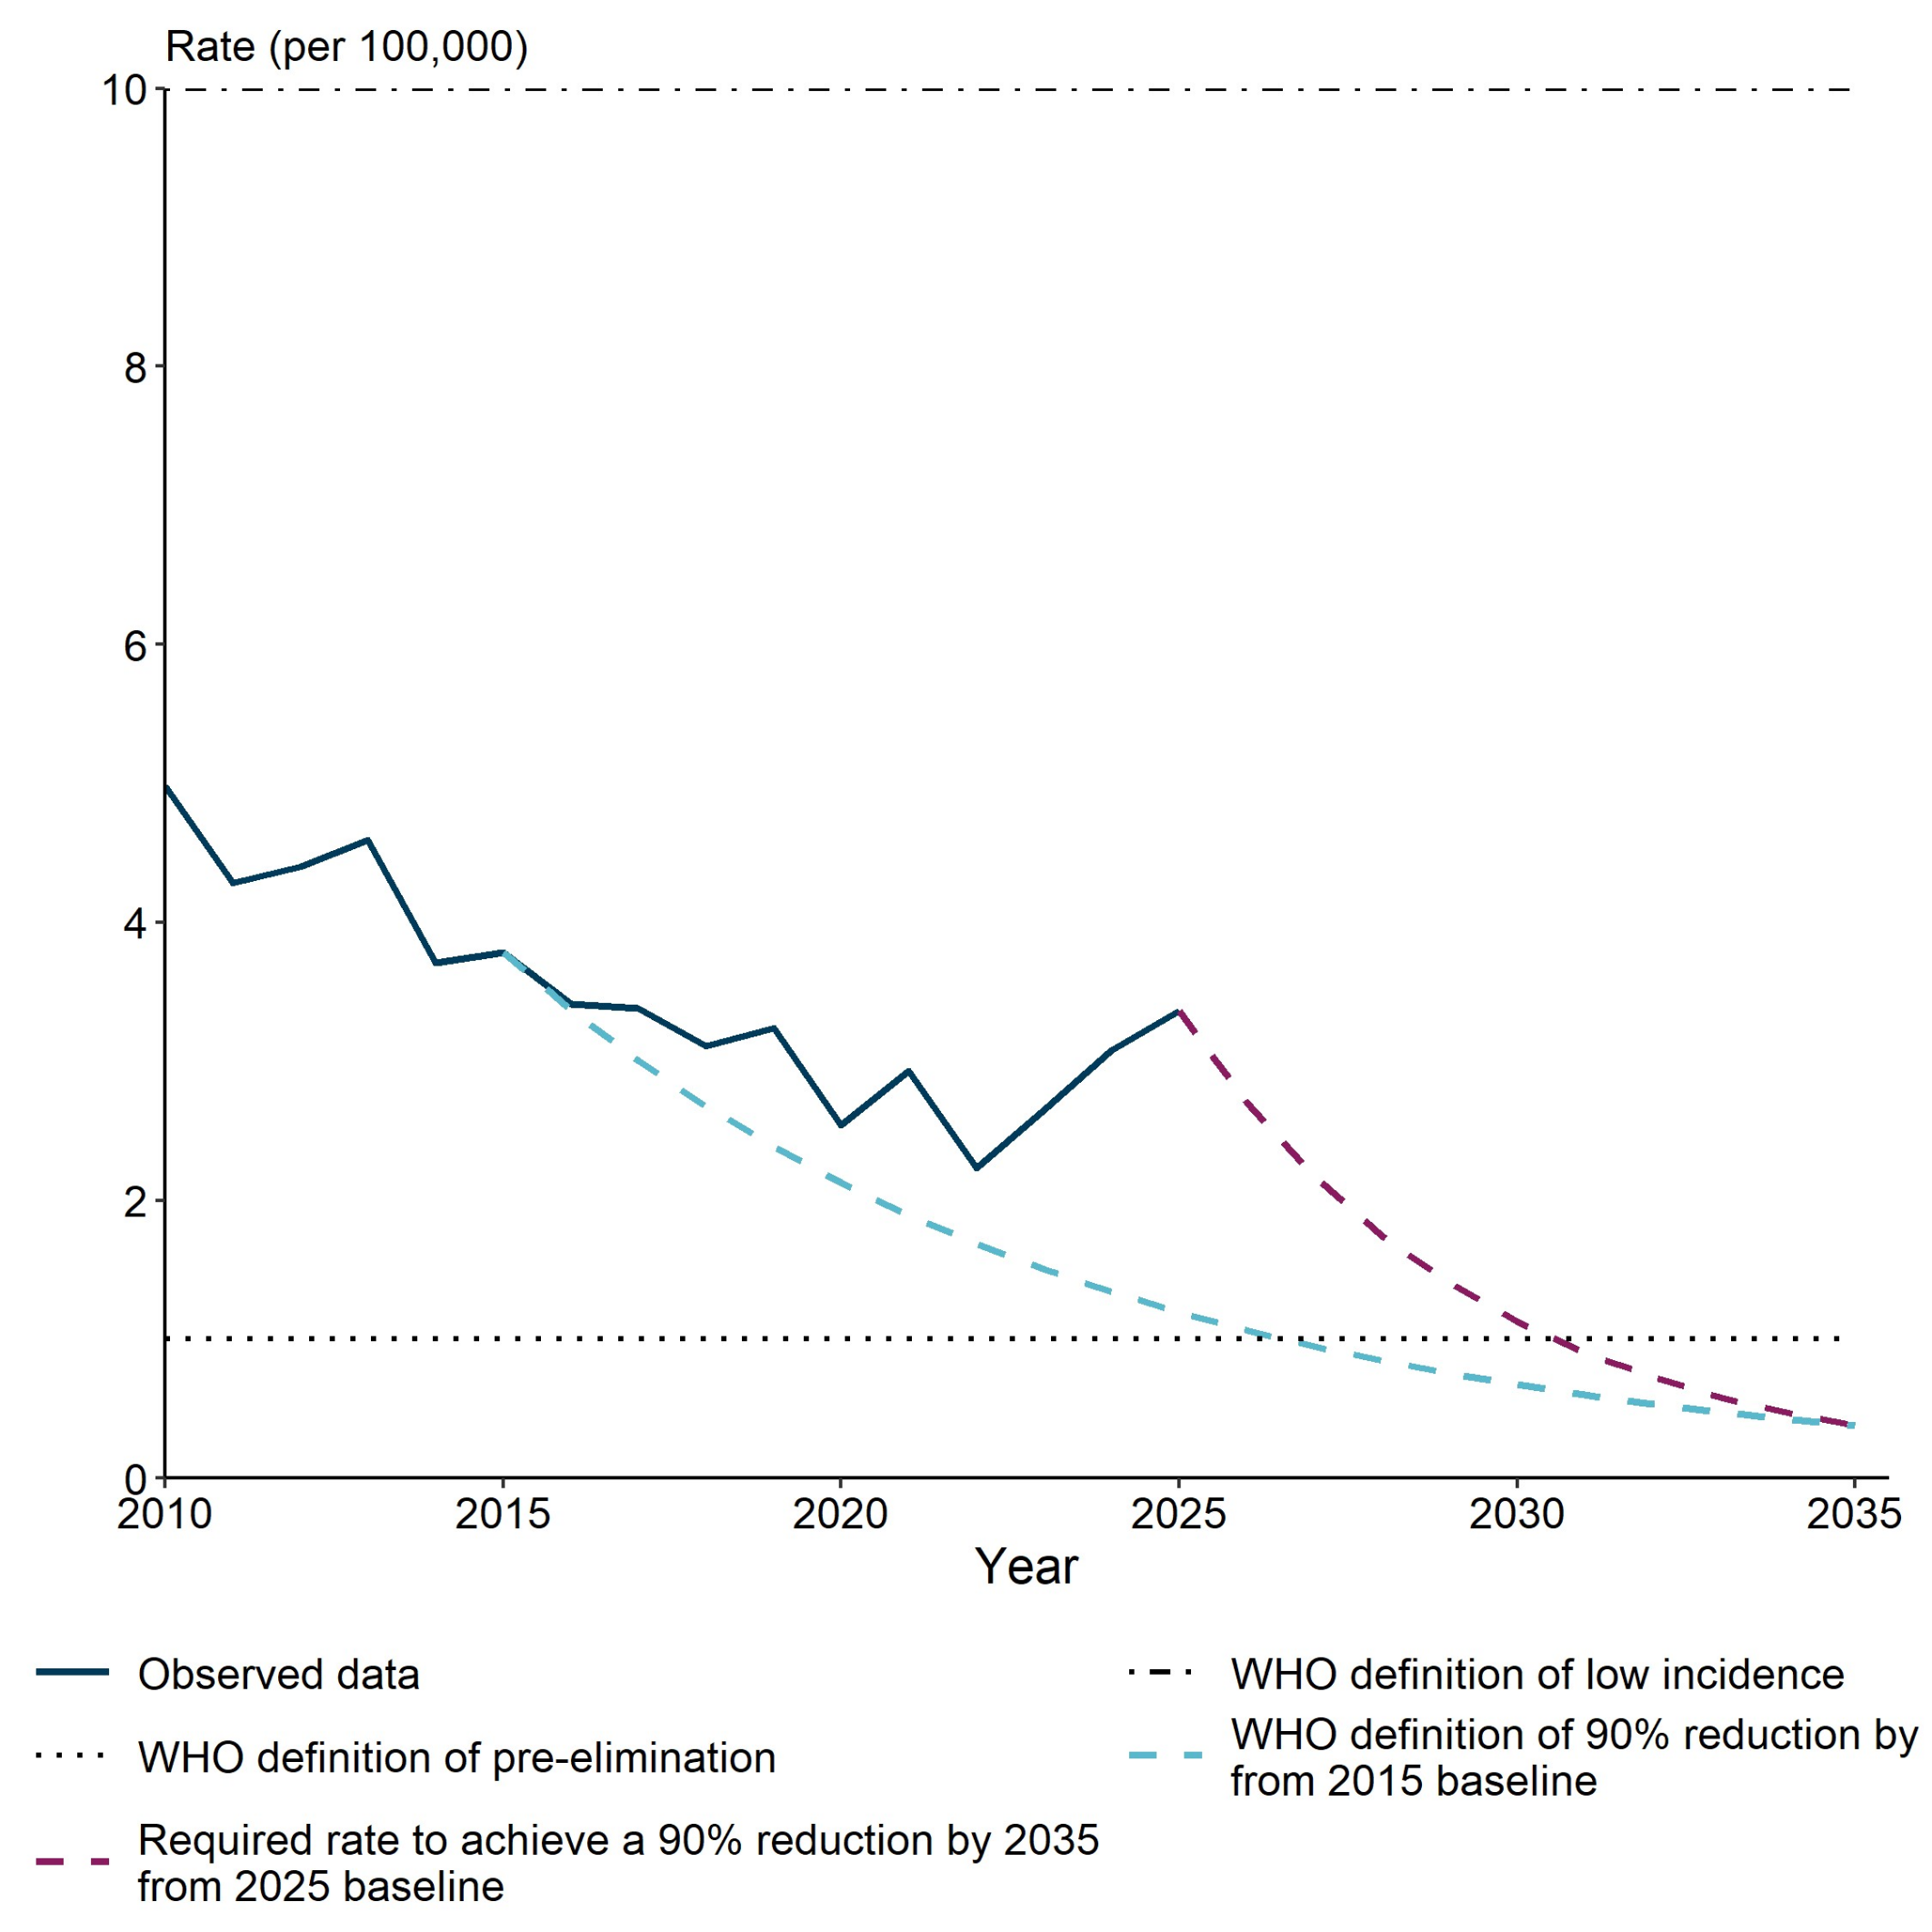
Figure 1c. Observed rates of decrease in TB notification in Scotland from 2010 to 2035 compared with required rate of decrease to achieve the WHO End TB goal of a 90% reduction in TB incidence from 2015 to 2035
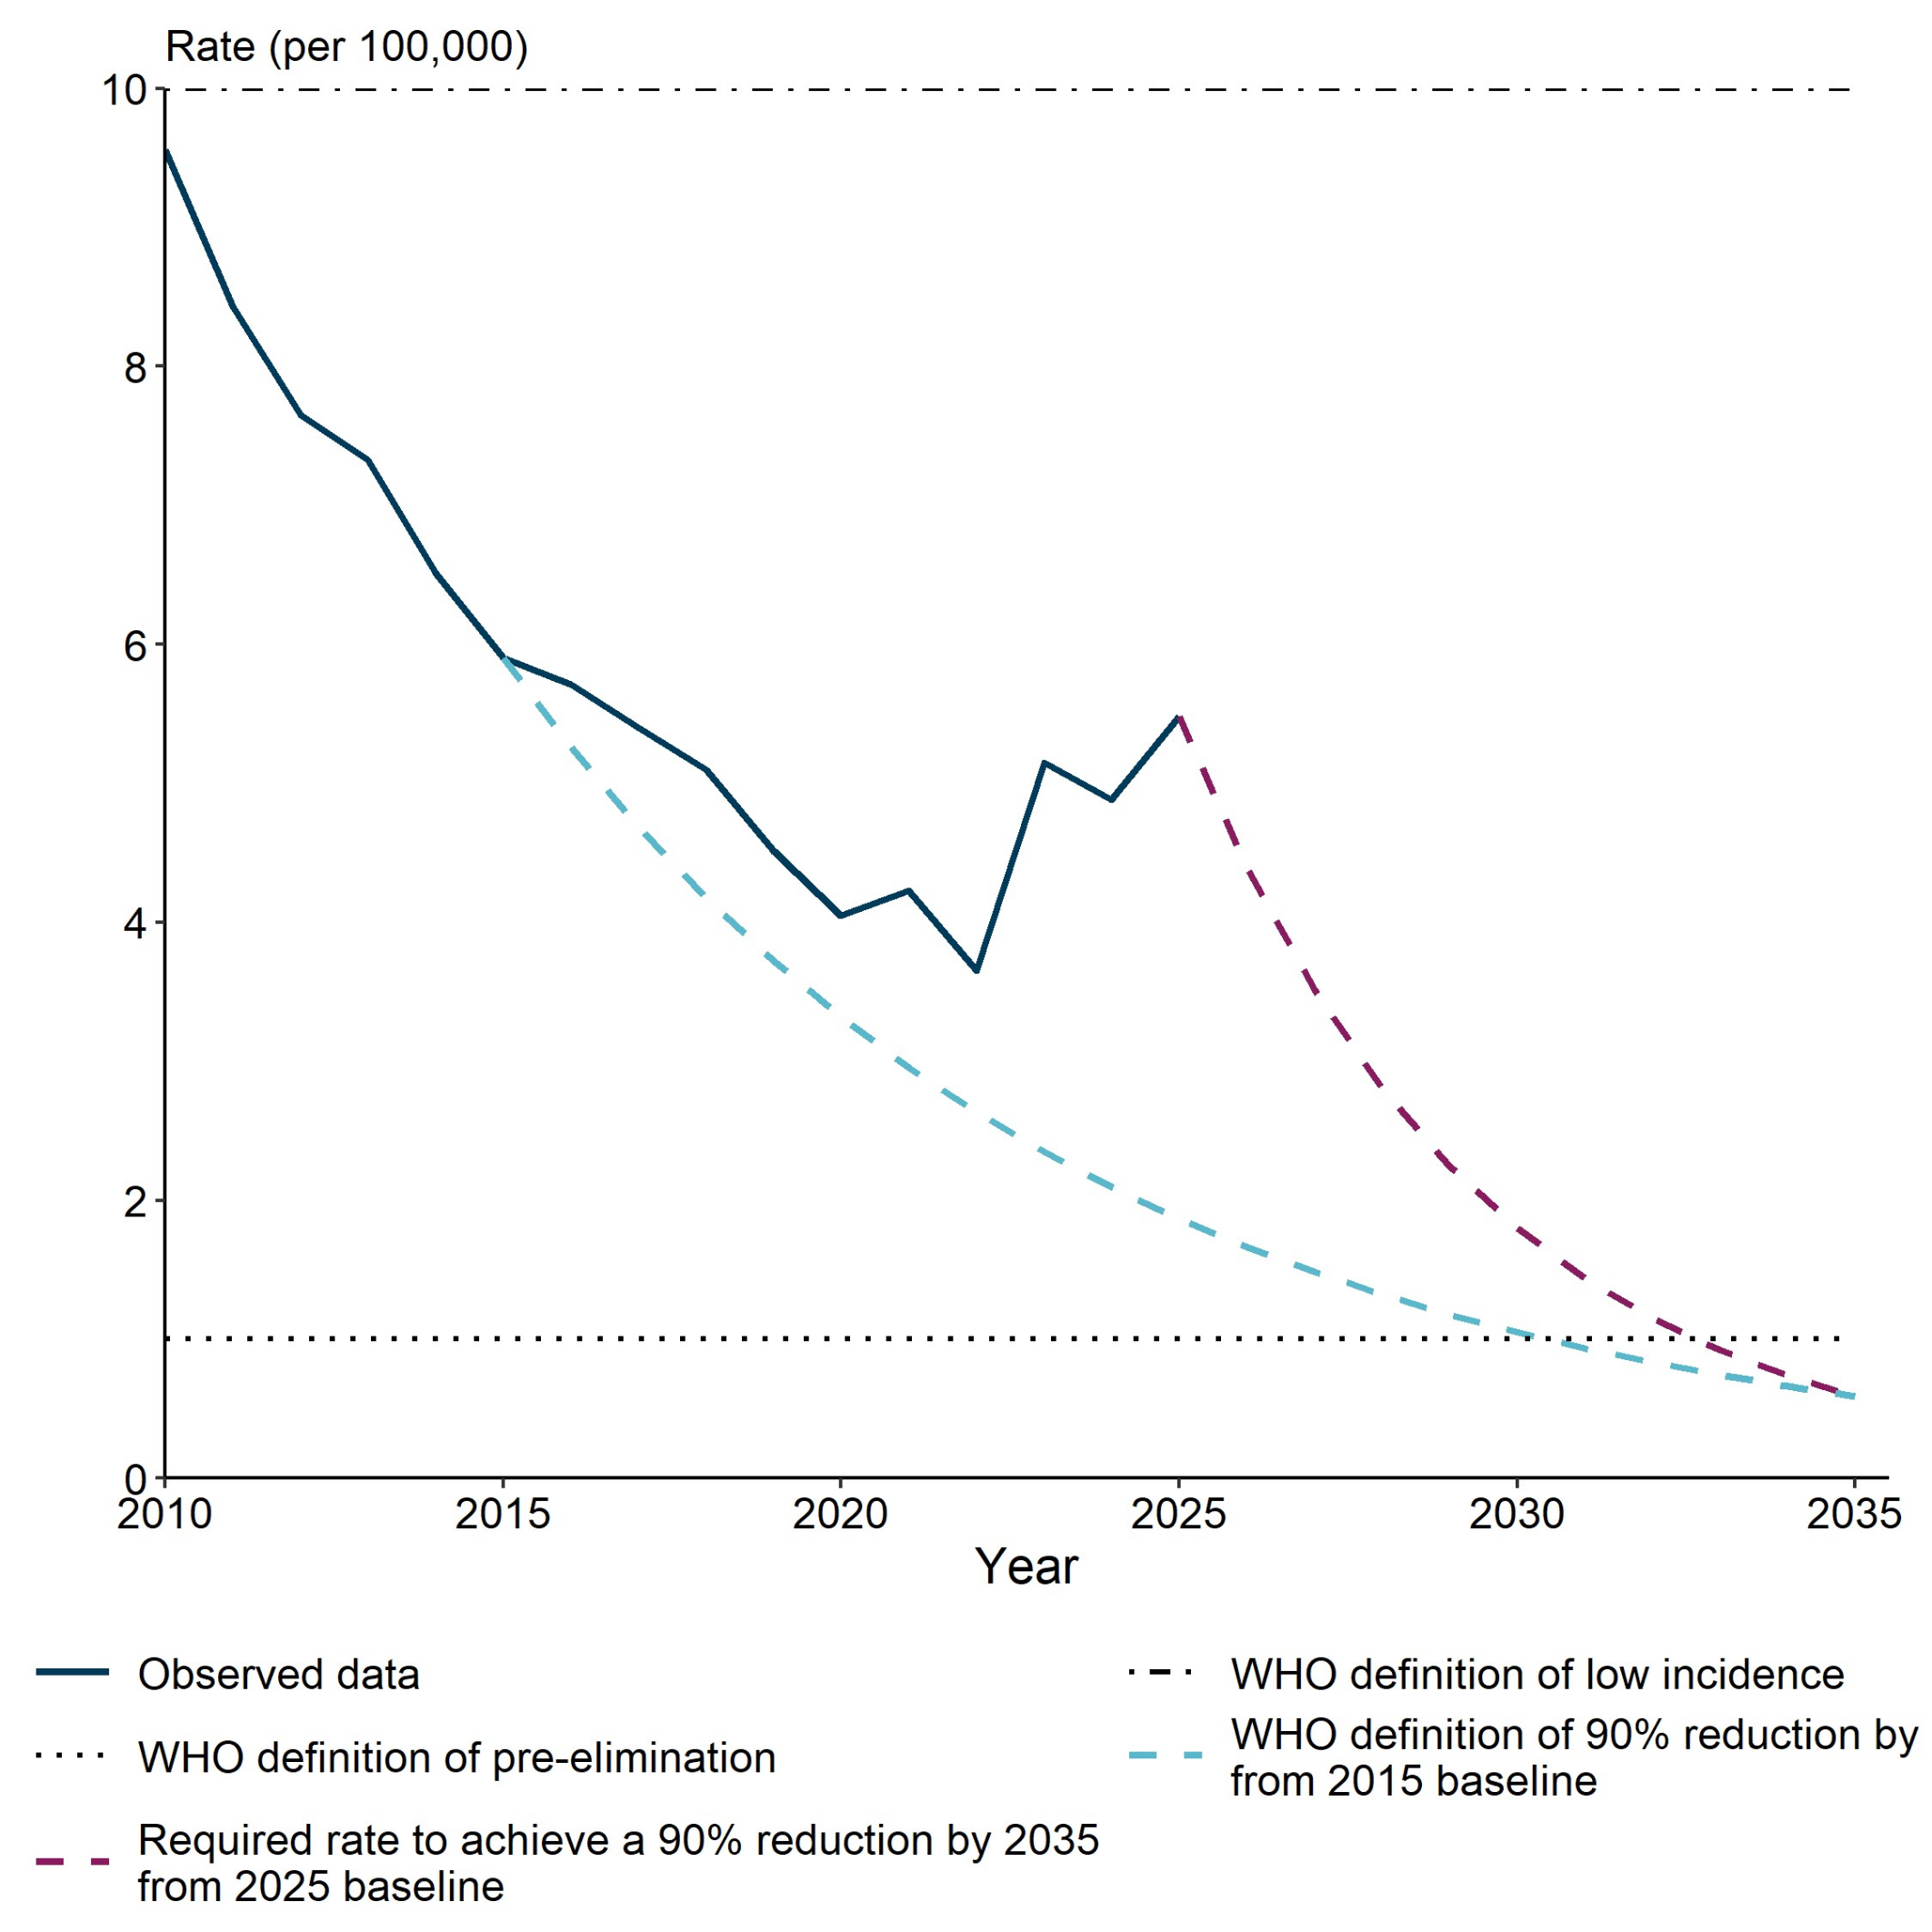
Figure 1d. Observed rates of decrease in TB notification in Northern Ireland from 2010 to 2035 compared with required rate of decrease to achieve the WHO End TB goal of a 90% reduction in TB incidence from 2015 to 2035
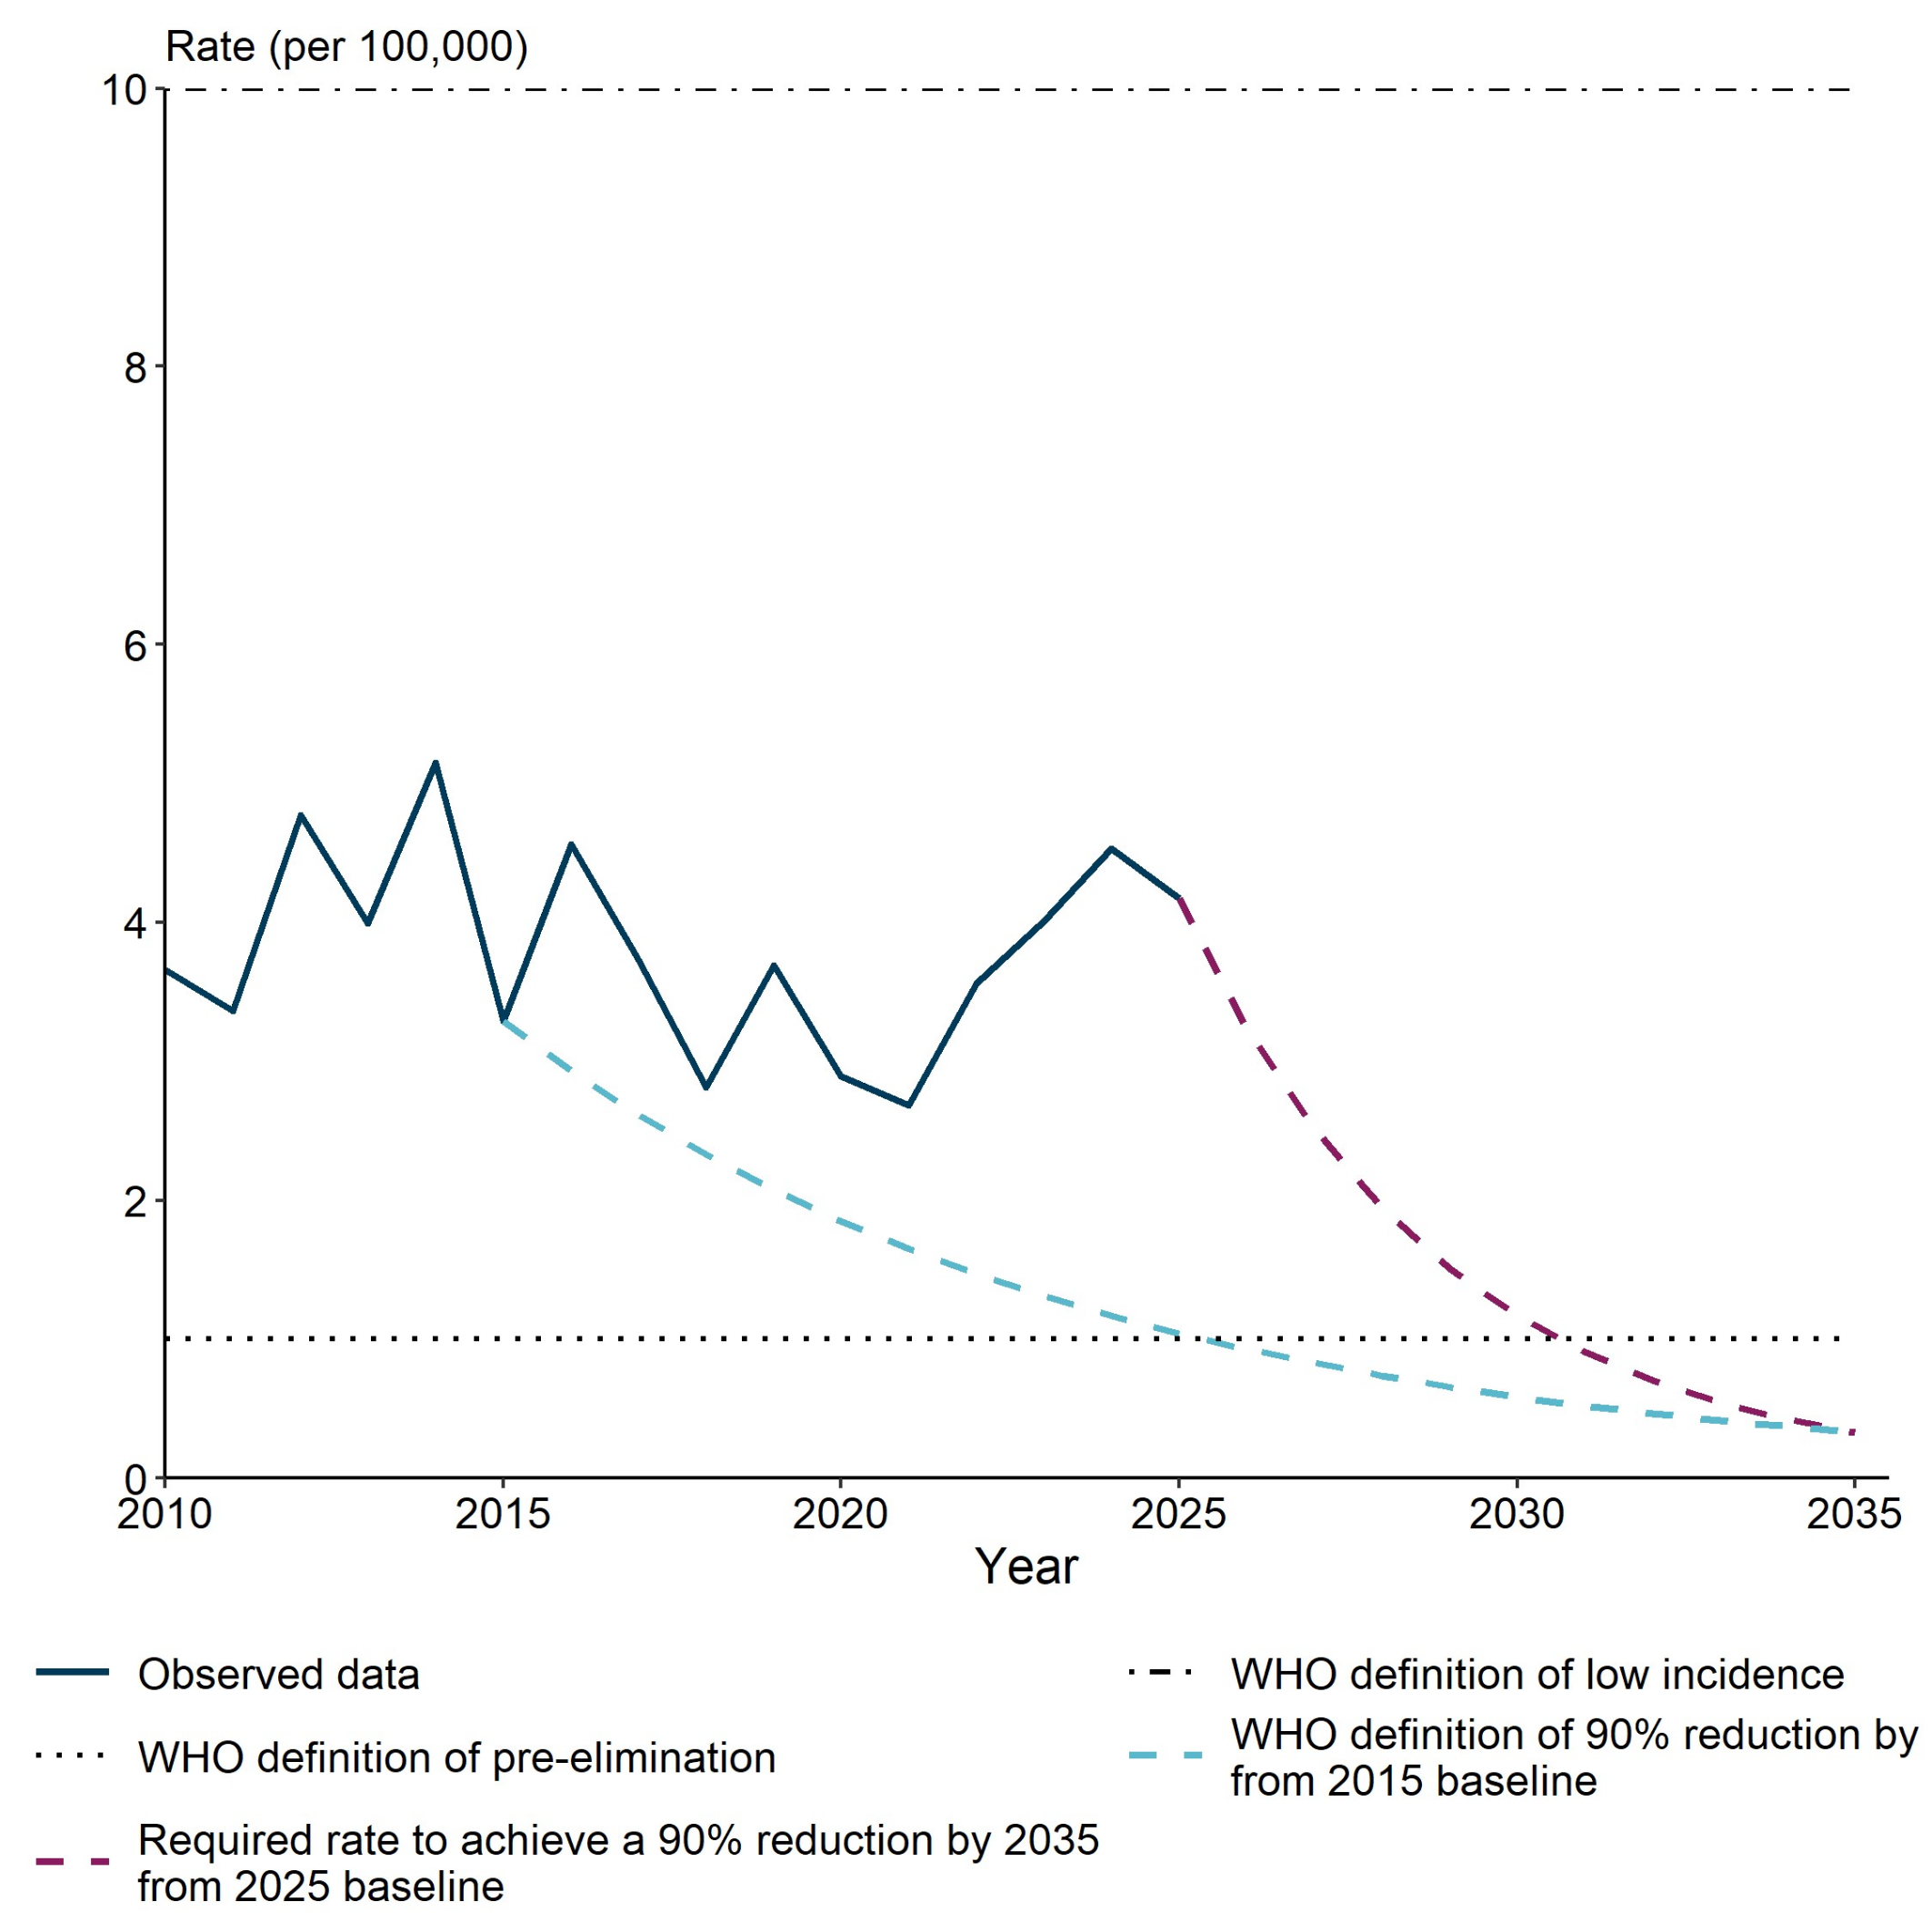
Figure 1e. Observed rates of decrease in TB notification in the United Kingdom from 2010 to 2035 compared with required rate of decrease to achieve the WHO End TB goal of a 90% reduction in TB incidence from 2015 to 2035
TB notification rates by geography in England
The UK Health Security Agency (UKHSA) region with the highest TB notification rate was London at 20.31 notifications per 100,000 population. This is approximately 4.8 times higher than the South West (4.23 per 100,000 population), which had the lowest TB notification rate (Table 2).
Table 2. Number of TB notifications and rates by UKHSA region, England, 2025
| UKHSA region | Number of notifications | Notification rate per 100,000 | Lower CI | Upper CI |
|---|---|---|---|---|
| London | 1,846 | 20.31 | 19.40 | 21.26 |
| North West | 670 | 8.66 | 8.03 | 9.34 |
| West Midlands | 634 | 10.25 | 9.48 | 11.08 |
| South East | 573 | 6.14 | 5.66 | 6.66 |
| East Midlands | 456 | 9.01 | 8.22 | 9.88 |
| Yorkshire and the Humber | 440 | 7.76 | 7.07 | 8.52 |
| East of England | 416 | 6.04 | 5.49 | 6.65 |
| South West | 249 | 4.23 | 3.74 | 4.79 |
| North East | 165 | 5.98 | 5.13 | 6.97 |
Note 1: CI stands for confidence interval.
TB notification rates are calculated down to lower tier local authority level by calculating the average TB notification rate over the 3 years up to and including 2025. This is done due to small numbers of annual notifications in some areas (Supplementary Table 3 of the accompanying data set). This data demonstrates that there is a large amount of variability within regions and even between lower-tier local authorities within the same area. For example, the 3-year average notification rates within the London UKHSA region in 2025 varied from 4.60 in Richmond upon Thames to 33.60 in the adjacent local authority, Hounslow, Brent and 42.85 notifications per 100,000 in Brent. In the East Midlands, Leicester had the highest rate of any local authority at 45.19 per 100,000, while 23 out of 34 of the lower tier local authorities in the region had rates lower than 5.00 per 100,000.
Culture confirmation in people notified with pulmonary and all TB notifications by country over time
Supplementary Table 4 of the accompanying data set shows the proportion of all TB notifications that were confirmed by a culture test. It also specifies the site of disease (pulmonary and non-pulmonary) by country and over time, from 2010 to 2025. Culture confirmation was higher in individuals with pulmonary TB, with 74.3% of cultures confirmed as TB, as pulmonary sites are easier to sample. This was compared with a confirmation rate of 61.2% for all TB notifications (pulmonary and non-pulmonary) in the UK in 2025.
In 2025, culture confirmation proportions for all TB notifications by country were:
- England: 60.2 %
- Wales: 73.8 %
- Scotland: 74.4%
- Northern Ireland: 62.5 %
Drug resistance by country over time
Supplementary Table 5 in the accompanying data set shows the number and proportion of people notified with TB who were culture confirmed as having some form of TB resistance. For instance, some were resistant to isoniazid alone (isoniazid mono-resistance, INH-R) or had multidrug-resistant TB (MDR-TB), defined as resistant to rifampicin and isoniazid or rifampicin-resistant (RR-TB). This was with or without evidence of resistance to isoniazid, which is reported together with MDR-TB. Drug-resistant TB in all countries in the UK remains low, although the rate of MDR or RR-TB in 2025 in England is the highest observed so far. This increase may still be due to fluctuations resulting from the small numbers of notifications each year.
MDR or RR TB rates (proportions) of all culture-confirmed TB notifications by country were:
- England: 2.1%, 68 cases
- Wales 6.3%, 5 cases
- Scotland: 0.9%, 2 cases
- Northern Ireland: 2.0%, 1 case
- UK: 2.1%, 76 cases
TB treatment outcomes
Treatment completion at 12 months varied by country for individuals in the UK treated for drug-sensitive TB and notified in 2024, with an expected treatment duration of fewer than 12 months (Table 3). The highest proportion was in Wales at nearly 88.5%, with the lowest observed in Northern Ireland. Treatment completion at 12 months for this cohort by country and over time are available in Supplementary Table 5 of the accompanying data set and show that there are no consistent improvements or otherwise over time for any of the countries.
Overall, 3.5% of individuals notified in 2024 and treated for drug-sensitive TB across the UK had died at their last recorded treatment outcome at the time of data extraction, while 4.7% were lost to follow-up (Table 4).
Table 3. TB outcome at 12 months for drug sensitive TB notifications with expected duration of less than 12 months by country, UK, 2024
| Outcome | England | Wales | Scotland | Northern Ireland | United Kingdom |
|---|---|---|---|---|---|
| Number who completed | 4,068 | 77 | 199 | 49 | 4,393 |
| Percentage completed | 84.8 | 88.5 | 83.6 | 67.1 | 84.5 |
| Number who died | 138 | 5 | 12 | 4 | 159 |
| Percentage who died | 2.9 | 5.7 | 5.0 | 5.5 | 3.1 |
| Number lost to follow-up | 228 | 3 | 4 | 4 | 239 |
| Percentage lost to follow-up | 4.8 | 3.4 | 1.7 | 5.5 | 4.6 |
| Number still on treatment | 123 | 0 | 9 | 1 | 133 |
| Percentage still on treatment | 2.6 | 0.0 | 3.8 | 1.4 | 2.6 |
| Number who stopped treatment | 83 | 0 | 6 | 1 | 90 |
| Percentage who stopped treatment | 1.7 | 0.0 | 2.5 | 1.4 | 1.7 |
| Number not evaluated | 158 | 2 | 8 | 14 | 182 |
| Percentage not evaluated | 3.3 | 2.3 | 3.4 | 19.2 | 3.5 |
| Total | 4,798 | 87 | 238 | 73 | 5,196 |
Note 3: excludes people with culture-confirmed MDR or RR-TB or those treated with an MDR-TB regimen and those diagnosed at postmortem. Also excludes those with central nervous system (CNS), spinal, miliary or cryptic-disseminated TB. This is because these people are not expected to complete treatment within 12 months.
Note 4: ‘Not evaluated’ includes patients who are missing, unknown and transferred out.
Table 4. Last recorded TB outcome for the entire drug sensitive TB cohort by country, UK, 2024
| Outcome | England | Wales | Scotland | Northern Ireland | United Kingdom |
|---|---|---|---|---|---|
| Number who completed | 4,643 | 86 | 224 | 58 | 5,011 |
| Percentage completed | 86.9 | 89.6 | 85.2 | 69.9 | 86.7 |
| Number who died | 177 | 5 | 17 | 4 | 203 |
| Percentage who died | 3.3 | 5.2 | 6.5 | 4.8 | 3.5 |
| Number lost to follow-up | 258 | 4 | 5 | 7 | 274 |
| Percentage lost to follow-up | 4.8 | 4.2 | 1.9 | 8.4 | 4.7 |
| Number still on treatment | 42 | 0 | 4 | 0 | 46 |
| Percentage still on treatment | 0.8 | 0.0 | 1.5 | 0.0 | 0.8 |
| Number who stopped treatment | 99 | 0 | 7 | 1 | 107 |
| Percentage who stopped treatment | 1.9 | 0.0 | 2.7 | 1.2 | 1.9 |
| Number not evaluated | 121 | 1 | 6 | 13 | 141 |
| Percentage not evaluated | 2.3 | 1.0 | 2.3 | 15.7 | 2.4 |
| Total | 5,340 | 96 | 263 | 83 | 5,782 |
Note 4: ‘Not evaluated’ includes patients who are missing, unknown and transferred out.
Note 5: excludes people with culture-confirmed MDR or RR-TB or those treated with an MDR-TB regimen and those diagnosed at postmortem.
Note 6: data is provisional and subject to further updates.
Data sources and methodology
The latest ONS population estimates were for 2024 released in 2025. Data from 2024 were used as denominators for 2025.
Data sources and comprehensive methodological information can be found in the Quality and Methodology Information (QMI) report.
Background information
Tuberculosis (TB) is a notifiable disease. Enhanced Tuberculosis Surveillance (ETS) was introduced across England Wales and Northern Ireland in 2000 and the equivalent scheme in Scotland, Enhanced Surveillance of Mycobacterial Infections (ESMI). From 2021, reporting of TB notifications in all countries except Scotland was through the replacement National TB Surveillance System (NTBS). Data from the surveillance systems is compiled for the purpose of UK reporting.
Only individuals with disease caused by Mycobacterium tuberculosis complex (MTBC) are reported. Individuals were denotified and removed from the data set if the infective agent was identified as non-MTBC or M. bovis Bacillus Calmette-Guerin (BCG) subspecies.
Related statistics
UKHSA produces detailed public health reports with TB data for England.
Public Health Wales produces TB data for Wales.
Health Protection Scotland produces TB data for Scotland.
Public Health Agency Northern Ireland produces TB data for Northern Ireland.
Further information and contact details
Feedback and contact information
If you have any queries or would like to provide feedback, please contact TBunit@ukhsa.gov.uk
Official statistics
Our statistical practice is regulated by the Office for Statistics Regulation (OSR). OSR sets the standards of trustworthiness, quality and value in the Code of Practice for Statistics that all producers of Official Statistics should adhere to. You are welcome to contact us directly by emailing [insert statistical author’s shared email inbox address] with any comments about how we meet these standards. Alternatively, you can contact OSR by emailing regulation@statistics.gov.uk or via the OSR website.
UKHSA is committed to ensuring that these statistics comply with the Code of Practice for Statistics. This means users can have confidence in the people who produce UKHSA statistics because our statistics are robust, reliable and accurate. Our statistics are regularly reviewed to ensure they support the needs of society for information.