RRCGB 2025: Road safety factors
Published 30 July 2026

© Crown copyright 2026
This publication is licensed under the terms of the Open Government Licence v3.0 except where otherwise stated. To view this licence, visit nationalarchives.gov.uk/doc/open-government-licence/version/3 or write to the Information Policy Team, The National Archives, Kew, London TW9 4DU, or email: psi@nationalarchives.gov.uk.
Where we have identified any third party copyright information you will need to obtain permission from the copyright holders concerned.
This publication is available at https://www.gov.uk/government/statistics/reported-road-casualties-great-britain-final-results-2025/rrcgb-2025-road-safety-factors
About this chapter
This chapter reports on the trends in Road Safety Factors (RSFs) recorded for road casualty collisions in Great Britain. RSFs provide insight into why and how road collisions occur.
RSFs were introduced in 2023 to replace Contributory Factors (CFs) and are gradually being phased in. To allow comparisons in trends and data collection methods, CFs from 2024 and before have been converted to RSFs and shown alongside RSFs recorded directly in 2024 and 2025.
Unless otherwise stated, RSF percentages are based only on records where at least one RSF was assigned, and not all reported collisions, or casualties. More than one RSF can be assigned to the same collision, participant or casualty, so percentages will not add to 100%.
1. Main findings
Based on data on road collisions in Great Britain reported to the police, in 2025:
-
Behaviour or inexperience factors were the most commonly recorded Road Safety Factors (RSFs). In 2025, 74% of collisions with at least one RSF assigned were assigned a factor from this section, which was the most common for both fatal and non-fatal collisions.
-
The pattern of factors recorded in fatal collisions differed from that seen in collisions overall. Speed-related and distraction or impairment factors were more often assigned in fatal collisions, with 52% of fatal collisions being assigned a speed RSF compared to 34% of all collisions and 44% of fatal collisions being assigned a distraction or impairment RSF compared to 29% of all collisions
-
Ineffective observation by a driver, rider or pedestrian remained the most commonly assigned individual factor. In 2025, this factor was assigned to 50% of fatal or serious collisions (FSCs), more than twice the proportion of the next most commonly assigned factor.
-
Speed-related factors featured prominently in the most severe collisions. Three speed-related factors — travelling too fast for conditions, exceeding the speed limit, and being aggressive, dangerous or reckless — were all among the most commonly assigned factors in fatal collisions.
-
RSFs highlight that collisions often result from multiple contributing circumstances. Most collisions with factors recorded were assigned more than one RSF, reflecting the combination of behaviours, conditions and circumstances that can contribute to road collisions.
Further breakdowns and analysis are available in the sections below and in the accompanying data tables and guidance.
2. RSFs by section
Chart 1 shows the proportion of fatal, fatal or serious and all collisions with at least one factor recorded that fall into each RSF section in 2025. The 3 sections with the largest number of collisions in 2025 were:
- Behaviour or inexperience
- Speed
- Distraction or impairment
In 2025, speed and distraction or impairment RSFs were more likely to be assigned to fatal collisions compared to collisions of all severities:
- Speed RSFs were assigned to 52% of fatal collisions compared to 34% of all collisions.
- Similarly, distraction or impairment RSFs were assigned to 44% of fatal collisions compared to 29% of all collisions.
Chart 1: Proportion of collisions by severity with RSFs assigned, by RSF section in Great Britain, 2025 RAS0701
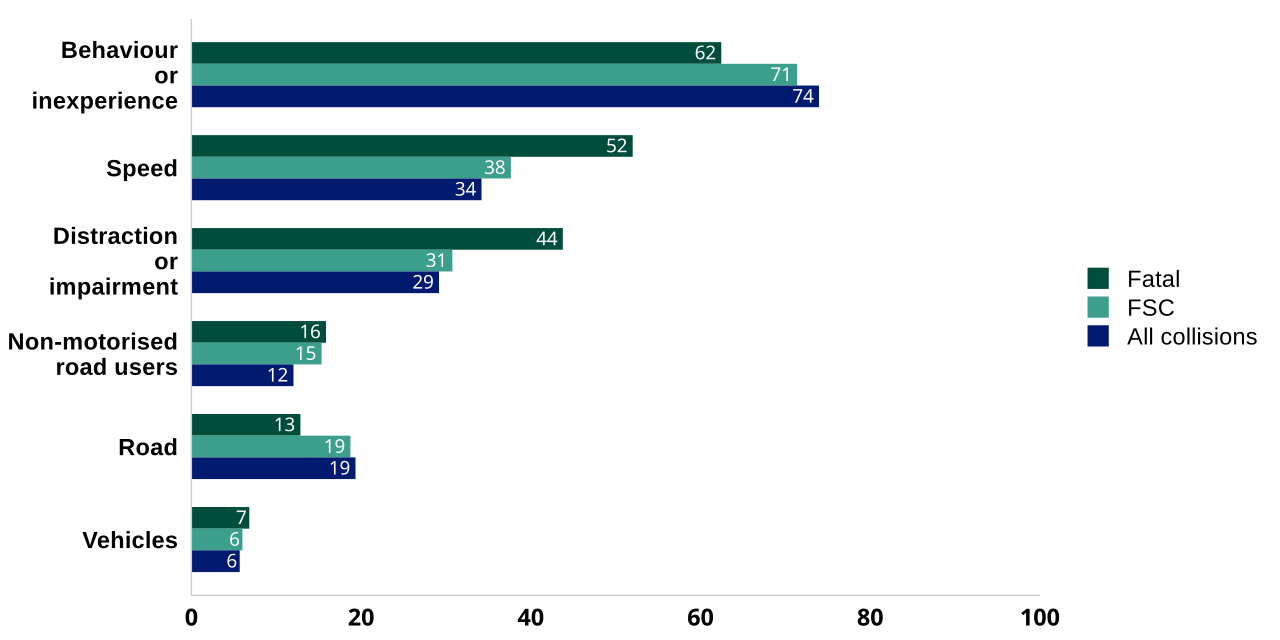
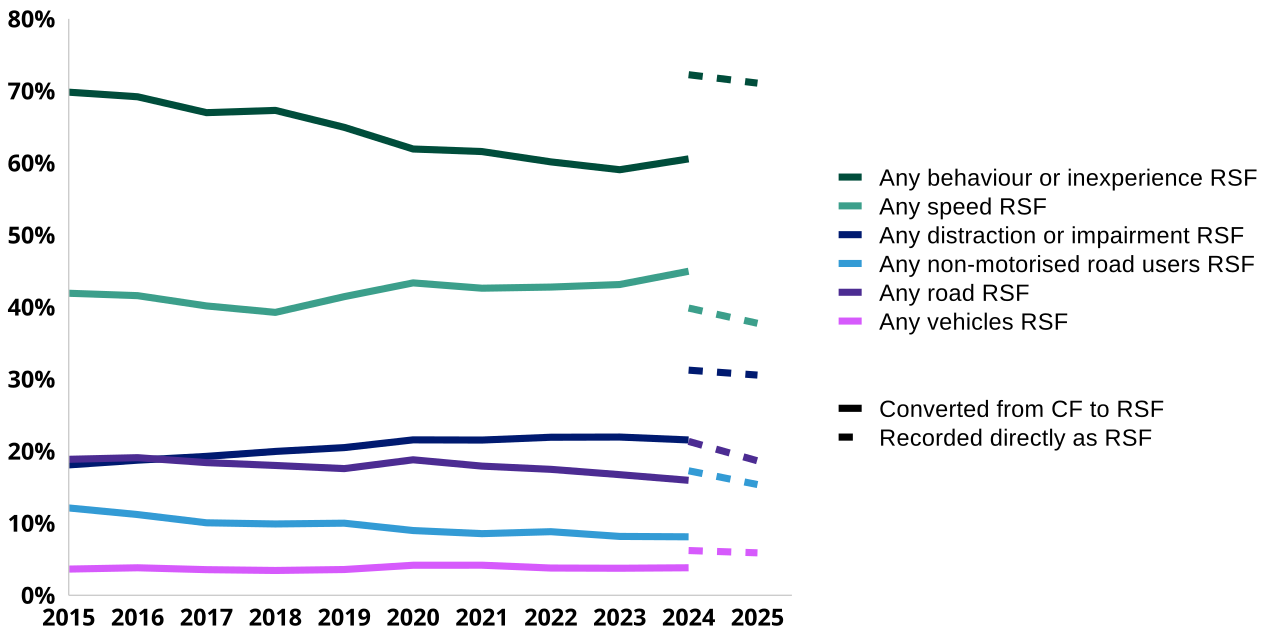
The behaviour or inexperience section has a substantially larger percentage of collisions when compared to the next 2 largest RSF sections. This has been the case over the last 10 years, even after allowing for the effects of the switch from CFs to RSFs. The trends from 2015 to 2025 of the proportions of FSCs for each RSF section can be seen in Chart 2.
Chart 2: Proportion of fatal or serious collisions with RSFs assigned, by RSF section, Great Britain, 2015 to 2025 RAS0701
3. Top 10 factors assigned
Table 1 shows the top 10 RSFs assigned to FSCs in 2025:
- Ineffective observation by either the driver or rider or pedestrian was the most assigned factor, assigned to 50% of FSCs, more than twice the proportion of the second most assigned factor
- Nearly all the top 10 RSFs assigned belong to the largest 3 RSF sections: behaviour or inexperience, speed, or distraction or impairment.
- Most of the top 10 RSFs assigned to fatal or serious collisions in 2025 were also in the top 10 in 2024 but aren’t all in the same order. Only the RSF “Driver or rider passing too close to another road user or pedestrian” was not in the top 10 RSFs assigned in 2024.
When comparing the top 10 RSFs for fatal collisions in 2025:
- Ineffective observation remains as the top assigned RSF
- Speed RSFs became more common with between 23% and 29% of fatal collisions being assigned one of the top 3 most common speed RSFs
- Affected by drugs and illness or disability are in the top 10 RSFs assigned to fatal collisions, but aren’t in the top 10 RSFs assigned to FSCs
Table 1: Top 10 RSFs assigned to fatal or serious collisions, 2025
| Road Safety Factor category | Road Safety Factor | Proportion of FSCs with factor assigned |
|---|---|---|
| Behaviour or inexperience | Ineffective observation by either the driver or rider or pedestrian | 50% |
| Behaviour or inexperience | Driver or rider overshot junction or poor turn or manoeuvre | 22% |
| Speed | Driver or rider travelling too fast for conditions (including loss of control or swerving) | 16% |
| Speed | Driver or rider exceeding speed limit | 16% |
| Speed | Driver or rider being aggressive or dangerous or reckless | 15% |
| Distraction or impairment | Distraction to driver or rider from inside or outside or on vehicle | 12% |
| Distraction or impairment | Affected by alcohol | 9% |
| Behaviour or inexperience | Driver or rider inexperienced or learner | 9% |
| Behaviour or inexperience | Driver or rider passing too close to another road user or pedestrian | 9% |
| Non-motorised road users | Pedestrian careless or in a hurry | 8% |
4. Behaviour and inexperience RSFs
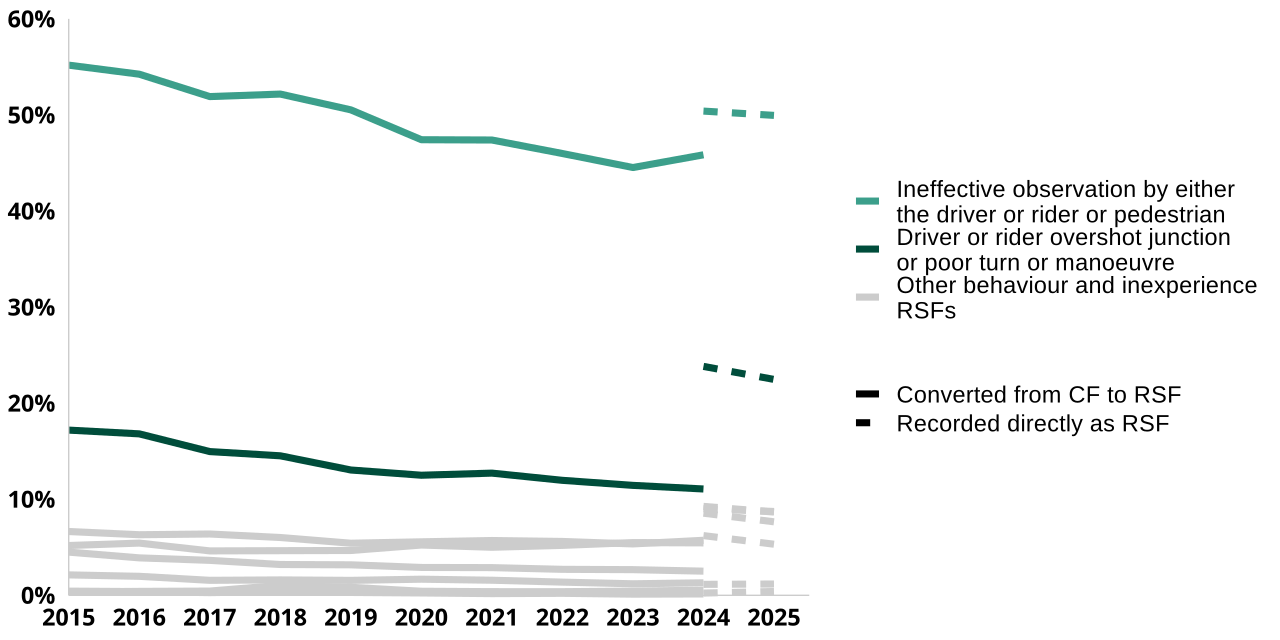
Chart 3 shows the proportion of FSCs assigned each RSF within the behaviour or inexperience section. In 2025:
- Ineffective observation by either the driver or rider, or pedestrian was the most assigned RSF with 50% of FSCs in Great Britain in 2025 having this RSF assigned; this RSF has been the most assigned behaviour or inexperience RSF over the past 10 years
- Driver or rider overshot junction or poor turn or manoeuvre was the second most assigned RSF under the behaviour and inexperience RSF section with 22% of FSCs in Great Britain in 2025 having this RSF assigned.
- However, this is not the case for FSCs on all road types. On motorways, the second most assigned RSF (within this section) for FSCs was sudden braking or braking in a way unsuitable for conditions, with 16% of FSCs on motorways being assigned this RSF.
Chart 3: Proportion of fatal or serious collisions with behaviour or inexperience RSFs assigned in Great Britain, 2015 to 2025 RAS0701
5. Speed RSFs
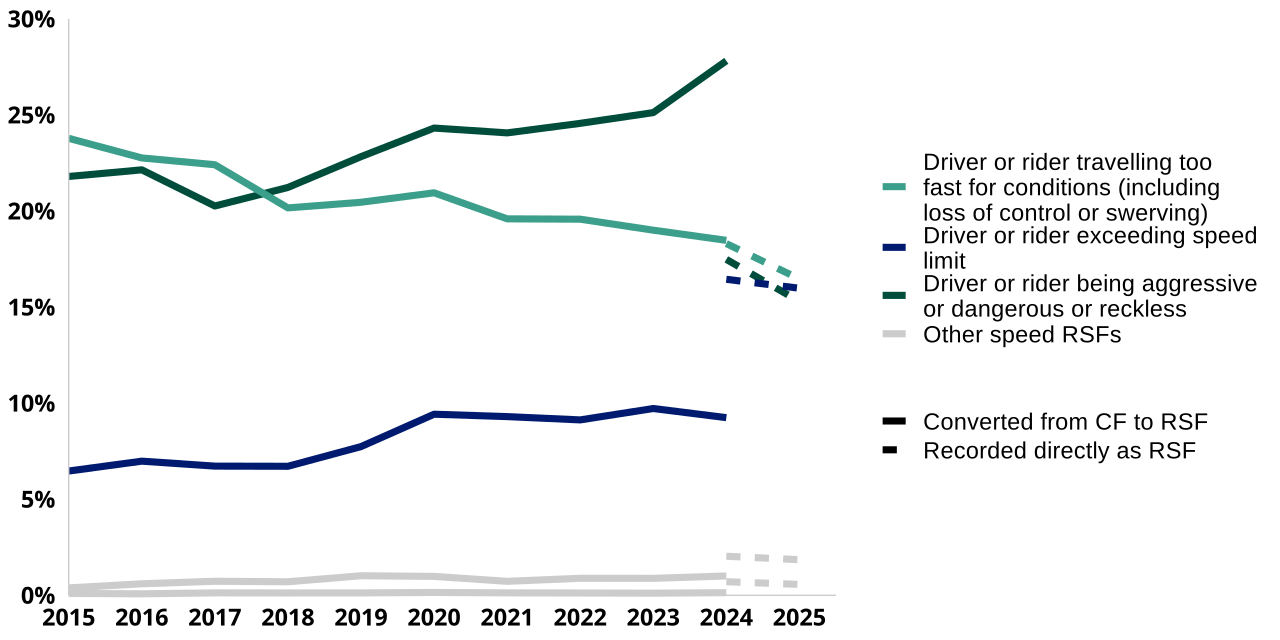
Chart 4 shows the proportion of FSCs assigned the different speed RSFs. The top 3 most assigned speed RSFs in 2025 for Great Britain were driver or rider:
- Travelling too fast for conditions (including loss of control or swerving), assigned to 16% of FSCs
- Exceeding the speed limit, assigned to 16% of FSCs
- Being aggressive or dangerous or reckless, assigned to 15% of FSCs
Car occupant and motorcycle user casualties were more likely to have these speed RSFs assigned than casualties of other road types with at least 20% of these casualties being assigned each of these RSFs.
Chart 4: Proportion of fatal or serious collisions speed RSFs assigned in Great Britain, 2015 to 2025 RAS0701
6. Distraction or impairment RSFs
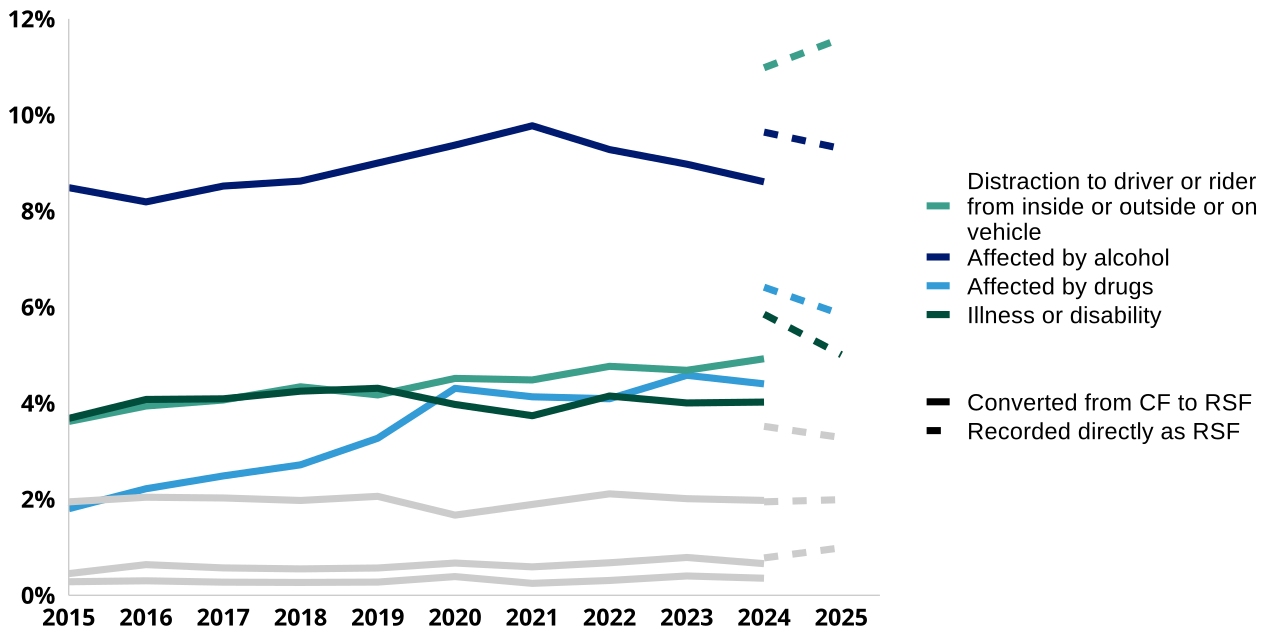
Chart 5 shows the proportion of FSCs assigned each RSF within the distraction or impairment section. In 2025:
- Distraction to driver or rider from inside or outside or on vehicle was the most assigned distraction or impairment RSF for FSCs followed by affected by alcohol (12% and 9% respectively).
- These 2 RSFs were also the most assigned distraction and impairment RSFs for FSCs in 2024.
- Whilst these 2 distraction or impairment RSFs were the most assigned to FSCs for most road types, the distraction to driver or rider RSF was more likely to be assigned to a motorway FSC with 18% of motorway FSCs being assigned this RSF.
- Driver or rider too tired to drive or ride safely was the second most assigned RSF (in this section) for motorway FSCs with 9% of these collisions being assigned this RSF.
Chart 5: Proportion of fatal or serious collisions with distraction or impairment RSFs assigned in Great Britain, 2015 to 2025 RAS0701
7. Further information
Further data and guidance related to road safety recording is available via:
-
Spreadsheet data tables, particularly section RAS07: factors contributing to collisions
8. About this data
Detailed information about the data used in this chapter, including its strengths and limitations, can be found in the guidance pages.
8.1 STATS19 data
The statistics in this publication are based on data collected through the STATS19 system, which records personal injury road collisions on public roads in Great Britain. STATS19 data are reported to the Department for Transport by police forces using a common national specification, allowing consistent analysis across time and geography. All collisions reported by the police within 30 days and that occurred on a public highway involving at least one motor vehicle, horse rider or pedal cyclist, and where at least one person was injured, are included in these statistics.
STATS19 is the primary source used to understand long-term trends in road collisions and casualties, and to monitor and evaluate road safety policies and interventions. Its standardised approach enables comparison at local, regional and national level, and provides a long-running time series underpinning road safety analysis.
There is no obligation for people to report all personal injury collisions to the police, and not all collisions are reported to the police, particularly those involving only slight injuries, meaning some types of incidents are under recorded. Therefore these figures do not represent the full range of collisions or casualties in Great Britain.
The quality and completeness of the data can also vary, especially for variables based on officer judgement at the scene. Changes to data collection systems, guidance or reporting practices over time may also affect comparability of trends. For example, recent updates to the STATS19 specification (including the introduction of new variables) may lead to discontinuities in some data series.
8.2 Injury severity reporting
The figures in this release for injured casualties are based on adjusting figures reported by the police to take account of changes in the reporting of injury severity by some police forces in recent years. These adjusted figures can reliably be used to compare trends over time across the country. More details can be found in our severity adjustments guidance.
8.3 Road safety factors and contributory factors
When police officers attend the scene of a collision, they can select up to 6 factors they believe contributed to the collision and assign them to vehicles, casualties or uninjured pedestrians involved. This is based on the police officer’s professional judgement and before a full investigation.
The number of RSFs recorded is impacted by the number of road casualty collisions which occur and the number of collisions in which a police officer has attended and records an RSF. To account for this, data has been presented as the percentage of collisions with an RSF assigned. Because a collision can be assigned multiple factors, the percentages presented may sum to more than 100%.
In 2025, 75% of eligible collisions had RSFs recorded rather than CFs. To avoid presenting misleading data, directly recorded and converted RSFs have been presented alongside each other with 2024 as the changeover year. Differences between the converted and directly recorded RSFs may reflect changes in data collection and recording practices, meaning comparisons between the two series should be interpreted with caution.
Further information about RSFs and CFs, including the impact of the change between the two reporting systems, is available in the RSF and CF guidance.
9. Instructions for printing and saving
Depending on which browser you use and the type of device you use (such as a mobile or laptop) these instructions may vary.
Tablets and mobile devices normally have the option to “find in text” and “print or save” in their sharing or quick options menu of their browser, but this will vary by device model.
10. How to search
Select Ctrl and F on a Windows laptop or Command and F on a Mac
This will open a search box in the top right-hand corner of the page. Type the word you are looking for in the search bar and press enter.
Your browser will highlight the word, usually in yellow, wherever it appears on the page. Press enter to move to the next place it appears.
11. Contact details
Road safety statistics
Email roadacc.stats@dft.gov.uk
To hear more about DfT statistical publications as they are released, follow us on X (formerly known as Twitter) at DfTstats.