RRCGB 2025: Geography and place
Published 30 July 2026

© Crown copyright 2026
This publication is licensed under the terms of the Open Government Licence v3.0 except where otherwise stated. To view this licence, visit nationalarchives.gov.uk/doc/open-government-licence/version/3 or write to the Information Policy Team, The National Archives, Kew, London TW9 4DU, or email: psi@nationalarchives.gov.uk.
Where we have identified any third party copyright information you will need to obtain permission from the copyright holders concerned.
This publication is available at https://www.gov.uk/government/statistics/reported-road-casualties-great-britain-final-results-2025/rrcgb-2025-geography-and-place
About this chapter
This chapter shows a breakdown of casualties in reported road collisions in Great Britain and the United Kingdom by country, region, police force, and local authority, and presents these in the context of the road safety performance of other nations.
1. Main findings
Based on data on road collisions reported to the police up to 2025:
- In 2025, the UK recorded 23.3 road fatalities per million population, placing it among the countries with the lowest road death rates internationally. However, the UK’s recent progress in reducing road deaths has been slower than in several comparable countries.
- Killed or seriously injured (KSI) casualty rates have fallen across all regions of Great Britain since 2004. However, the pace of improvement has slowed in recent years, with KSI rates remaining broadly stable since the mid 2010s in many parts of the country.
- Road casualties are concentrated in areas with the highest population densities and traffic volumes. In 2025, KSIs were predominantly located in major urban areas, and along the busiest transport corridors.
- There is variation in casualty rates between countries and regions of Great Britain. While long term trends have generally improved everywhere, some areas have shown greater reductions in KSIs than others.
- Most local authority areas have seen a reduction in KSIs since 2004. However, the scale of improvement varies considerably between authorities, and a small number have experienced increases over the same period.
Further breakdowns by country, region, police force area and local authority are provided in the sections below and in the accompanying data tables and interactive mapping tools.
2. International comparisons
Comparisons between countries are only possible for fatalities per million population, as casualties and traffic data are collected less consistently across different countries. Table RAS0404 compares figures for Great Britain, Northern Ireland, and the United Kingdom as a whole with others in Europe and, where data is available, the rest of the world.
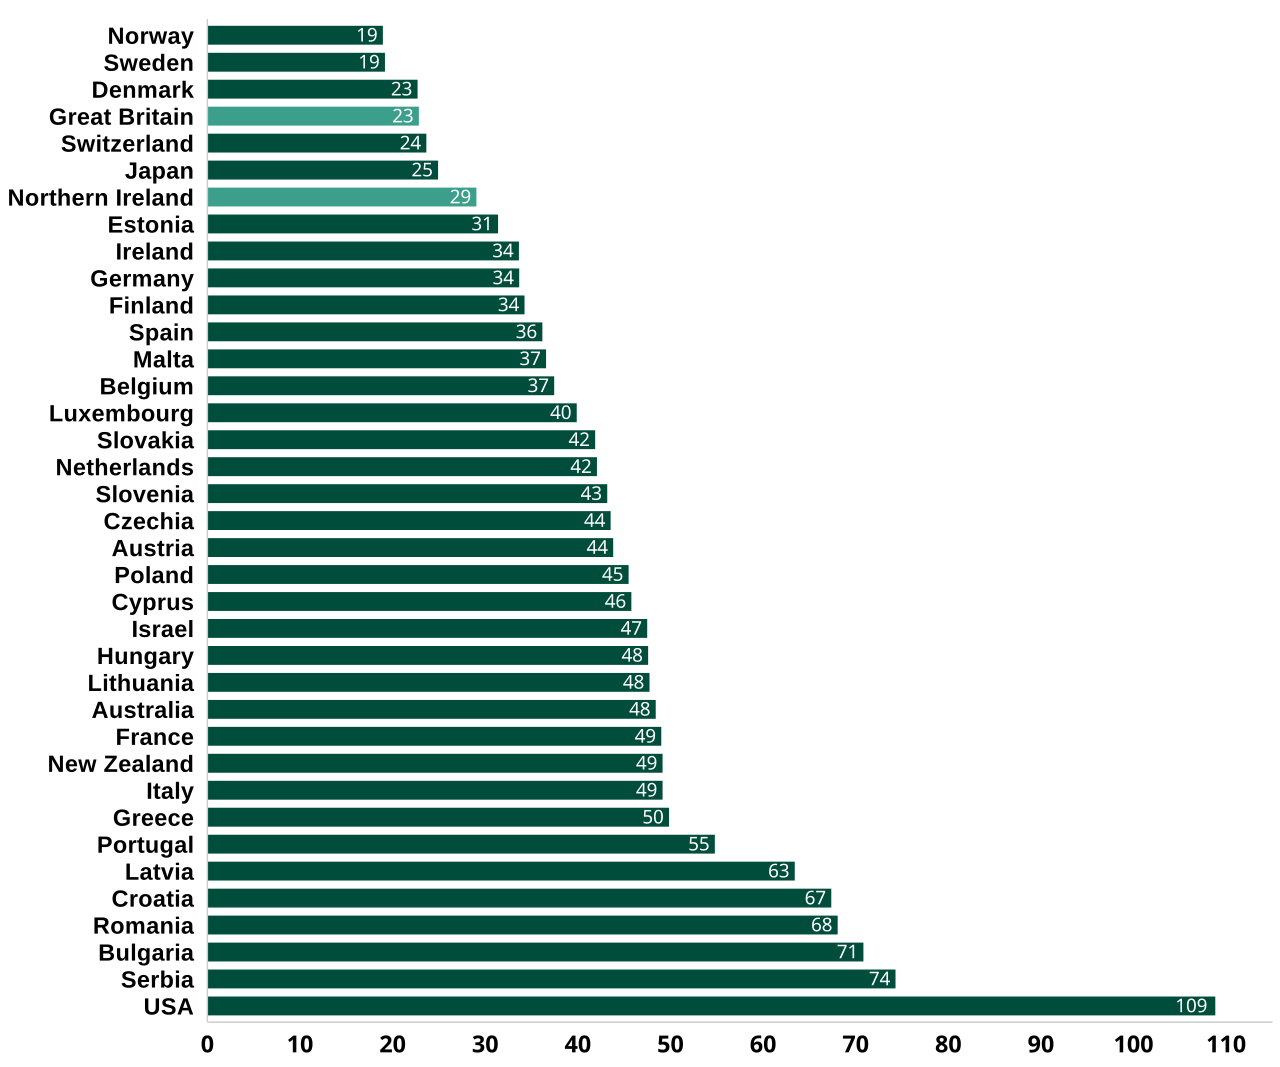
Chart 1 presents an international comparison of road fatalities per million population. The rate of road fatalities per million population for the UK is among the lowest in the world. In 2025, Great Britain ranked 4 out of 38 countries with available data for lowest number of road fatalities per million population. Northern Ireland ranked 8 out of 38 in 2025.
Chart 1: Road fatalities per million population by country, 2025 RAS0404
UK roads are some of the safest in the world and have remained so for a number of years. However, over the last 10 years the UK has made less progress in reducing the number of road deaths than other nations.
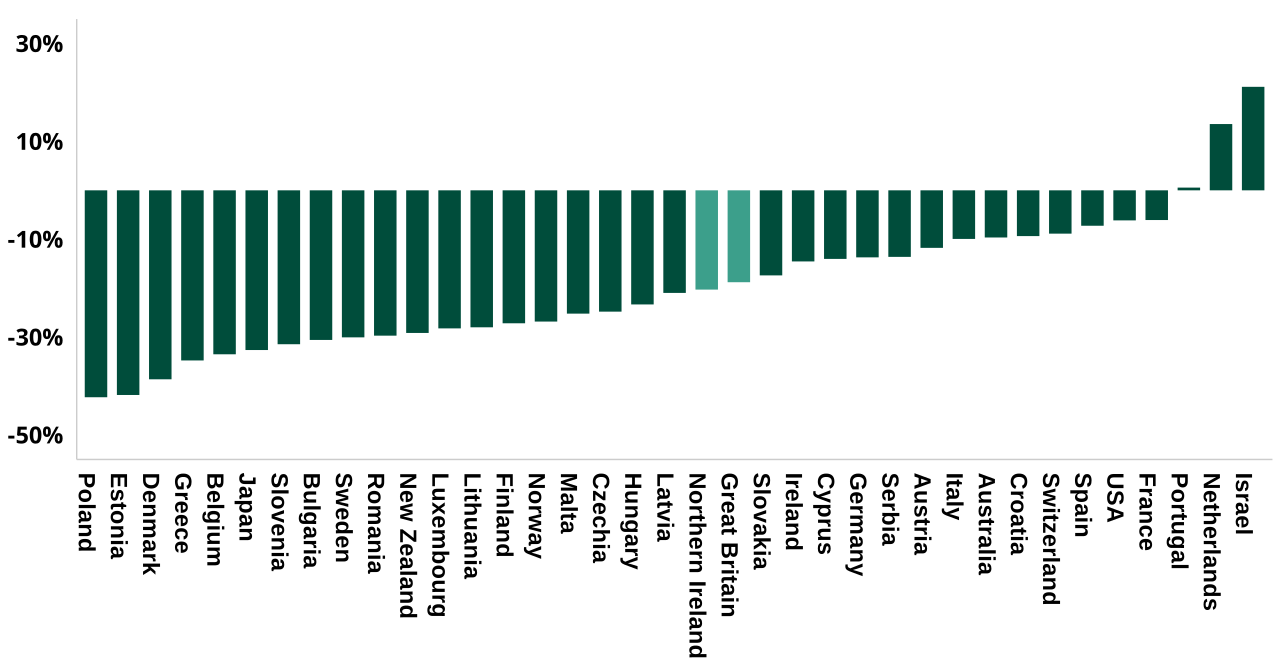
Chart 2 shows the percentage change in the rate of fatalities per million population over the last 10 years for selected nations.
This shows that progress for the UK in reducing road deaths has lagged behind many other countries. Some of the countries (for example Estonia, Poland, and Greece) with greater reductions had notably higher fatality rates than the UK in 2016. However, even when comparing the UK to other nations that had a similar safety record in 2016 (for example Norway, Sweden, Denmark, and Japan) the UK has made notably less progress over the last decade.
Chart 2: Percentage change in road fatalities per million population from 2016 to 2025 by country
Further information about comparisons in road safety progress between countries is available in the European Transport Safety Council’s Performance Index (PIN) for European countries. Once data is available worldwide for 2025 it will be published by the International Traffic Safety Data and Analysis Group (IRTAD); 2024 figures are available in the IRTAD annual report.
3. UK safety performance
KSI figures for Great Britain are adjusted for the changes in reported severity that have occurred as a result of the move to injury-based reporting in most police force areas. No such adjustment exists for Northern Ireland therefore the figures presented are for KSIs as reported by police using the non-injury based method.
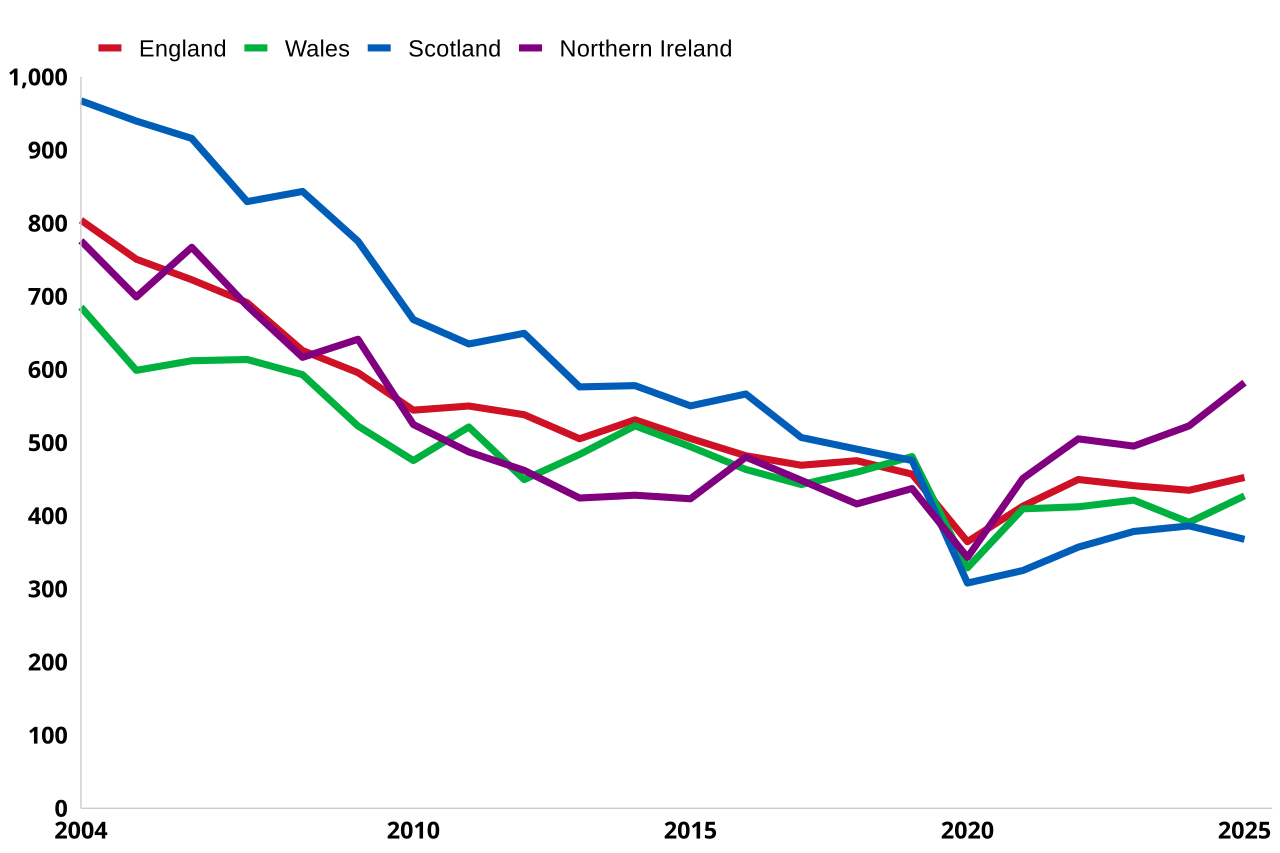
Chart 3 compares KSI rates per million population across the 4 UK nations. Before the COVID-19-related dip in 2020, rates had fallen steadily in all 4 nations, with the sharpest decline in Scotland, which had the highest rate in 2004. By 2019, all 4 nations had similar KSI rates, between 435 and 485 KSIs per million population.
Since 2021, trends have diverged. England and Wales have remained broadly flat at pre-pandemic levels, while Scotland has also been flat but below its pre-2019 level. Northern Ireland has seen a marked rise, from 451 KSIs per million in 2021 to 582 in 2025, now the highest rate in the UK.
Chart 3: Rate of KSIs per million population for the 5 nations of the United Kingdom, 2004 to 2025 RAS0402
Further details on casualties across the UK can be found in the reports from:
4. GB KSI locations
This section only considers collisions in Great Britain as exact collision location is not included in our data for Northern Ireland. Please see the PSNI website for record level NI data.
Chart 4 shows where KSIs predominantly occurred in Great Britain in 2025. The distribution broadly reflects the location of major urban settlements, particularly London, where population density and traffic volumes are highest.
Rural areas, particularly mid-Wales and the Scottish Highlands, have much lower KSI densities. These areas are more sparsely populated, have fewer roads, and account for a relatively small proportion of GB vehicle traffic. The location of casualties in Great Britain can be explored further using our interactive mapping dashboard.
Chart 4: Map of KSI locations across Great Britain, 2025

5. GB KSIs by country and region
The following section contains a summary of the number of KSIs in Scotland, Wales, and each of the regions of England. Chart 5 shows the number of KSIs in each of these areas in 2025. The number of KSIs was highest in London and the South East and lowest in the North East.
Chart 5: Number of KSIs and rate of KSIs per billion vehicle miles by region and country, Great Britain 2025 RAS0402
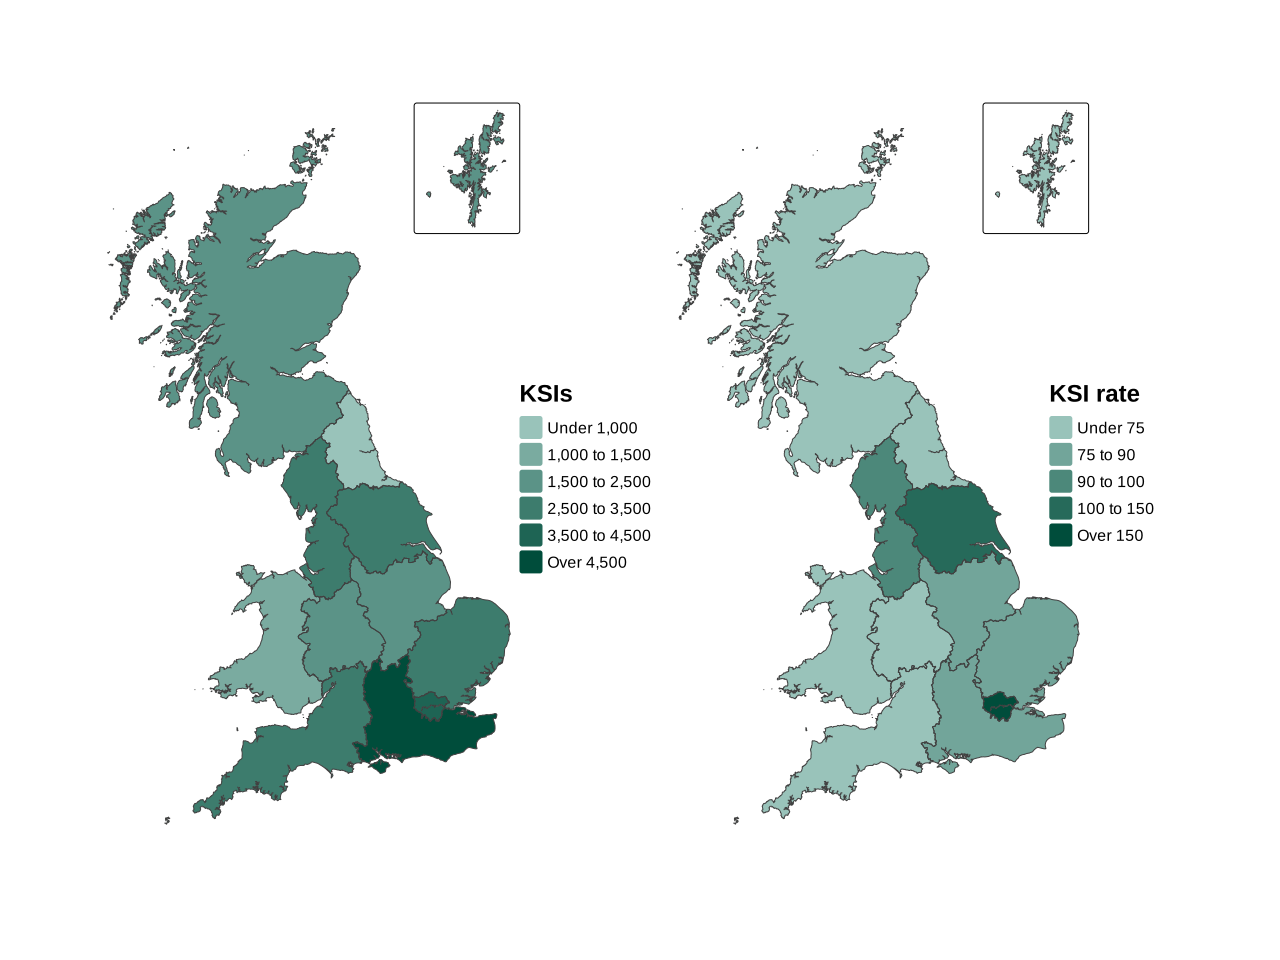
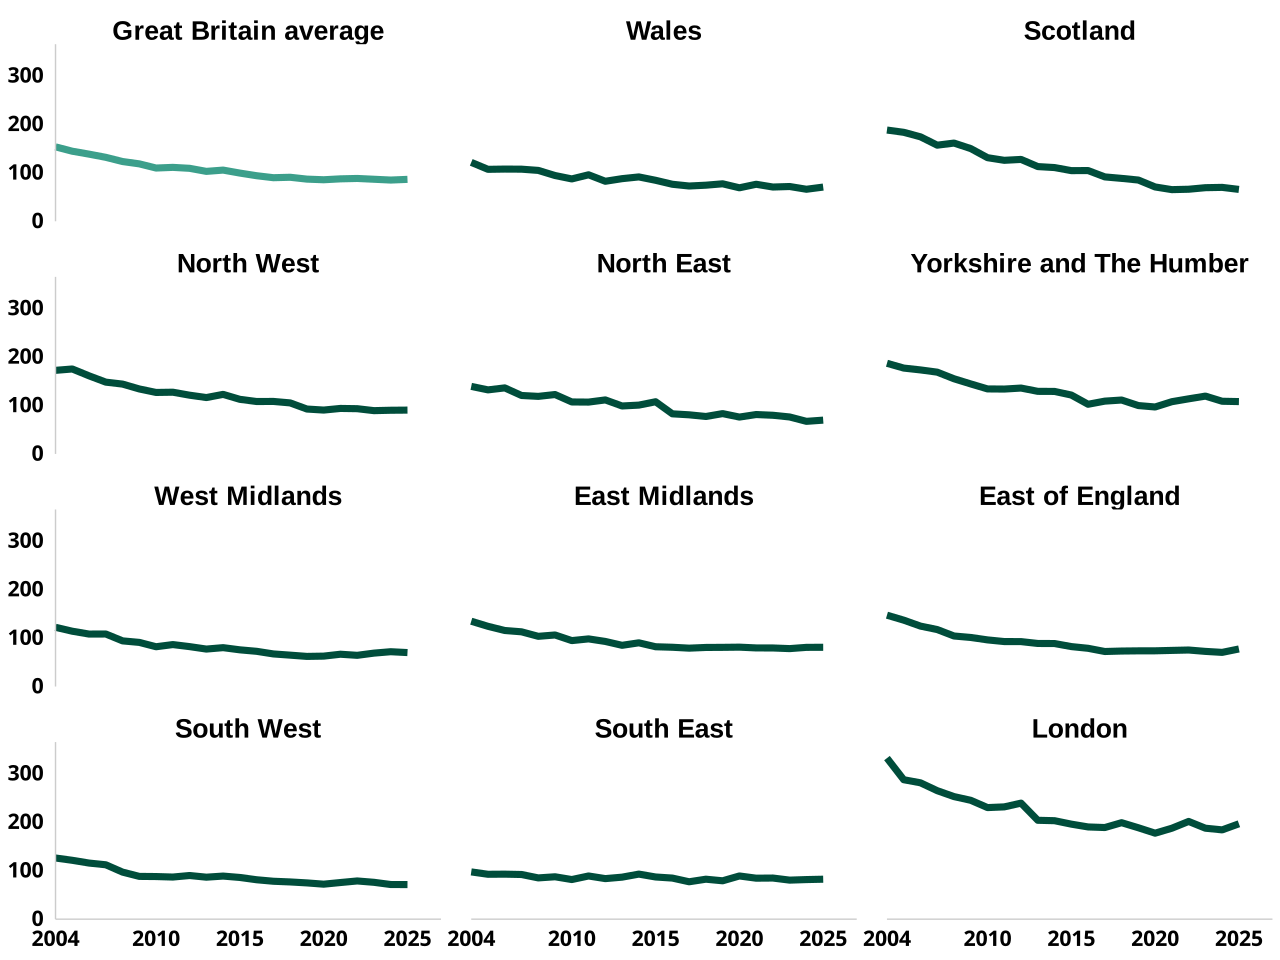
Chart 6 shows the variation in the KSI rates per billion vehicle miles travelled for all countries and regions in GB from 2004 to 2025. This shows that:
-
All regions have seen a decline in the KSI rate since 2004 with a flattening a flattening of this trend in the last 10 years, reflecting the overall GB trend.
-
Scotland has seen a notably steeper decline in their KSI rate than other areas, while the South East has only seen a slight decline.
-
In general, the steepest declines have been observed in the areas with the highest KSI rates in 2004.
Chart 6: Rate of KSIs per billion vehicle miles by region and country, Great Britain 2004 to 2025 RAS0402
6. KSIs by police force areas
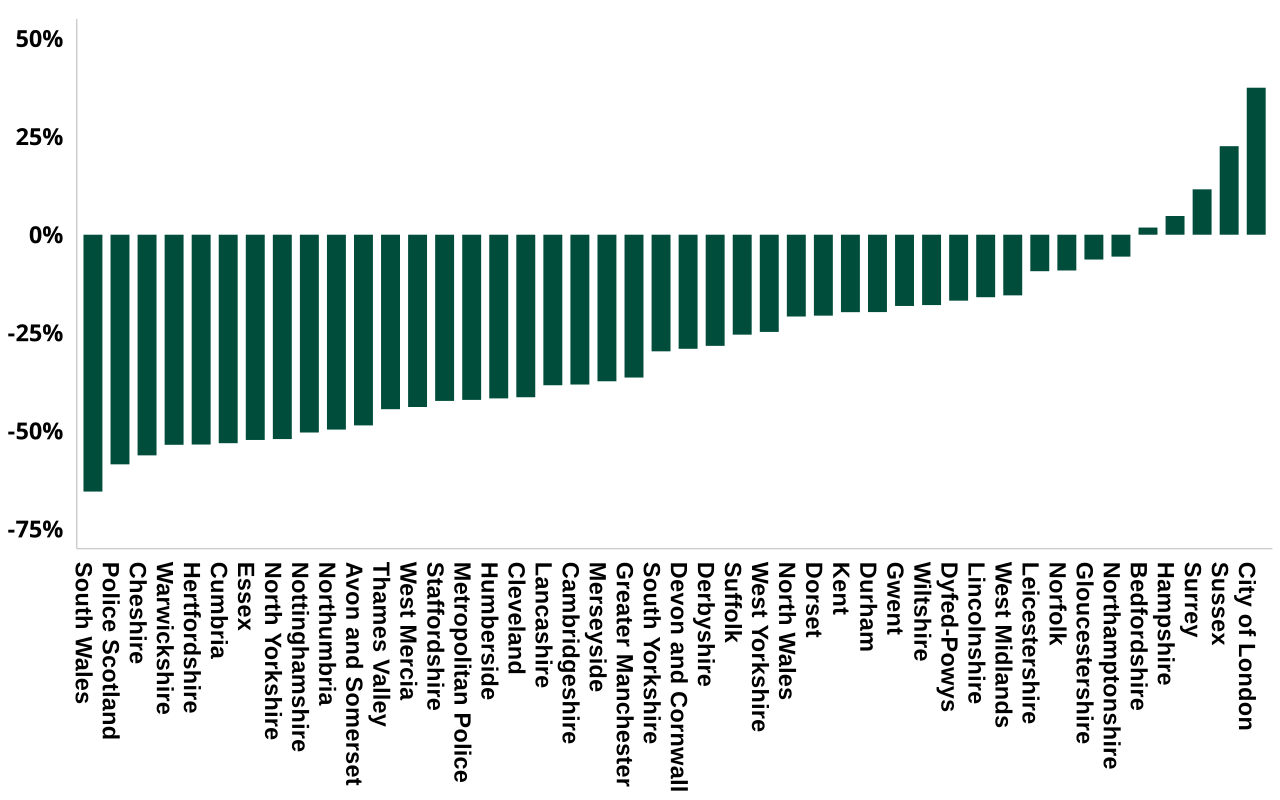
Data on the number of casualties is provided by police forces. Chart 7 shows the percentage change in the number of KSIs for each force from 2004 to 2025. By police force:
-
Higher KSI figures generally found for the larger forces, and forces containing large urban areas.
-
The majority of forces have seen a decline in the number of KSIs since 2004.
-
There is substantial variation in the magnitude of this change, with some forces seeing large declines of over 50%, while a small number of forces have seen an increase in the number of KSIs over the last 20 years.
Chart 7: Percentage change in the number of KSIs by police force, Great Britain 2004 to 2025 RAS0401
Further details on the number of casualties and collisions by police force can be found in RAS0401 and explored using our interactive data tools.
7. KSIs by local authority
Figures in this section are based on the latest local authority boundaries and are based on the local authority that the collision occurred within. There are a small number of collisions each year that do not have accurate point locations which are excluded from this analysis.
Chart 8 shows the number of KSIs by local authority area in GB in 2025, and rate of KSIs per billion vehicle miles travelled. This shows that there is substantial variation in the number and rate of KSIs by local authority. As in previous sections the areas with the highest number of KSIs are those areas with the largest populations and with major high-traffic roads travelling through them.
Chart 8: Number of KSIs and rate of KSIs per billion vehicle miles by local authority, Great Britain 2025 RAS0403
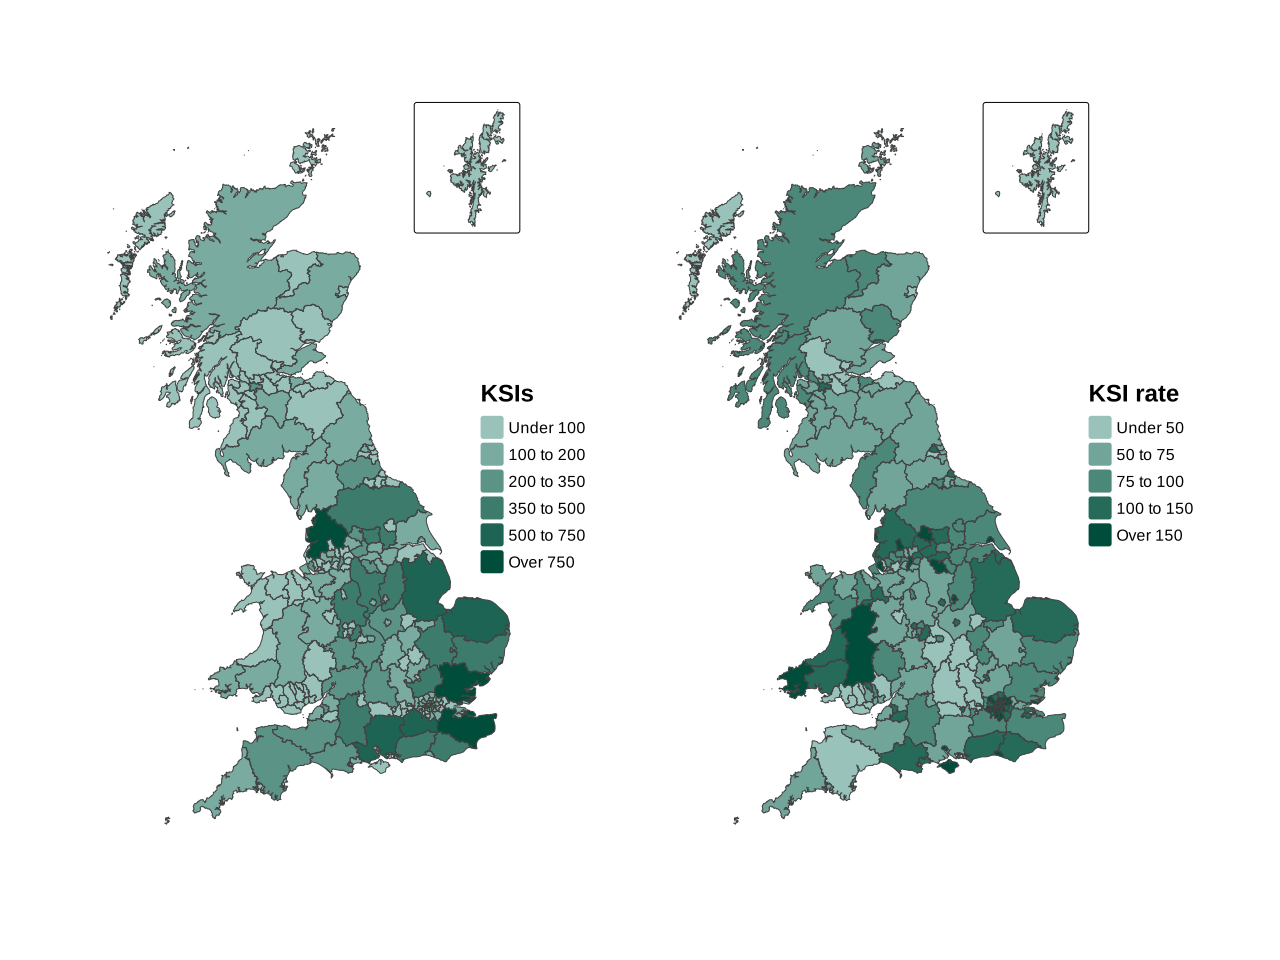
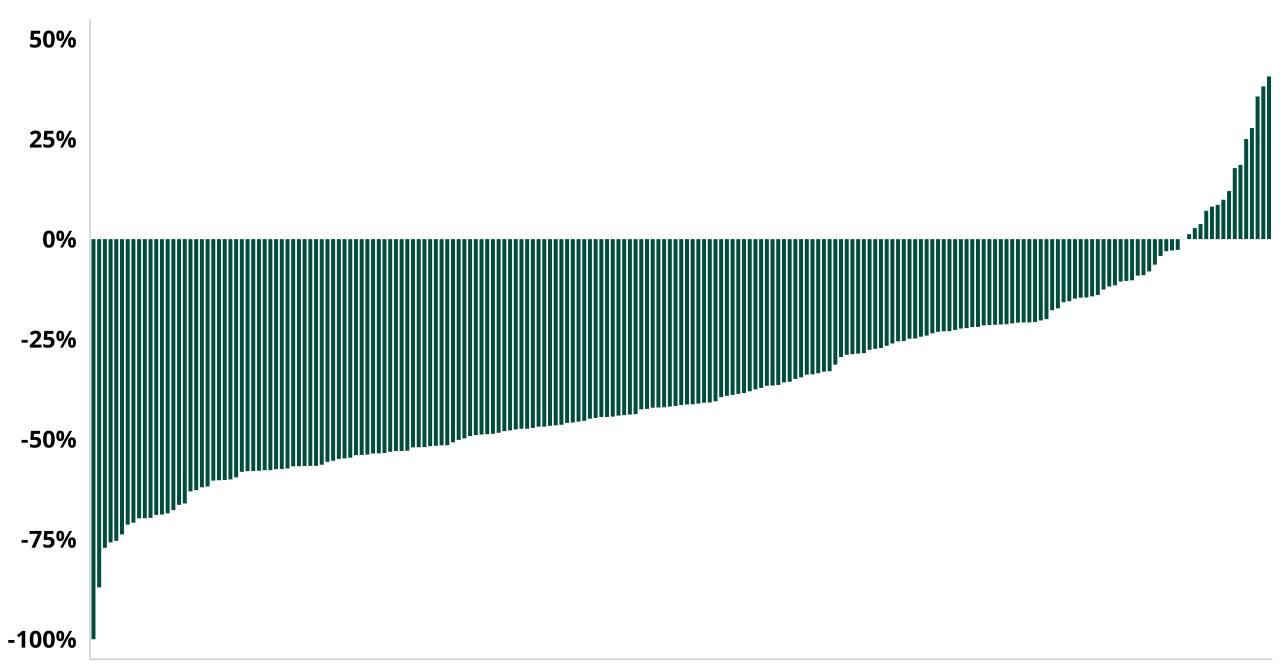
Chart 9 shows the change in the number of KSIs in each local authority from 2004 to 2025. There is notable variation between local authorities in the level of change seen in the number of KSIs since 2004. For the vast majority of local authorities, the number of KSIs has declined since 2004. The majority of those where the KSIs have increased are smaller areas with a low number of KSIs that are subject to notable annual variation
Chart 9: Percentage change in the number of KSIs by local authority, Great Britain 2004 to 2025
8. Further information
Further data and statistics covering the location of collisions and regional variations in trends is available via:
-
Spreadsheet data tables, particularly section RAS04: Geographical breakdowns
9. About this data
Detailed information about the data used in this chapter, including its strengths and limitations, can be found in the guidance pages.
9.1 STATS19 data
The statistics in this publication are based on data collected through the STATS19 system, which records personal injury road collisions on public roads in Great Britain. STATS19 data are reported to the Department for Transport by police forces using a common national specification, allowing consistent analysis across time and geography. All collisions reported by the police within 30 days and that occurred on a public highway involving at least one motor vehicle, horse rider or pedal cyclist, and where at least one person was injured, are included in these statistics.
STATS19 is the primary source used to understand long-term trends in road collisions and casualties, and to monitor and evaluate road safety policies and interventions. Its standardised approach enables comparison at local, regional and national level, and provides a long-running time series underpinning road safety analysis.
There is no obligation for people to report all personal injury collisions to the police, and not all collisions are reported to the police, particularly those involving only slight injuries, meaning some types of incidents are under recorded. Therefore these figures do not represent the full range of collisions or casualties in Great Britain.
The quality and completeness of the data can also vary, especially for variables based on officer judgement at the scene. Changes to data collection systems, guidance or reporting practices over time may also affect comparability of trends. For example, recent updates to the STATS19 specification (including the introduction of new variables) may lead to discontinuities in some data series.
9.2 Injury severity reporting
The figures in this release for injured casualties are based on adjusting figures reported by the police to take account of changes in the reporting of injury severity by some police forces in recent years. These adjusted figures can reliably be used to compare trends over time across the country. More details can be found in our severity adjustments guidance.
10. Instructions for printing and saving
Depending on which browser you use and the type of device you use (such as a mobile or laptop) these instructions may vary.
Tablets and mobile devices normally have the option to “find in text” and “print or save” in their sharing or quick options menu of their browser, but this will vary by device model.
11. How to search
Select Ctrl and F on a Windows laptop or Command and F on a Mac
This will open a search box in the top right-hand corner of the page. Type the word you are looking for in the search bar and press enter.
Your browser will highlight the word, usually in yellow, wherever it appears on the page. Press enter to move to the next place it appears.
12. Contact details
Road safety statistics
Email roadacc.stats@dft.gov.uk
To hear more about DfT statistical publications as they are released, follow us on X (formerly known as Twitter) at DfTstats.