RRCGB 2025: Casualty demographics
Published 30 July 2026

© Crown copyright 2026
This publication is licensed under the terms of the Open Government Licence v3.0 except where otherwise stated. To view this licence, visit nationalarchives.gov.uk/doc/open-government-licence/version/3 or write to the Information Policy Team, The National Archives, Kew, London TW9 4DU, or email: psi@nationalarchives.gov.uk.
Where we have identified any third party copyright information you will need to obtain permission from the copyright holders concerned.
This publication is available at https://www.gov.uk/government/statistics/reported-road-casualties-great-britain-final-results-2025/rrcgb-2025-casualty-demographics
About this chapter
This chapter explores how reported road casualties in Great Britain vary by age, sex and road user type. It looks at the demographic profile of casualties in 2025, how this has changed over time, and which groups have the highest casualty rates or are more likely to be killed or seriously injured once involved in a reported collision.
1. Main findings
Based on data on road collisions reported to the police up to 2025:
-
Males accounted for the majority of casualties across all severities, making up 77% of fatalities, 68% of KSIs and 61% of casualties overall
-
People aged 17 to 49 accounted for the largest share of KSI casualties, representing over half of all KSIs in 2025. However, their share has fallen over time as casualty numbers have declined more rapidly among younger age groups than older groups.
-
The age profile of road casualties has shifted towards older age groups since 2004. People aged 50 and over accounted for a larger share of fatalities and KSI casualties in 2025 than in 2004.
-
Older people were more likely to be killed or seriously injured after becoming a casualty in a road collision. In 2025, people aged 70 and over had the highest proportion of overall casualties that were classified as KSI.
-
The types of road user injured varies by age group. Pedestrians accounted for the largest share of KSI casualties among those aged 0 to 16, motorcycle occupants and car drivers among young adults aged 17 to 29, and car drivers and pedestrians among those aged 70 and over.
-
When distance travelled is taken into account, casualty risk was highest for younger adults and older pedestrians. Car driver and car passenger KSI rates were highest among people aged 17 to 29, while pedestrian KSI rates were highest among people aged 70 and over.
Further breakdowns and analysis are available in the sections below and in the accompanying data tables and factsheets.
2. Casualties by age and sex
2.1 Sex
Chart 1 shows the breakdown of reported road casualties by sex in Great Britain in 2025:
-
Males accounted for the majority of casualties across all severities, making up 77% of fatalities, 68% of KSIs and 61% of all casualties - the male share increases with casualty severity.
-
This pattern has been broadly consistent since 2004. The male share of all casualties rose slightly, from 58% in 2004 to 61% in 2025. For male KSIs, it remained broadly stable, averaging 69% between 2004 and 2025. By contrast, the male share of fatalities showed more year-to-year variation, ranging from 74% to 78% over the period.
Chart 1: Proportion of reported road casualties by severity and sex[footnote 1], Great Britain, 2025 RAS0202

2.2 Age
Chart 2 shows the breakdown of reported road casualties of different severities by age group, for Great Britain in 2025:
-
Overall casualties and KSI casualties were highest among people aged 17 to 49, accounting for 55% of KSI casualties and 60% of all casualties.
-
People aged 30 to 49 accounted for the largest share of KSI and overall casualties, at 28% and 32% respectively.
-
Children aged 0 to 16 accounted for 11% of all casualties and 10% of KSI casualties, but a much smaller share of fatalities, at 4%.
-
People aged 70 and over accounted for 24% of fatalities, compared with 12% of KSIs and 8% of all casualties.
Chart 2: Proportion of reported road casualties by age group[footnote 2] and severity, Great Britain, 2025 RAS0202
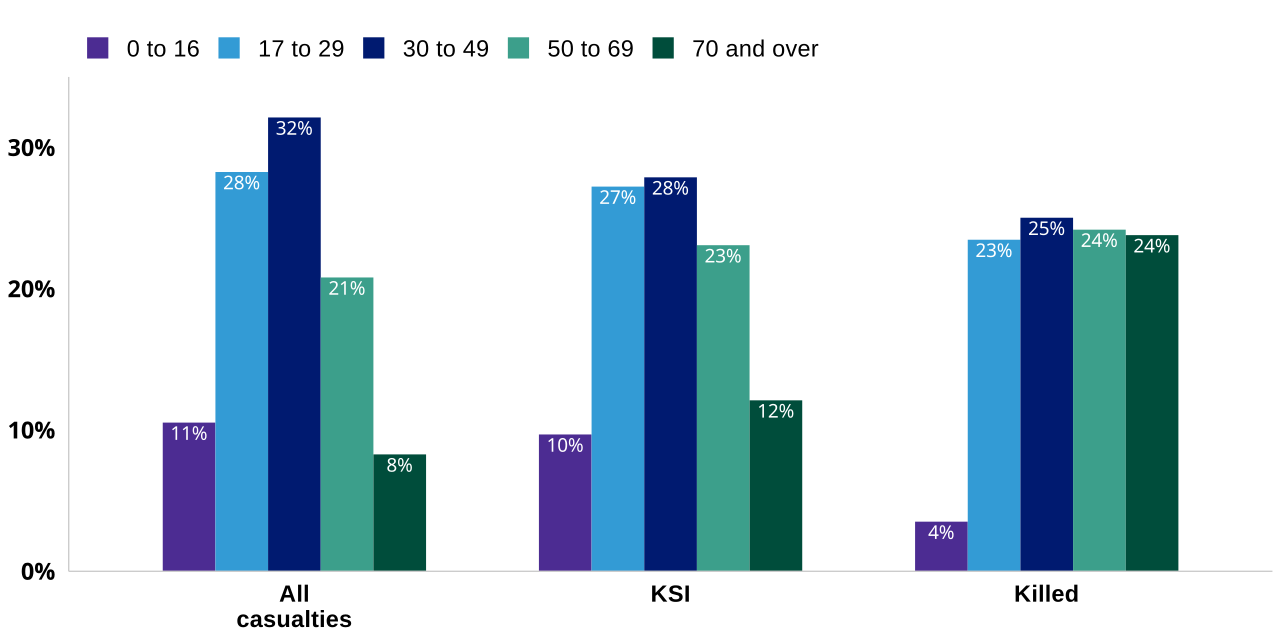
Chart 3 shows the number and proportion of reported road fatalities by age group between 2004 and 2025. Fatalities among those aged 17 to 49 have fallen substantially over the period, while declines have been less pronounced among older age groups. This means that people aged 50 and over accounted for a larger proportion of fatalities in 2025 than in 2004.
Chart 3: Number and proportion of reported road fatalities by age group, Great Britain, 2004 to 2025 RAS0202
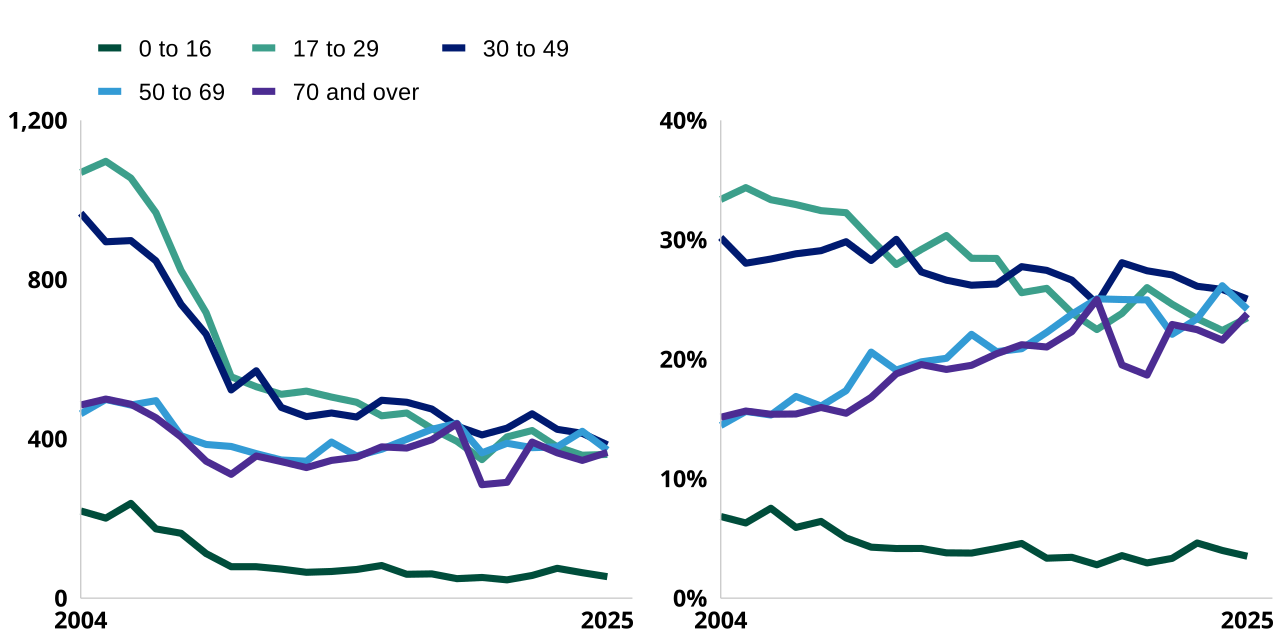
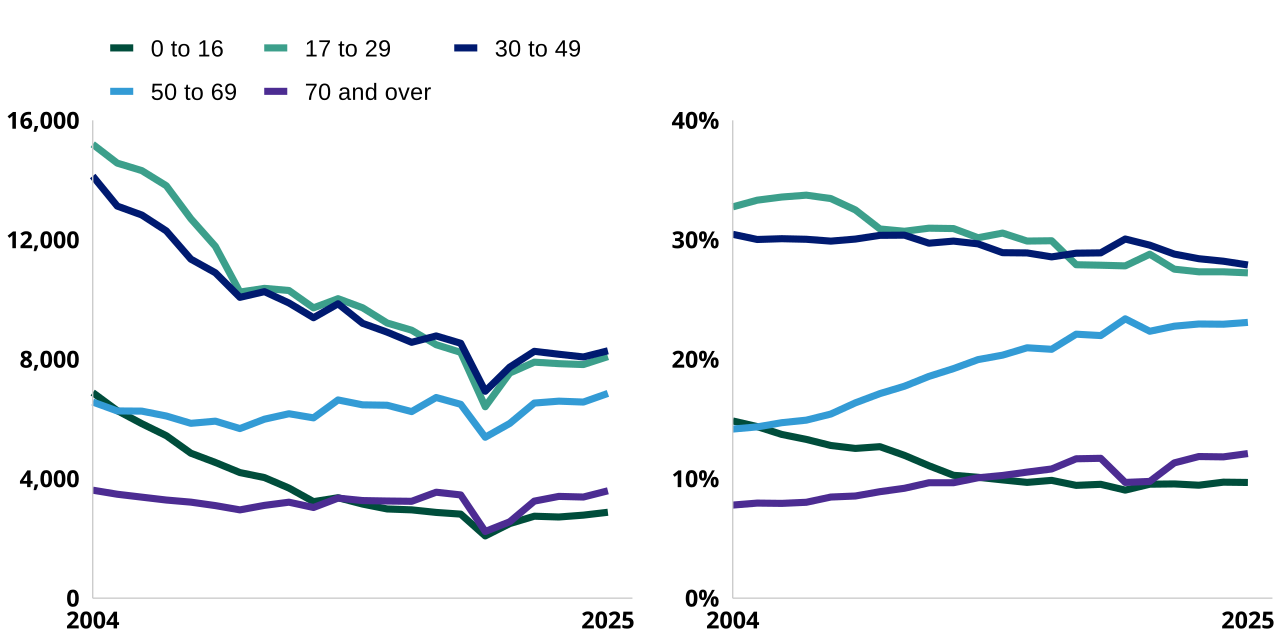
Chart 4 shows the number and proportion of killed or seriously injured (KSI) casualties by age group between 2004 and 2025:
-
Similar to the trend observed for fatalities, KSI casualties among those aged under 50 have fallen substantially over the period, particularly among those aged 17 to 49.
-
As a result, although these ages continued to account for the largest proportion of KSI casualties, the proportion aged 17 to 49 decreased, while the proportion aged 50 and over increased.
-
The share of KSI casualties aged 0 to 16 also declined, from 15% to 10% over the same period.
Chart 4: Number and proportion of KSI casualties by age group[footnote 2], Great Britain, 2004 to 2025 RAS0202
2.3 Age and sex
Chart 5 shows the number of KSI by sex and age group in Great Britain between 2004 and 2025.
In 2025, males accounted for the majority of KSI casualties across most age groups. The male KSI share was highest among those aged 17 to 49, and lowest among those aged 70 and over, where the split between males and females was much more even.
Since 2004:
-
KSIs have fallen substantially among younger age groups for both males and females, with the largest percentage reduction among children aged 0 to 16.
-
Younger adults have consistently had the highest male share of KSI casualties, with males making up around three-quarters of KSIs among those aged 17 to 29 in 2025.
-
Trends were more mixed among those aged 30 to 69: male KSI casualties fell for those aged 30 to 49 but increased for those aged 50 to 69, while female KSI casualties aged 30 to 49 have increased in recent years.
-
Among those aged 70 and over, the sex split remained much more even than in younger age groups.
Chart 5: Number of reported KSI casualties by sex and age group[footnote 2], Great Britain, 2004 to 2025 RAS0202
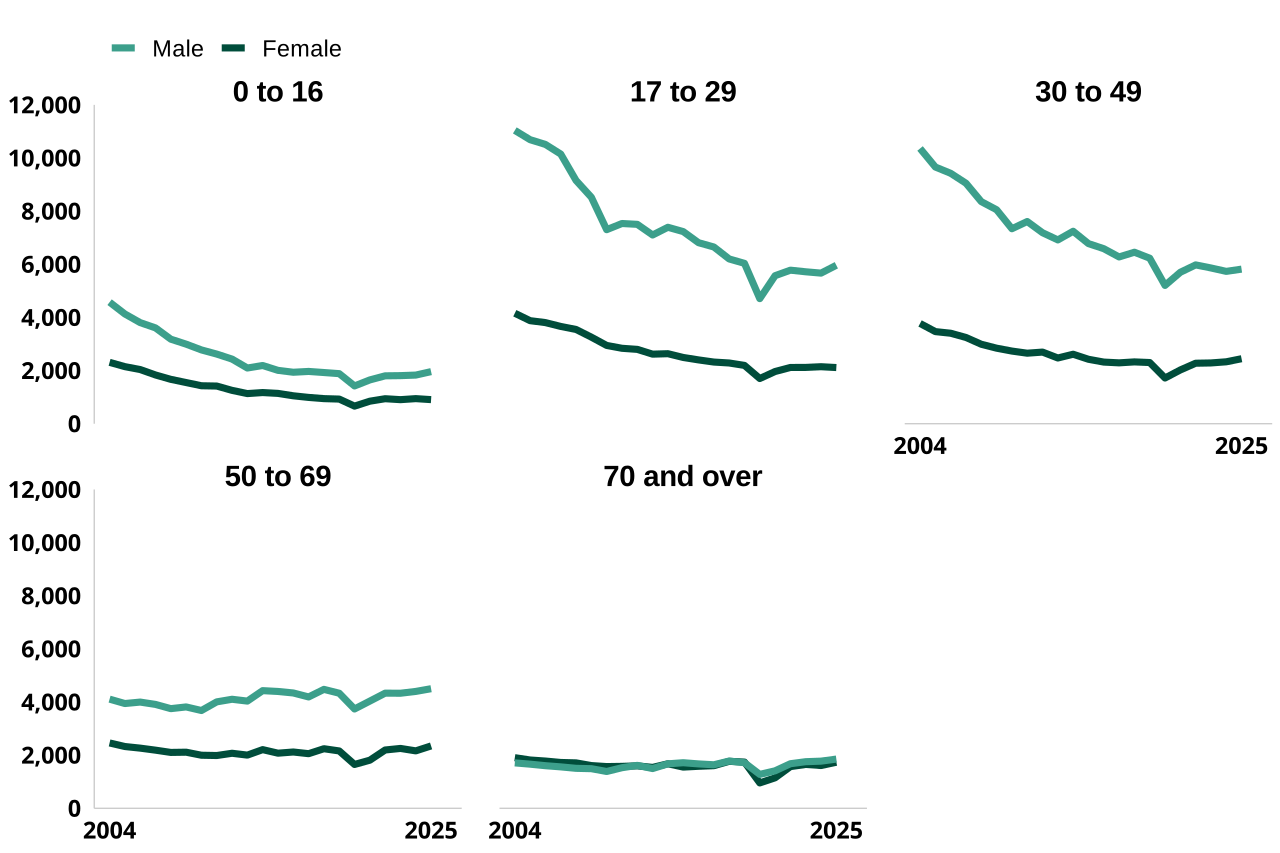
Table 1: Change in reported KSI casualties by sex and age group, 2004 to 2025, and share of male KSI, Great Britain, 2025 RAS0202
| Age group | Change in male KSIs since 2004 | Change in female KSIs since 2004 | Male share of KSI in 2025 |
|---|---|---|---|
| 0 to 16 | -57% | -61% | 68% |
| 17 to 29 | -46% | -49% | 74% |
| 30 to 49 | -44% | -35% | 70% |
| 50 to 69 | 10% | -5% | 66% |
| 70 and over | 8% | -9% | 52% |
| All ages | -38% | -36% | 68% |
2.4 Proportion of injured casualties KSI by age
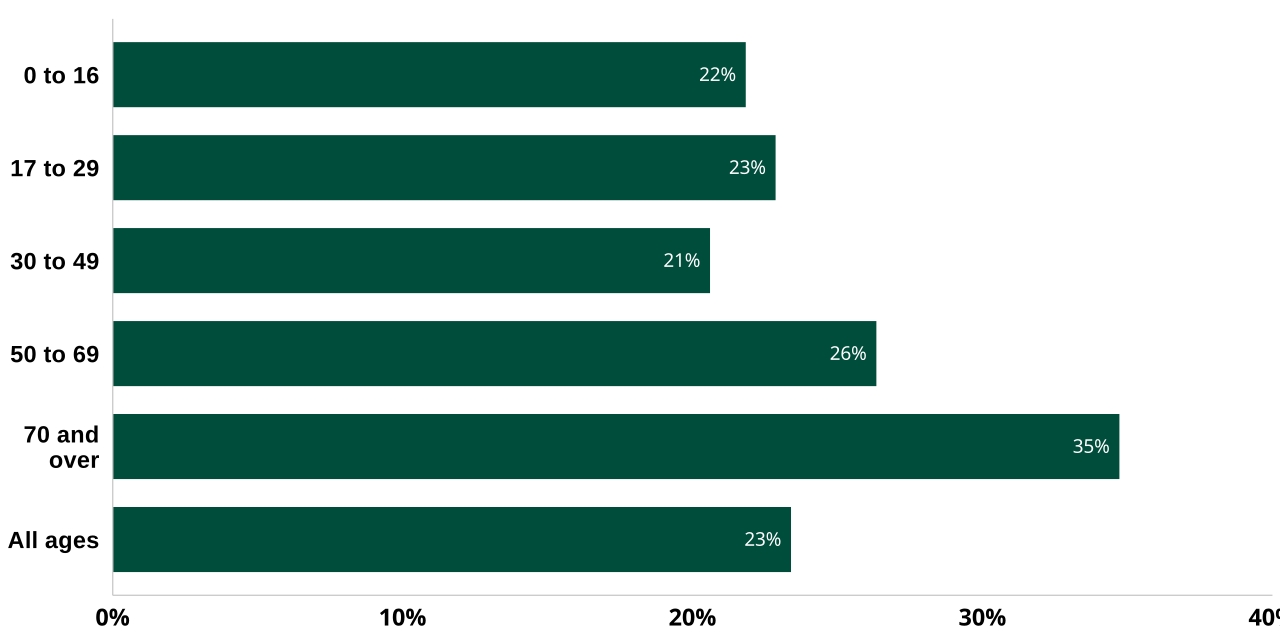
Chart 6 shows KSI casualties as a proportion of all age group casualties in 2025. This gives an indication of casualty severity once someone is injured in a collision:
-
People aged 70 and over were the most likely to be killed or seriously injured when a casualty in a road traffic collision.
-
The KSI proportion increased with age, rising from just over one in five casualties among children and younger adults to just over one in three among those aged 70 and over.
-
This means KSI casualties over 70 made up a larger share of all casualties compared to other age groups, highlighting their greater vulnerability in collisions.
Chart 6: KSI casualties as a percentage of all casualties by age group, 2025 RAS0202
2.5 Child casualties
Reducing the number of children KSI in road collisions is a key objective of the road safety strategy. In this subsection, children refers to those aged 0 to 15 years, rather than the 0 to 16 age range used elsewhere in this chapter. This is the standard definition of children within road casualty statistics historically.
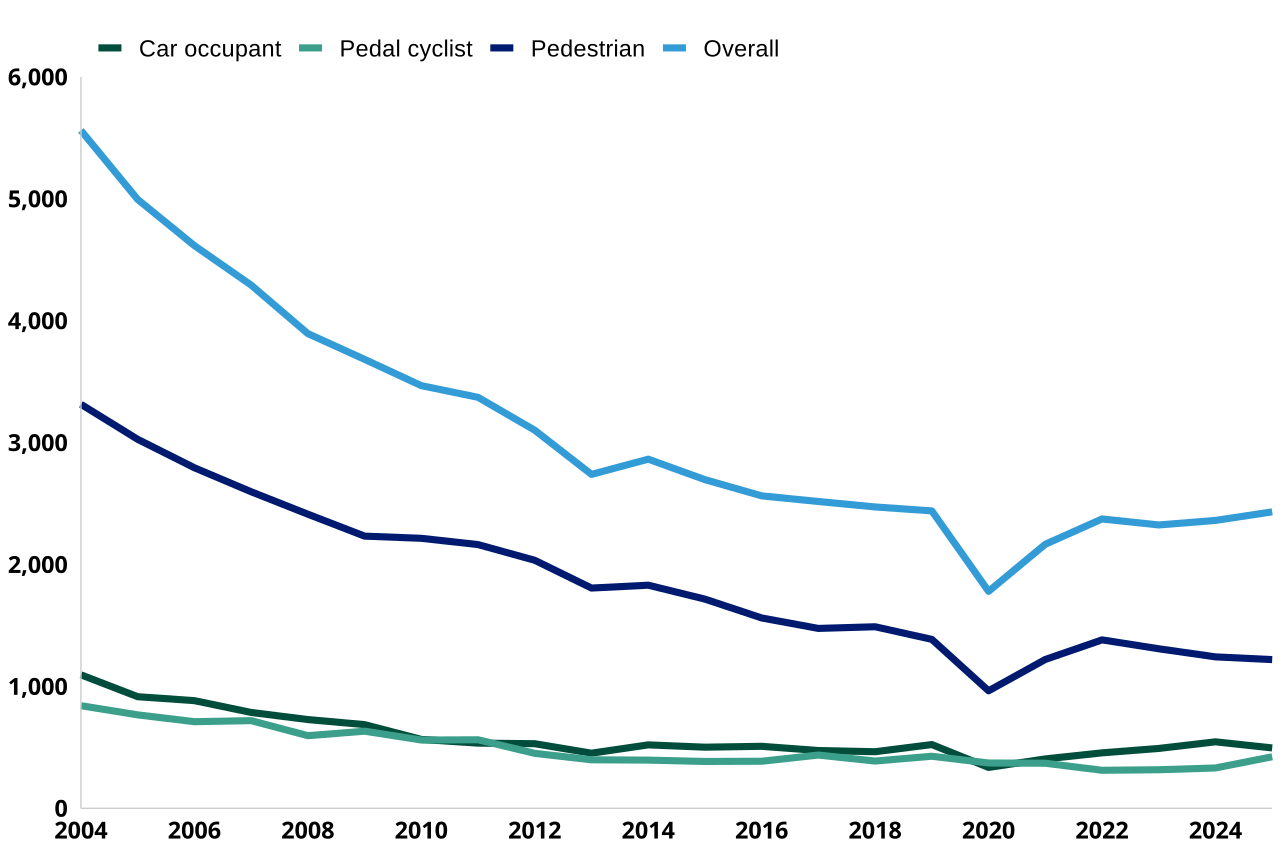
Chart 7 shows the number of reported child KSI casualties aged 0 to 15 years between 2004 and 2025. It shows that:
-
Overall child KSIs decreased from 5,561 in 2004 to 2,432 in 2025, a 56% decrease.
-
Child pedestrian KSIs decreased from 3,314 in 2004 to 1,220 in 2025, a 63% decrease, and accounted for 50% of all child KSIs in 2025.
-
Child car occupant KSIs decreased from 1,095 in 2004 to 495 in 2025, a 55% decrease.
-
Child pedal cyclist KSIs decreased from 842 in 2004 to 423 in 2025, a 50% decrease with child pedal cyclist and car occupant KSIs following similar long-term trends.
Chart 7: Number of reported child KSI casualties by road user group, Great Britain, 2004 to 2025 RAS0202
3. Casualties by age group and road user type
Chart 8 shows how the road user profile of KSI casualties varied by age in 2025. It shows that for:
-
Those aged 0 to 16, pedestrians made up the largest share of KSI casualties.
-
Those aged 17 to 29, motorcycle occupants and car drivers were the largest share of KSI casualties.
-
Adults aged 30 to 69, car drivers were the largest share of KSI casualties.
-
Adults aged 70 and over KSI casualties were mainly split between car drivers and pedestrians.
Chart 8: Number of reported KSI casualties by age group and road user type, Great Britain, 2015 to 2025 RAS0202
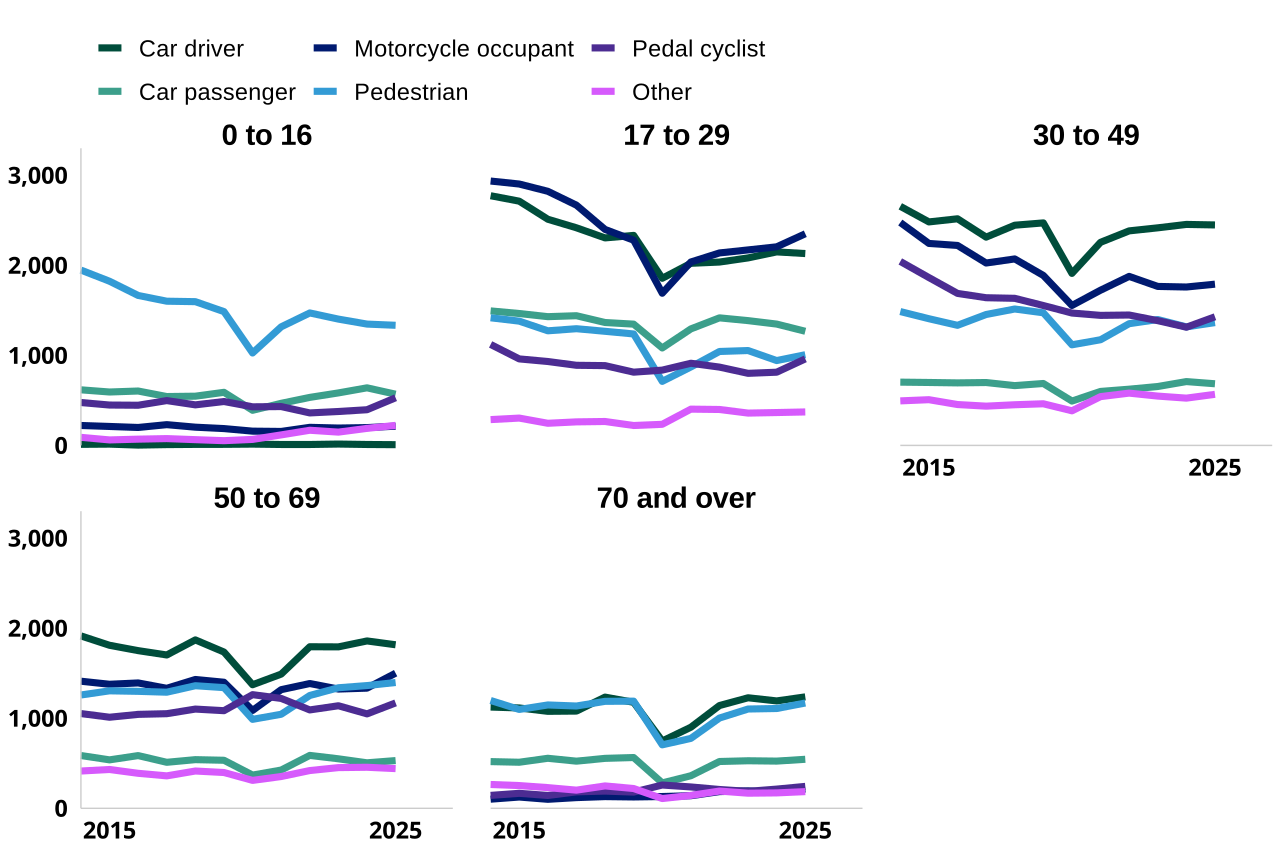
Chart 9 and Table 2 show the age profile of KSI casualties varied by casualty road user type in 2025. It shows that:
-
The largest single groups were car drivers aged 30 to 49, motorcycle occupants aged 17 to 29, and car drivers aged 17 to 29.
-
Child pedestrian KSIs were high as a share of all child KSIs, but similar to the number of pedestrian KSIs among adults aged 30 to 49 and 50 to 69.
-
Motorcycle occupant KSIs were particularly concentrated among those aged 17 to 29.
-
Car driver KSIs were highest among those aged 30 to 49, indicating that driver KSIs were not concentrated only among younger adults.
-
Pedal cyclist KSIs were highest among those aged 30 to 49.
Chart 9: Number of reported KSI casualties by age group and casualty road user type, Great Britain, 2025 RAS0202

Table 2: Number of reported KSI casualties by age group and casualty road user type, Great Britain, 2025 RAS0202
| Age group | Car driver | Car passenger | Motorcycle occupant | Pedestrian | Pedal cyclist |
|---|---|---|---|---|---|
| 0 to 16 | 8 | 569 | 214 | 1,334 | 529 |
| 17 to 29 | 2,131 | 1,268 | 2,351 | 1,007 | 961 |
| 30 to 49 | 2,449 | 685 | 1,791 | 1,364 | 1,428 |
| 50 to 69 | 1,816 | 530 | 1,501 | 1,397 | 1,171 |
| 70 and over | 1,238 | 544 | 215 | 1,170 | 244 |
4. Casualty risk by age and sex
This section looks beyond the number of casualties to consider which groups face higher risk. Casualty numbers are influenced by how much different groups travel and the types of journeys they make. To account for this, this section compares KSI casualty rates using estimated distance travelled by age group, sex and road user type, based on data from the National Travel Survey.
4.1 Casualty rates by age group and road user
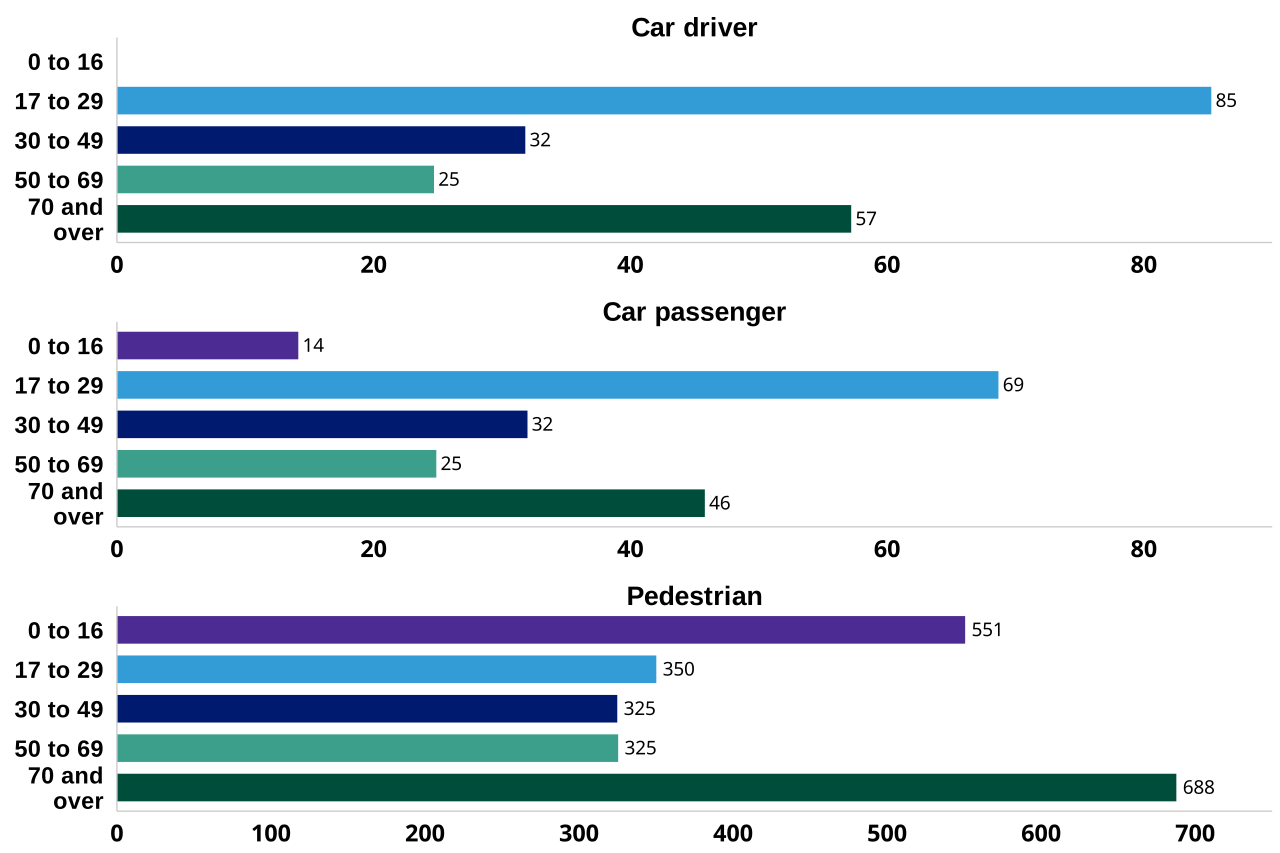
Chart 10 shows KSI rates per billion miles travelled for car drivers, car passengers and pedestrians by age group in 2025[footnote 3]. It shows that:
-
Rates for car driver casualties were highest among those aged 17 to 29, followed by those aged 70 and over. In absolute terms, driver KSI casualties were highest among those aged 30 to 49, suggesting this partly reflects greater distance driven.
-
Rates for car passenger casualties were highest among those aged 17 to 29. This group also had the highest number of car passenger KSI casualties. This shows that although the age group 17 to 29 has seen a substantial reduction in KSI casualties between 2004 and 2025, they remain a high risk group based on casualty rates.
-
Rates for pedestrian casualties were highest among people aged 70 and over, followed by children aged 0 to 16. However, absolute pedestrian KSI numbers were more evenly spread across age groups, highlighting the vulnerability of pedestrians in these age bands.
Chart 10: KSI casualty rate per billion miles travelled by age group and casualty road user type, Great Britain, 2025
5. Further information
Further data and statistics covering casualty demographics is available via:
-
Spreadsheet data tables, particularly RAS0202: road user type by sex and age group
6. About this data
Detailed information about the data used in this chapter, including its strengths and limitations, can be found in the guidance pages.
6.1 STATS19 data
The statistics in this publication are based on data collected through the STATS19 system, which records personal injury road collisions on public roads in Great Britain. STATS19 data are reported to the Department for Transport by police forces using a common national specification, allowing consistent analysis across time and geography. All collisions reported by the police within 30 days and that occurred on a public highway involving at least one motor vehicle, horse rider or pedal cyclist, and where at least one person was injured, are included in these statistics.
STATS19 is the primary source used to understand long-term trends in road collisions and casualties, and to monitor and evaluate road safety policies and interventions. Its standardised approach enables comparison at local, regional and national level, and provides a long-running time series underpinning road safety analysis.
There is no obligation for people to report all personal injury collisions to the police, and not all collisions are reported to the police, particularly those involving only slight injuries, meaning some types of incidents are under recorded. Therefore these figures do not represent the full range of collisions or casualties in Great Britain.
The quality and completeness of the data can also vary, especially for variables based on officer judgement at the scene. Changes to data collection systems, guidance or reporting practices over time may also affect comparability of trends. For example, recent updates to the STATS19 specification (including the introduction of new variables) may lead to discontinuities in some data series.
6.2 Injury severity reporting
The figures in this release for injured casualties are based on adjusting figures reported by the police to take account of changes in the reporting of injury severity by some police forces in recent years. These adjusted figures can reliably be used to compare trends over time across the country. More details can be found in our severity adjustments guidance.
7. Instructions for printing and saving
Depending on which browser you use and the type of device you use (such as a mobile or laptop) these instructions may vary.
Tablets and mobile devices normally have the option to “find in text” and “print or save” in their sharing or quick options menu of their browser, but this will vary by device model.
8. How to search
Select Ctrl and F on a Windows laptop or Command and F on a Mac
This will open a search box in the top right-hand corner of the page. Type the word you are looking for in the search bar and press enter.
Your browser will highlight the word, usually in yellow, wherever it appears on the page. Press enter to move to the next place it appears.
9. Contact details
Road safety statistics
Email roadacc.stats@dft.gov.uk
To hear more about DfT statistical publications as they are released, follow us on X (formerly known as Twitter) at DfTstats.