Reported road casualties Great Britain: fatal 4 - drink or drug driving factsheet, 2025
Published 24 September 2026

© Crown copyright 2026
This publication is licensed under the terms of the Open Government Licence v3.0 except where otherwise stated. To view this licence, visit nationalarchives.gov.uk/doc/open-government-licence/version/3 or write to the Information Policy Team, The National Archives, Kew, London TW9 4DU, or email: psi@nationalarchives.gov.uk.
Where we have identified any third party copyright information you will need to obtain permission from the copyright holders concerned.
This publication is available at https://www.gov.uk/government/statistics/reported-road-casualties-great-britain-fatal-4-factsheet/reported-road-casualties-great-britain-fatal-4-drink-or-drug-driving-factsheet-2025
About this release
This factsheet presents key statistics on collisions in Great Britain involving drivers or riders assigned one or more of the following Road Safety Factors (RSFs): “affected alcohol” or “affected by drugs” RSFs. Driving while using drugs or alcohol is one category of the Fatal 4.
RSFs helps explain why and how road collisions occur. RSFs were introduced in 2023 to replace Contributory Factors (CFs) and are being phased in gradually. This factsheet only uses data provided by police forces that were directly recording RSFs for 2024 to 2025. This may not be representative of national trends. Further information about RSFs and CFs, including the impact of the change between the two reporting systems, is available in the RSF and CF guidance. RSF percentages presented in this chapter are based only on records where at least one RSF was assigned, rather than all reported collisions or casualties.
Important note: The main statistics on drink-drive collisions are published separately and are based on recorded blood and breath test failures from STATS19 and coroners respectively. However, these statistics do not cover drug-drive collisions; this analysis of RSF data allows both drink and drug drive collisions to be considered together and compared, though is based on the opinions of reporting police officers rather than test results.
1. Main findings
This factsheet shows that:
-
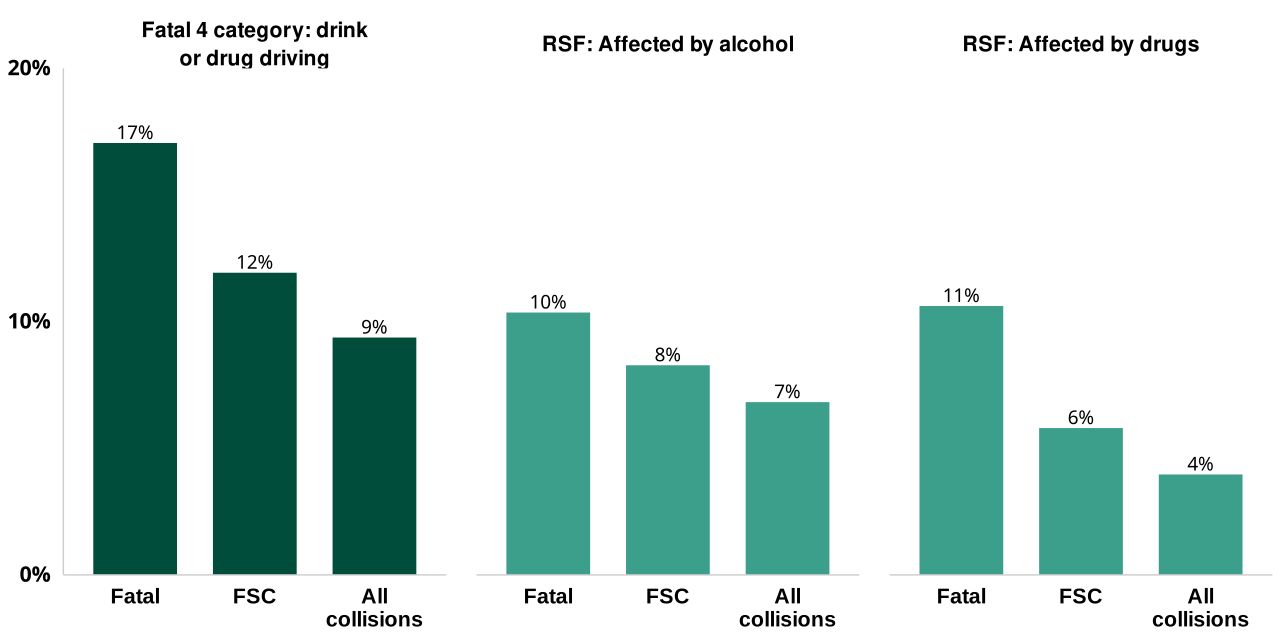
17% of fatal collisions involved at least one driver or rider assigned either the “affected by alcohol” or “affected by drugs” RSF. Of the constituent RSFs, 10% involved “affected by alcohol” and 11% involved “affected by drugs”.
-
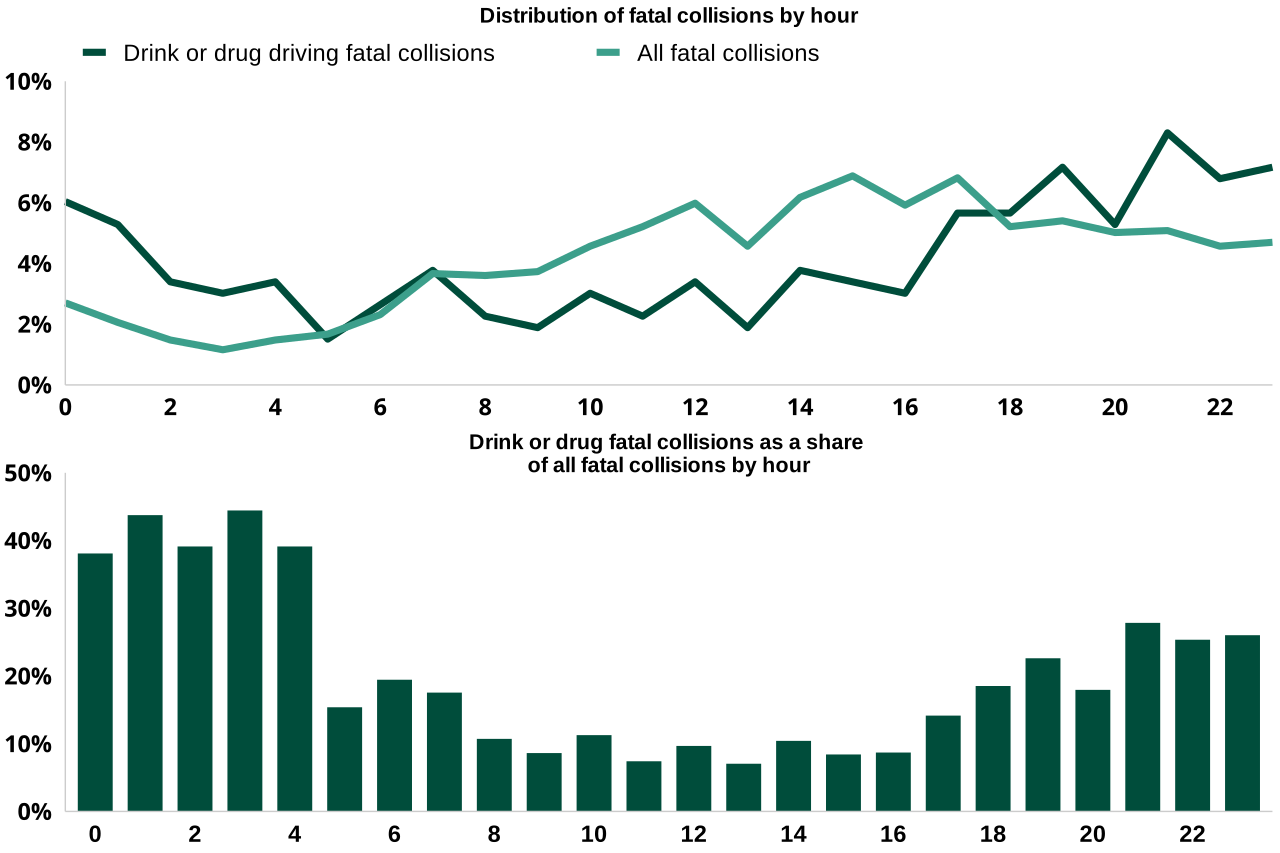
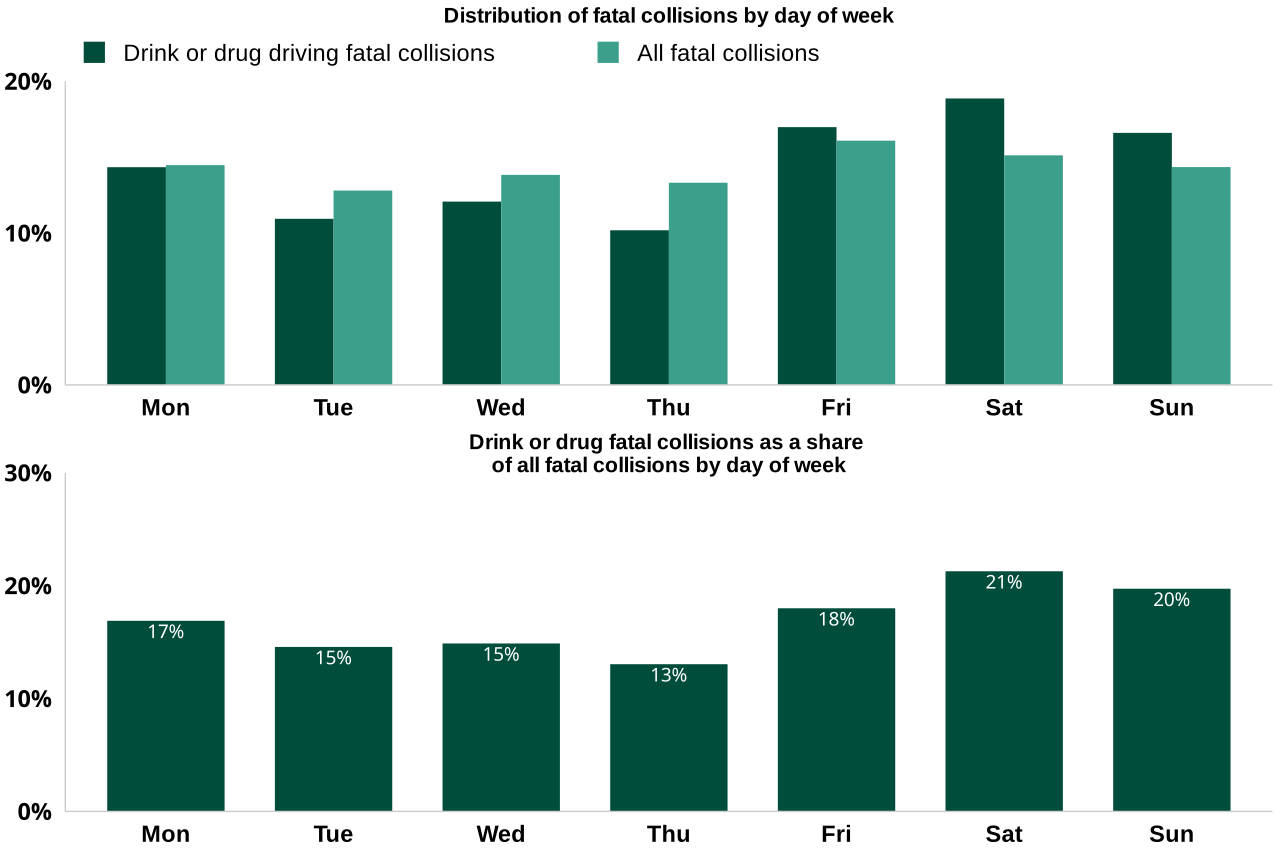
Drink- or drug-driving RSFs accounted for a higher share of fatal collisions in the evening and overnight period and at weekends, particularly Saturdays.
-
Among drivers or riders assigned at least one drink- or drug-driving RSF in fatal collisions, car drivers made up the largest share (74%). By vehicle type, 20% of car drivers assigned at least one RSF in fatal collisions had a drink- or drug-driving RSF assigned
-
The age distribution of drivers or riders assigned a drink- or drug-related RSF was concentrated among those aged 17 to 44 and generally declined with age.
-
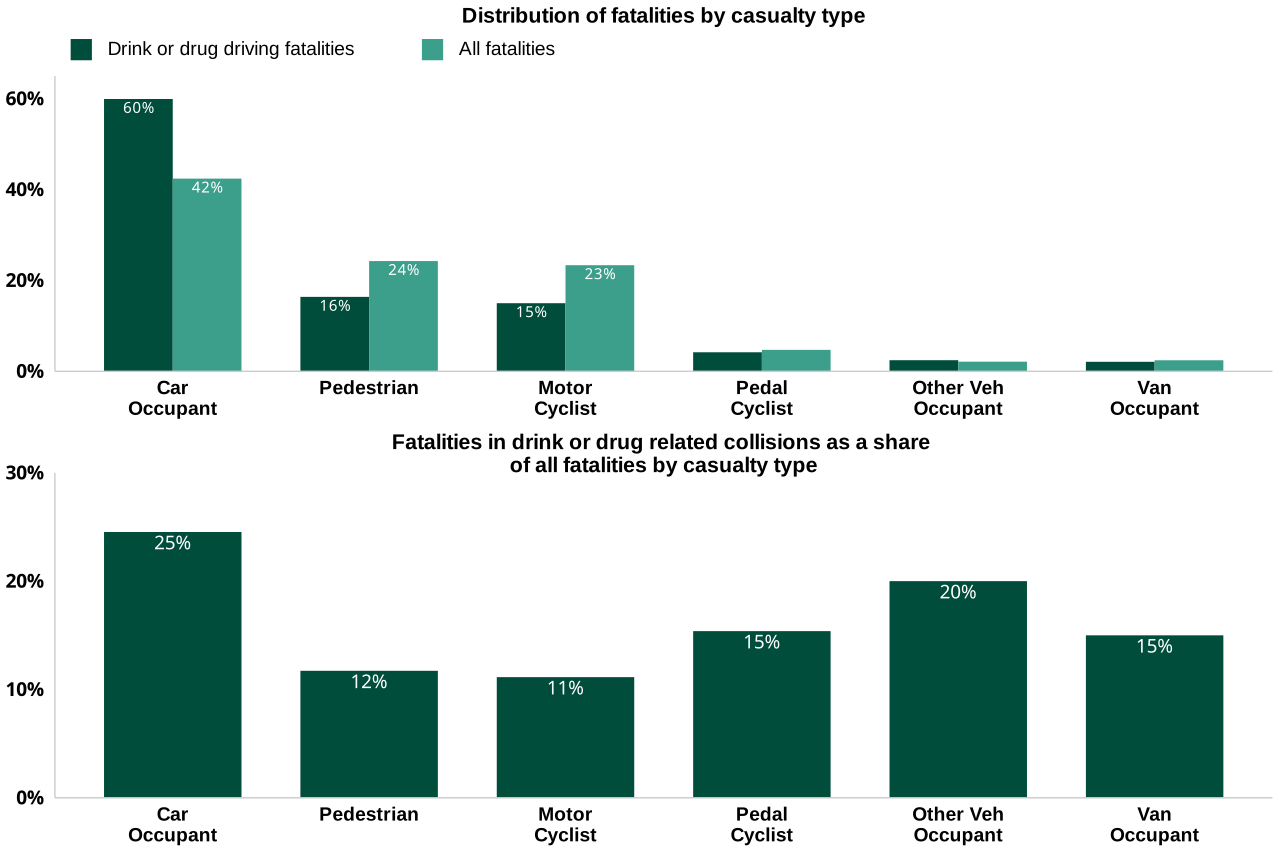
Among fatalities in collisions involving at least one drink- or drug-driving RSF, car occupants made up the largest share (60%), followed by pedestrians (22%) and motorcyclists (11%). However, by casualty type, 25% of car occupant fatalities occurred in collisions with a drink- or drug-driving RSF recorded, compared with 12% of pedestrian fatalities and 11% of motorcyclist fatalities.
-
In 52% of fatal collisions involving a drink- or drug-driving RSF, other road users were killed rather than the drink- or drug-driver.
2. Collision severity
17% of fatal collisions involved a driver or rider assigned either the “affected by alcohol” or “affected by drugs” RSF. Of the constituent RSFs, 10% of fatal collisions involved at least one driver assigned the “affected by alcohol” RSF, and 11% involved at least one driver assigned the “affected by drugs” RSF. Overall, drink- and drug-driving factors were more common in fatal collisions than in collisions of lower severity.
Chart 1: Percentage of all reported collisions involving drink- or drug-driving, by collision severity and constituent RSFs, Great Britain, 2024 to 2025
3. Fatal collision characteristics
3.1 Fatality involvement
Table 1 shows that, in most fatal collisions involving a driver or rider affected by drugs or alcohol, the majority of collisions resulted in one or more other road users being killed only (52%). In 43% of collisions, only the driver or rider affected by drugs or alcohol was killed. In 5% of collisions, both the driver or rider affected by drugs or alcohol and at least one other road user were killed.
Table 1: Distribution of reported fatal collisions involving one or more drink or drugs RSFs assigned to a driver or rider, by whether the fatalities were drivers or riders assigned the factor, or other road users, Great Britain, 2024 to 2025
| Drink or drug RSF assignment status | Percentage |
|---|---|
| One or more assigned drivers or riders and other road users killed | 5% |
| One or more assigned drivers or riders killed only | 43% |
| One or more other road users killed only | 52% |
3.2 Time of collision
Fatal collisions involving a driver or rider affected by drugs or alcohol were disproportionately concentrated in the evening and overnight period. The share of fatal collisions involving a driver or rider affected by drugs or alcohol was also substantially higher during these hours than during the daytime, with the pattern even more pronounced than for speed-related collisions.
Chart 2: Reported fatal road collisions involving one or more drink or drugs RSFs assigned to a driver or rider, compared with all fatal collisions by hour, Great Britain, 2024 to 2025
Fatal collisions involving a driver or rider affected by drugs or alcohol accounted for a larger share of collisions at weekends than on weekdays, with the highest proportion occurring on Saturdays. There were no clear trends for drink- or drug-driving by month-of-year.
Chart 3: Reported fatal road collisions involving one or more drink or drugs RSFs assigned to a driver or rider, compared with all fatal collisions by day of week, Great Britain, 2024 to 2025
3.3 Road environment
Table 2 shows that reported fatal collisions involving drink- or drug-driving were distributed similarly to all fatal collisions across road types. In both cases, most collisions occurred on rural roads.
Table 2: Distribution of fatal collisions with at least one RSF assigned by road type, Great Britain, 2024 to 2025
| Distribution | Motorways | Rural | Urban | Total |
|---|---|---|---|---|
| Drink- or drug-driving collisions | 4% | 59% | 37% | 100% |
| All collisions with at least one RSF assigned | 5% | 60% | 35% | 100% |
18% of collisions on urban roads involved a driver or driver affected by drugs or alcohol, 17% of rural road collisions and 15% of motorway collisions.
Table 3: Fatal collisions involving one or more drink or drugs RSFs assigned to a driver or rider as a share of all fatal collisions with at least one RSF assigned by road type, Great Britain, 2024 to 2025
| Road type | Percentage |
|---|---|
| Motorways | 15% |
| Urban | 18% |
| Rural | 17% |
4. Drivers and riders in fatal collisions
Percentages in this section are based on driver or rider vehicles in fatal collisions with at least one directly-recorded drink- or drug-related RSF assigned, compared to driver or rider vehicles with at least one directly-recorded RSF assigned.
Among drivers or riders assigned at least one drink- or drug-driving RSF in fatal collisions, most were car drivers, accounting for 74% of drink- and drug-driving RSF assignments. This was a larger share than for drivers or riders assigned any RSF overall (61%), suggesting that drink- and drug-driving factors were disproportionately associated with car drivers.
Looking within vehicle type, drink- or drug-driving RSFs were assigned to 20% of car drivers and 21% of van drivers who were assigned at least one RSF, compared with 9% of motorcycle riders.
Chart 4: Drivers or riders with one or more drink or drugs RSFs assigned compared with all drivers or riders with at least one RSF assigned in fatal collisions by vehicle type, Great Britain, 2024 to 2025

Chart 5 shows that drivers or riders aged 17 to 44 accounted for the largest shares of those assigned at least one drink- or drug-driving RSF in fatal collisions, with the highest shares among those aged 25 to 34 and 35 to 44. Around 27% of drivers or riders aged 25 to 34 assigned at least one RSF in a fatal collision were assigned a drink- or drug-driving RSF, compared with 25% of those aged 35 to 44 and 24% of those aged 17 to 24. The proportion generally declined with age, falling to just 2% among those aged 85 and over.
Chart 5: Drivers or riders with one or more drink or drugs RSFs assigned compared with all drivers or riders with at least one RSF assigned in fatal collisions by age, Great Britain, 2024 to 2025
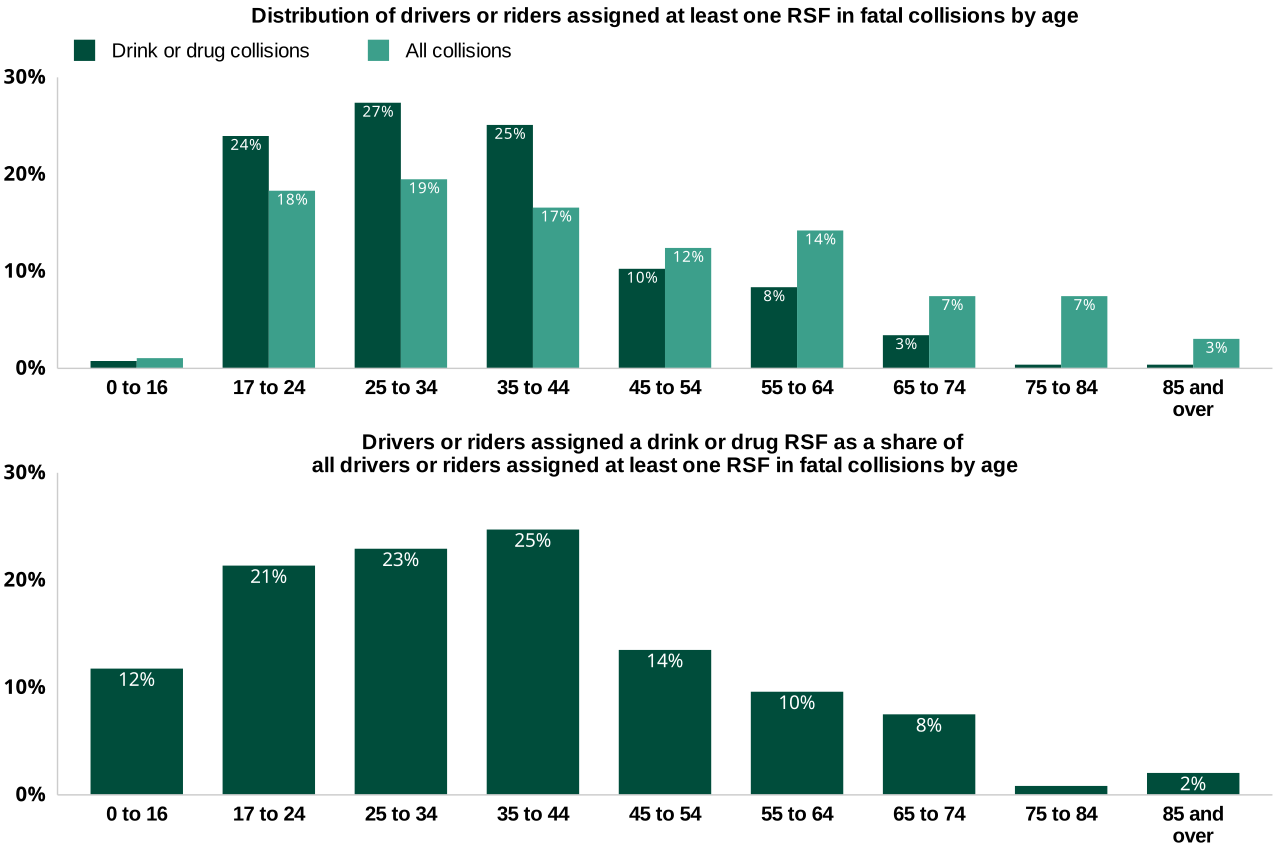
Table 4 shows that male drivers or riders are much more likely than female drivers or riders to be assigned at least one drink- or drug-driving related RSF in fatal collisions. Compared with all drivers or riders assigned at least one RSF in fatal collisions by sex, males made up a higher share of drink- or drug-drivers (90% vs 84%), while females make up a lower share (10% vs 16%).
Table 4: Distribution of drivers or riders assigned one or more drink or drugs RSFs in fatal collisions compared with all drivers or riders assigned at least one RSF in fatal collisions by sex, Great Britain, 2024 to 2025
| Distribution | Male | Female | Total |
|---|---|---|---|
| Drink or drug drivers or riders | 90% | 10% | 100% |
| All drivers or riders with at least one RSF assigned | 84% | 16% | 100% |
Among drivers assigned at least one RSF in fatal collisions, 18% of males were assigned at least one drink- or drug-related RSF, compared with 10% of females.
Table 5: Drivers or riders assigned one or more drink or drugs RSFs in fatal collisions as a share of all drivers or riders assigned at least one RSF in fatal collisions by sex, Great Britain, 2024 to 2025
| Sex | Percentage |
|---|---|
| Male | 18% |
| Female | 10% |
5. Fatalities
Percentages in this section are based fatalities in reported road traffic collisions. Fatalities includes drivers or riders, passengers and pedestrians.
Car occupants made up the largest share of fatalities in collisions involving at least one drink- or drug-driving RSF, followed by pedestrians and motorcyclists. Compared with their share of all fatalities, car occupant fatalities were over represented in collisions involving drink- or drug-driving (60% of fatalities, compared to 42% of fatalities).
25% of car occupant fatalities occurred in collisions involving drink or drug driving, 12% of pedestrian fatalities and 11% of motorcycle fatalities.
Chart 6: Fatalities in collisions with one or more drink or drugs RSFs assigned compared with all fatalities by casualty type, Great Britain, 2024 to 2025
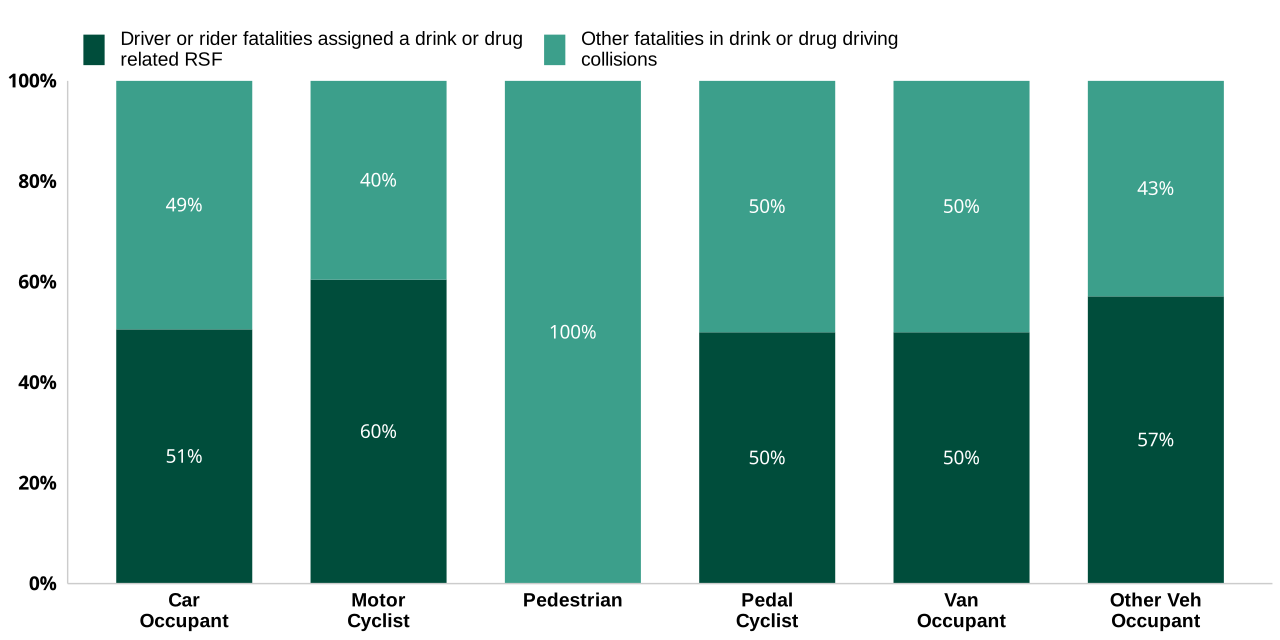
Of fatalities in drink- or drug-driving collisions, 51% of car occupant fatalities were assigned the drink- or drug-driving factor, while 49% were not. For motorcycle fatalities, 60% were assigned the drink- or drug-driving factor, while 40% were not.
Chart 7: Distribution of fatalities in collisions with one or more drink or drugs RSFs assigned, by casualty type and RSF assigned status, Great Britain, 2024 to 2025
6. About this data
Detailed information about the data used in this chapter, including its strengths and limitations, can be found in the guidance pages.
6.1 STATS19 data
The statistics in this publication are based on data collected through the STATS19 system, which records personal injury road collisions on public roads in Great Britain. STATS19 data are reported to the Department for Transport by police forces using a common national specification, allowing consistent analysis across time and geography. All collisions reported by the police within 30 days and that occurred on a public highway involving at least one motor vehicle, horse rider or pedal cyclist, and where at least one person was injured, are included in these statistics.
STATS19 is the primary source used to understand long-term trends in road collisions and casualties, and to monitor and evaluate road safety policies and interventions. Its standardised approach enables comparison at local, regional and national level, and provides a long-running time series underpinning road safety analysis.
There is no obligation for people to report all personal injury collisions to the police, and not all collisions are reported to the police, particularly those involving only slight injuries, meaning some types of incidents are under recorded. Therefore these figures do not represent the full range of collisions or casualties in Great Britain.
The quality and completeness of the data can also vary, especially for variables based on officer judgement at the scene. Changes to data collection systems, guidance or reporting practices over time may also affect comparability of trends. For example, recent updates to the STATS19 specification (including the introduction of new variables) may lead to discontinuities in some data series.
6.2 Injury severity reporting
The figures in this release for injured casualties are based on adjusting figures reported by the police to take account of changes in the reporting of injury severity by some police forces in recent years. These adjusted figures can reliably be used to compare trends over time across the country. More details can be found in our severity adjustments guidance.
6.3 Road safety factors and contributory factors
When police officers attend the scene of a collision, they can select up to 6 factors they believe contributed to the collision and assign them to vehicles, casualties or uninjured pedestrians involved. This is based on the police officer’s professional judgement and before a full investigation.
The number of RSFs recorded is impacted by the number of road casualty collisions which occur and the number of collisions in which a police officer has attended and records an RSF. To account for this, data has been presented as the percentage of collisions with an RSF assigned. Because a collision can be assigned multiple factors, the percentages presented may sum to more than 100%.
In 2025, 75% of eligible collisions had RSFs recorded rather than CFs. To avoid presenting misleading data, directly recorded and converted RSFs have been presented alongside each other with 2024 as the changeover year. Differences between the converted and directly recorded RSFs may reflect changes in data collection and recording practices, meaning comparisons between the two series should be interpreted with caution.
Further information about RSFs and CFs, including the impact of the change between the two reporting systems, is available in the RSF and CF guidance.
7. Instructions for printing and saving
Depending on which browser you use and the type of device you use (such as a mobile or laptop) these instructions may vary.
Tablets and mobile devices normally have the option to “find in text” and “print or save” in their sharing or quick options menu of their browser, but this will vary by device model.
8. How to search
Select Ctrl and F on a Windows laptop or Command and F on a Mac
This will open a search box in the top right-hand corner of the page. Type the word you are looking for in the search bar and press enter.
Your browser will highlight the word, usually in yellow, wherever it appears on the page. Press enter to move to the next place it appears.
9. Contact details
Road safety statistics
Email roadacc.stats@dft.gov.uk
To hear more about DfT statistical publications as they are released, follow us on X (formerly known as Twitter) at DfTstats.