Public spending statistics: July 2026
Updated 29 July 2026

© Crown copyright 2026
This publication is licensed under the terms of the Open Government Licence v3.0 except where otherwise stated. To view this licence, visit nationalarchives.gov.uk/doc/open-government-licence/version/3 or write to the Information Policy Team, The National Archives, Kew, London TW9 4DU, or email: psi@nationalarchives.gov.uk.
Where we have identified any third party copyright information you will need to obtain permission from the copyright holders concerned.
This publication is available at https://www.gov.uk/government/statistics/public-spending-statistics-release-july-2026/public-spending-statistics-july-2026
Introduction
This Accredited Official Statistics release is intended to provide comprehensive information on public spending. Data are arranged thematically by section. Each section contains overview commentary on the statistics being released, statistical tables, and further background information.
The key data being updated in this release are for the years 2021-22 to 2025-26. This release contains the first estimate of 2025-26 outturn. All data in this release are Accredited Official Statistics and are on an outturn basis. Where major revisions to the data for past years have been made we refer to them in the text accompanying the tables. Further background detail is found in the accompanying background material published alongside this release.
HM Treasury Public Spending Statistics (PSS) provide a range of information about public spending. Further detailed explanations are provided in the PSS guidance document. This information can be found on the main release page.
Accredited Official Statistics are official statistics that have been independently reviewed by the Office for Statistics Regulation (OSR) and confirmed to comply with the standards of trustworthiness, quality and value in the Code of Practice for Statistics. Accredited official statistics are called National Statistics in the Statistics and Registration Service Act 2007. These accredited official statistics were independently reviewed by the Office for Statistics Regulation in November 2011. They comply with the standards of trustworthiness, quality and value in the Code of Practice for Statistics and should be labelled ‘accredited official statistics’.
Our statistical practice is regulated by the Office for Statistics Regulation (OSR). OSR sets the standards of trustworthiness, quality and value in the Code of Practice for Statistics that all producers of official statistics should adhere to. For further information, please see the explanation web page on the OSR website.
You are welcome to contact us directly with any comments about how we meet these standards. Alternatively, you can contact OSR by emailing regulation@statistics.gov.uk or via the OSR website.
Related releases from HM Treasury
- The Public Expenditure Statistical Analyses (PESA) command paper is an annual release, containing plans data for the Spending Review period, alongside the data contained in this release.
- The quarterly public spending statistics releases update the key series found in this release.
- HM Treasury published a Covid Cost Tracker on gov.uk as accredited official statistics. This was previously published by the NAO. It brings together data from across the UK government. and provide estimates of the cost of measures announced in response to the COVID-19 pandemic (where this information is publicly available or has been provided to HM Treasury by government departments).
- Changes to this release have been made in response to requests from the United Kingdom Statistics Authority and feedback received from users. We welcome further user feedback at pesa@hmtreasury.gov.uk
What’s new
- Responsibility for apprenticeships, adult further education, skills, training and careers, and Skills England moved from the Department for Education to the Department for Work and Pensions on 16 September 2025.
- Policy and operational responsibility for fire functions transferred to the Ministry for Housing, Communities and Local Government from the Home Office on 1 April 2025. This change was reflected in departments’ budgets at Supplementary Estimates 2025-26.
- The management of the Integrated Security Fund, and associated funding, was permanently transferred from the Foreign, Commonwealth and Development Office to the Cabinet Office on 14 April 2026.
- The Defence Exports Office transferred from the Department for Business and Trade to the Ministry of Defence in July 2025.
- Policy responsibility for government and public sector cyber-security was transferred from the Cabinet Office to the Department for Science, Innovation and Technology (DSIT) on 3 June 2025.
- Policy and response responsibilities for severe space weather transferred from the Department for Energy Security and Net Zero to DSIT on 17 December 2025.
- At the 2026-27 Main Estimates, depreciation and impairments which were previously ring-fenced within resource DEL were reclassified as resource AME. Only a small number of regulators and independent entities within the Small and Independent Bodies departmental group continue to report depreciation in DEL[footnote 1].
- Expenditure by the British Business Bank, other than operating spend and offsetting investment income, now scores to AME rather than DEL. This affects the budgets of the Department for Business and Trade (DBT).
- Not all departments had produced their Annual Report and Accounts for 2025-26 as at publication of PESA 2026. Outturn data may therefore be subject to revisions. The public spending statistics (PSS) release, published on a quarterly basis, will reflect any later revisions made by departments to their 2025-26 outturn.
Departmental budgets
The tables for departmental budgets in chapter 1 bring together information on public expenditure within the current budgeting and control framework. This comprises departmental budgets, including all control totals, as well as reconciling from the budgetary framework to the fiscal aggregates in the National Accounts.
DEL expenditure in real terms (billions)
| Expenditure | 2024-25 | 2025-26 |
|---|---|---|
| Resource DEL | 485.8 | 496.7 |
| Capital DEL | 115.4 | 127.5 |
| Total DEL | 616.4 | 639.8 |
Total DEL is given by resource DEL plus capital DEL. This excludes the Scottish Government Block Grant adjustments as shown in Table 1.3.
Departmental expenditure limits (DEL)
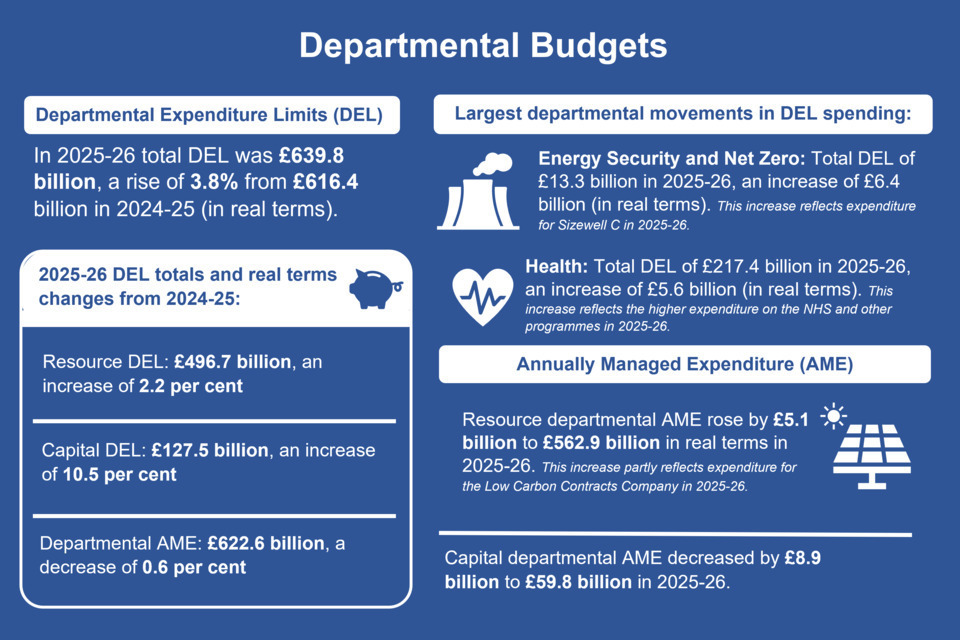
- Total resource DEL was £496.7 billion in 2025-26, an increase of 2.2 per cent in real terms on the previous year.
- Total capital DEL was £127.5 billion in 2025-26, an increase of 10.5 per cent in real terms on the previous year.
- Total DEL in real terms increased by 3.8 per cent in 2025-26 from £616.4 billion in 2024-25 to £639.8 billion.
- The largest increase in DEL spending in real terms in 2025-26 was for Energy Security and Net Zero which was up by £6.4 billion to £13.3 billion. This increase reflects expenditure on Sizewell C.
- The second largest increase in DEL spending in real terms in 2025-26 was for Health which was up by £12.7 billion to £217.4 billion. This increase reflects the higher expenditure on the NHS and other programmes.
Total Departmental Expenditure Limits, 2025-26 (£millions)
For the full table, including years from 2021-22 onward, please refer to Table 1.9 in the accompanying Chapter 1 tables file.
| Departmental Group | Total DEL |
|---|---|
| Health and Social Care | 217,409 |
| Education | 97,262 |
| Home Office | 19,622 |
| Justice | 14,071 |
| Law Officers’ Departments | 982 |
| Defence | 61,994 |
| Single Intelligence Account | 4,932 |
| Foreign, Commonwealth and Development Office | 10,890 |
| MHCLG - Local Government | 13,813 |
| MHCLG - Housing and Communities | 13,020 |
| Culture, Media and Sport | 2,206 |
| Science, Innovation and Technology | 14,970 |
| Transport | 28,974 |
| Energy Security and Net Zero | 13,299 |
| Environment, Food and Rural Affairs | 7,313 |
| Business and Trade | 3,413 |
| Work and Pensions | 14,759 |
| HM Revenue and Customs | 6,727 |
| HM Treasury | 1,195 |
| Cabinet Office | 1,134 |
| Scottish Government | 47,757 |
| Welsh Government | 21,609 |
| Northern Ireland Executive | 19,115 |
| Small and Independent Bodies | 3,342 |
Annually Managed Expenditure (AME)
- Resource departmental AME increased by £5.1 billion to £562.9 billion in real terms in 2025-26. This is largely due to higher expenditure by Energy Security and Net Zero (after an increase of expenditure for the Low Carbon Contracts Company).
- Capital departmental AME decreased by £8.9 billion to £59.8 billion in real terms in 2025-26, largely driven by lower spend on financial sector interventions by HM Treasury.
Departmental AME expenditure in real terms (billions)
| Expenditure | 2024-25 | 2025-26 |
|---|---|---|
| Resource departmental AME | 557.8 | 562.9 |
| Capital departmental AME | 68.6 | 59.8 |
| Total departmental AME | 626.4 | 622.6 |
Economic analysis of budgets
The tables in chapter 2 of Public Spending Statistics present an analysis by economic category of the budgeting aggregates shown in chapter 1. A description of the economic categories referred to below can be found in the main chapter text of PESA.
Resource DEL
- Total resource DEL was £496.7 billion in 2025-26, compared to £469.6 billion in 2024-25, in nominal terms.
- Staff costs increased by 7.3 per cent in 2025-26 (to £211.4 billion) and gross current procurement rose by 4.1 per cent (to £179.1 billion). A breakdown of gross current procurement by individual departments is shown in table 2.2.
- Spending on administration, composed mainly of pay and procurement, stood at £13.8 billion in 2025-26. This is a rise of 11.7 per cent from the previous year.
Resource AME
- Resource departmental AME increased from £539.2 billion to £562.9 billion in 2025-26 in nominal terms. The largest component of spending within resource AME is made up of grants to persons and non-profit bodies, which is mainly social security benefits. Expenditure on this heading showed the largest increase in 2025-26 and rose by 6.8 per cent to £332.1 billion in 2025-26 from £311.0 billion in the previous year. This reflects higher expenditure for Work and Pensions on Universal Credit and State Pensions.
Capital budgets
- Capital spending within budgets was £187.3 billion in 2025-26, an increase of 5.2 per cent on the previous year. The majority of capital spending occurred within DEL.
- Net lending and investment to the private sector and abroad totalled £41.1 billion in 2025-26 compared to £29.6 billion in 2024-25, an increase of £11.4 billion. This reflects higher expenditure by HM Treasury on the National Wealth Fund.
Trends in public spending
The tables in chapter 4 show trends in public spending on a longer run basis than other chapters in this release, in nominal, real (inflation-adjusted) and percentage of GDP terms.
Table 4.1 shows long run trends in Total Managed Expenditure (TME) and its Public Sector Current Expenditure (PSCE) and Public Sector Net Investment (PSNI) components back to 1985-86.
Tables 4.2 to 4.4 show total expenditure on services split by high level spending function (health, education, social protection, etc.) back to 2003-04.
Trends in TME, PSCE and PSNI (Table 4.1)
- During 2025-26, Total Managed Expenditure has increased in nominal terms by £70.1 billion (5.4 per cent), and in real (inflation-adjusted) terms by £25.7 billion (1.9 per cent).
- TME as a percentage of GDP, which shows the size of the public sector relative to the size of the whole economy, was 44.3 per cent in 2025-26. This has increased from 44.0 per cent in 2024-25.
Trends in functional expenditure (Table 4.2 to 4.4)
- In real terms, spending in seven of the ten functions (excluding EU transactions) increased whilst spending in three functions decreased during 2025-26.
- The largest real terms percentage increases were in ‘Environment protection’ (7.3 per cent), followed by ‘Recreation, culture and religion’ (6.9 per cent), and by ‘Public order and safety’ (4.1 per cent).
- The largest real terms decreases in spending were in ‘Education’ (-1.2 per cent), followed by ‘Defence’ (-0.7 per cent).
- For greater detail see Table 5.2, which shows a breakdown of public spending at the sub-functional level.
Chart 1: Trends in public spending since 2003-04
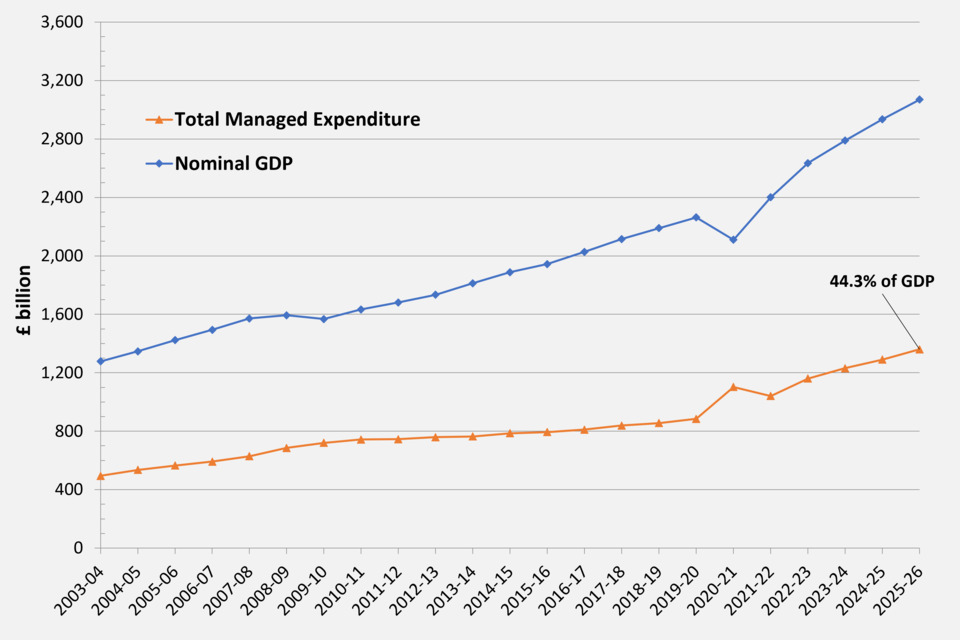
Chart 2: Real terms trends in Public Spending
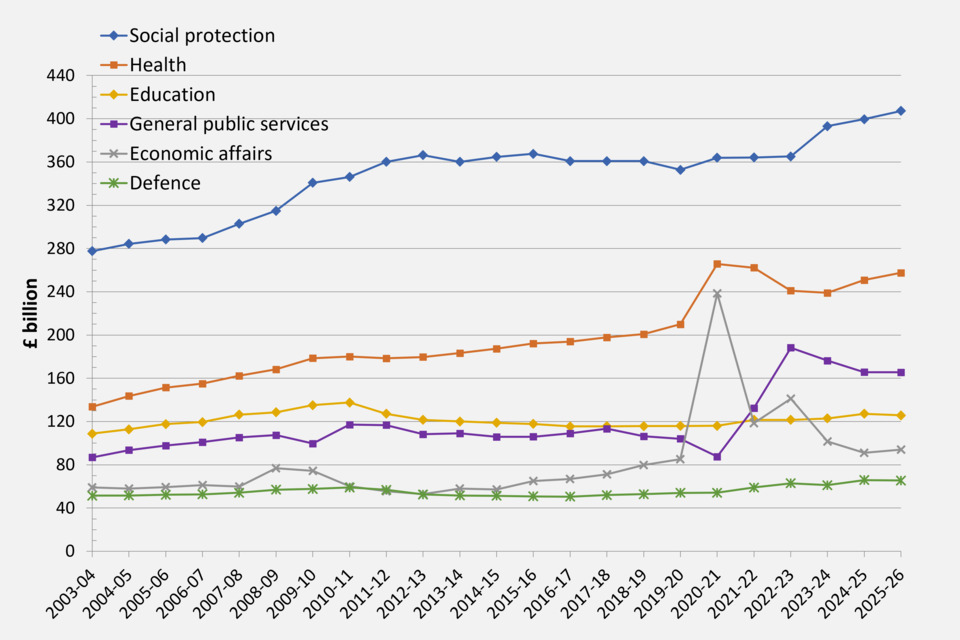
From 2011-12 onwards the ‘grant-equivalent element of student loans’ is no longer part of the TES framework and has therefore been removed from the Education function. Therefore figures are not directly comparable between 2010-11 and 2011-12. A full explanation of this decision can be found in PESA 2016 Annex E.
Public sector spending by function, sub-function and economic category
- The tables in chapter 5 of this release present analysis of total public sector expenditure on services split by function, sub-function and economic category.
- Year on year changes on a functional basis as described below are derived from tables 4.2 or 5.4, whilst sub-functional changes year on year are derived from table 5.2.
- These presentations are more stable between years than presentations of data by government department on a budgeting basis (Chapters 1 and 2) because they are not affected by changes in the structure of Government over time.
Functional tables
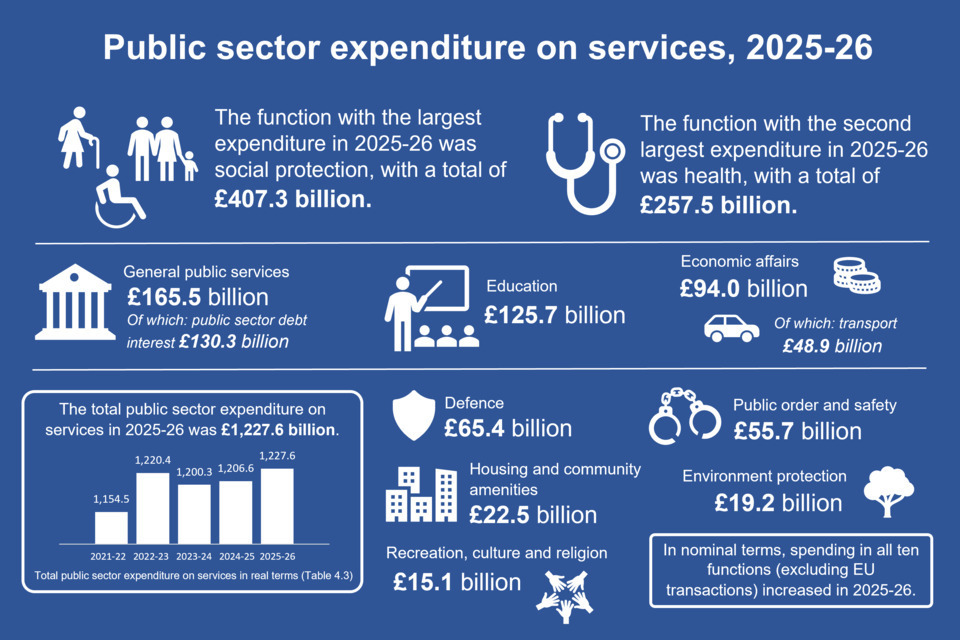
- In nominal terms, spending in all ten functions (excluding EU transactions) increased in 2025-26.
- The largest increases in percentage terms were in ‘Environment protection‘ (11.0 per cent), ‘Recreation, culture and religion’ (10.6 per cent), and ‘Public order and safety’ (7.7 per cent).
Sub-functional tables
- The largest nominal spending increase by function in 2025-26 was in ‘Social protection’ with an increase of £21.0 billion. Within this, ‘Social exclusion n.e.c.’[footnote 2] rose by £10.2 billion, driven largely by an increase of £10.6 billion within ‘family benefits, income support, Universal Credit and tax credits’ (offset slightly by a fall in personal social services).
- ‘Health’ saw the second largest nominal increase in 2025-26 of £15.1 billion. Within this, ‘Medical services’ rose by £15.3 billion.
- ‘Economic affairs’ saw the third largest nominal increase in 2025-26 of £6.0 billion (an increase of 6.8 per cent), of which ‘Fuel and energy’ rose by £2.7 billion.
Central government own expenditure
The tables in chapter 6 of Public Spending Statistics (PSS) present analyses of central government own expenditure. This is spending by government departments and other central government bodies on their own activities. Central government support for local government and capital support for public corporations is not included.
- Tables 6.1 to 6.3 show central government expenditure on a budgeting basis, consistent with the data shown in chapters 1 and 2.
- Tables 6.4 to 6.6 show expenditure on services, consistent with chapters 4 and 5.
Expenditure in budgets
- Central government own expenditure within DEL stood at £489.8 billion in 2025-26, up 6.0 per cent on the total of £461.9 billion in 2024-25.
- Expenditure within AME increased to £586.9 billion in 2025-26 from £547.7 billion in 2024-25. This is largely due to increases for Work and Pensions and Education.
Expenditure on services
- Central government’s own current expenditure on services increased to £871.6 billion in 2025-26, from £816.2 billion the previous year. Capital expenditure on services increased to £106.4 billion in 2025-26 from £96.3 billion in 2024-25.
- As shown in Table 6.4, ‘Social protection’ and ‘Health’ together account for more than half of all of central government own expenditure on services. In 2025-26 spending on social protection increased to £338.3 billion compared to £316.8 billion in the previous year.
- Expenditure on ‘Central government debt interest’ increased from £85.4 billion in 2024-25 to £96.9 billion in 2025-26, an increase of 13.5 per cent.
- Expenditure on ‘Pay’ rose from £211.4 billion in 2024-25 to £227.0 billion in 2025-26, an increase of 7.4 per cent.
Local government financing and expenditure
Chapter 7 analyses central government support for local government within budgets (tables 7.1 to 7.3) and local government expenditure on services (tables 7.4 to 7.8). It deals primarily with Great Britain, as most equivalent spending in Northern Ireland is central government spending carried out by Northern Ireland departments.
Central government support for Local government
- Total central government support in DEL was £100.7 billion in 2025-26, up from £90.1 billion the year before. Support in AME fell from £52.1 billion to £51.2 billion over the same period.
- Capital support for local government rose from £13.6 billion in 2024-25 to £16.8 billion in 2025-26.
Local government expenditure on services
- Total local government current expenditure on services was £180.8 billion in 2025-26, up from £178.0 billion in 2024-25. Over the same period total local government capital expenditure on services rose from £24.3 billion to £26.0 billion.
- Local government current expenditure rose in 2025-26 for six of the ten functions. The three largest increases were seen in ‘Education’ (up £1.7 billion), ‘Public order and safety’ (up £1.0 billion), and ‘Environment protection’ (up £0.4 billion).
- A breakdown of local government expenditure by economic category is shown in table 7.8. Spending on pay, which amounted to £84.0 billion in 2025-26, accounts for over 40 per cent of all spending on services by local government.
Public corporations
Chapter 8 analyses the impact of public corporations on departmental budgets and expenditure on services.
Tables 8.1 and 8.2 examine the impact on departmental budgets (DEL and departmental AME), breaking this down by economic category and departmental group.
Tables 8.3 to 8.5 analyse capital spending by public corporations. They break the expenditure down by individual public corporations as well as by function and economic category. Debt interest payments to the private sector, which is the only public corporation current spending that forms part of Total Managed Expenditure (TME), is also included.
- Public corporations’ capital expenditure was £15.8 billion in 2025-26, up from £15.5 billion the year before.
- Out of this total, expenditure by the Housing Revenue Account (for England, Scotland and Wales) was £8.5 billion, down from £8.8 billion the previous year.
- The other main contributors to public corporations’ capital expenditure were London Underground (as Transport Trading Limited) and Scottish Water.
Public expenditure by country and additional information
Country and regional analysis in this release
The Country and Regional Analysis (CRA) is published each autumn. As a result there are no new substantive data on regional spending for this PSS release. However, the four headline tables of the CRA release published in November 2025 have been included in chapter 9.
Revisions in this release
All of the data contained in the Public Spending National Statistics are open for revision in every publication. The table below summarises the key revisions in this release.
| Revisions to Budgets since July 2025 (£million) | 2021-22 | 2022-23 | 2023-24 | 2024-25 |
|---|---|---|---|---|
| Total Managed Expenditure | -2,834 | -285 | 1,809 | 4,796 |
| Total Departmental Expenditure Limits (DEL) | -382 | -246 | -373 | -337 |
| Departmental Annually Managed Expenditure (AME) | 29,573 | 20,400 | 40,869 | 42,486 |
| Other AME | -32,025 | -20,440 | -38,687 | -37,353 |
| Total resource DEL | -28,867 | -19,875 | -40,083 | -47,089 |
| Total capital DEL | -490 | -354 | -452 | -229 |
Figures for Total Managed Expenditure (TME) are taken from the ONS/HM Treasury Public Sector Finances release. The main revisions since last July’s publication are: * The large downward revisions to Resource DEL and upward revisions to Resource AME in all years is a result of the reclassification of the depreciation ringfence from DEL to AME. Changes to non-departmental AME also reflect the new treatment of depreciation.
- Changes to TME and other AME in all years are due to updated ONS data from the May 2026 release. More information about these changes is available in the monthly ONS public sector finances (PSF) release.
- Local government expenditure has also been revised.
GDP deflators and population numbers
GDP deflators
A number of the tables in this publication give figures in real terms. Real terms figures are the current price outturns or plans adjusted to a constant price level by excluding the effect of general inflation as measured by the GDP deflator at market prices. The real terms figures in this publication are given in 2025-26 prices. The GDP deflators used in this publication are those given below. The most up to date deflators can be found on the GOV.UK website.
| Financial year | GDP deflator at market prices | per cent change on previous year | Money GDP (£million) |
|---|---|---|---|
| 1985-86 | 30.240 | 5.45 | 424,559 |
| 1986-87 | 31.469 | 4.06 | 456,205 |
| 1987-88 | 33.301 | 5.82 | 512,832 |
| 1988-89 | 35.568 | 6.81 | 572,031 |
| 1989-90 | 38.444 | 8.09 | 631,607 |
| 1990-91 | 41.669 | 8.39 | 681,464 |
| 1991-92 | 44.175 | 6.01 | 716,584 |
| 1992-93 | 45.386 | 2.74 | 741,206 |
| 1993-94 | 46.678 | 2.85 | 783,220 |
| 1994-95 | 47.452 | 1.66 | 823,670 |
| 1995-96 | 48.954 | 3.16 | 866,285 |
| 1996-97 | 50.610 | 3.38 | 926,554 |
| 1997-98 | 50.741 | 0.26 | 970,388 |
| 1998-99 | 51.454 | 1.41 | 1,014,098 |
| 1999-00 | 52.090 | 1.24 | 1,060,973 |
| 2000-01 | 52.554 | 0.89 | 1,117,633 |
| 2001-02 | 53.608 | 2.00 | 1,159,585 |
| 2002-03 | 54.710 | 2.06 | 1,210,146 |
| 2003-04 | 56.052 | 2.45 | 1,277,594 |
| 2004-05 | 57.723 | 2.98 | 1,346,417 |
| 2005-06 | 59.309 | 2.75 | 1,423,557 |
| 2006-07 | 61.091 | 3.01 | 1,493,448 |
| 2007-08 | 62.286 | 1.96 | 1,571,927 |
| 2008-09 | 64.608 | 3.73 | 1,593,267 |
| 2009-10 | 65.444 | 1.29 | 1,567,070 |
| 2010-11 | 66.557 | 1.70 | 1,632,926 |
| 2011-12 | 67.978 | 2.13 | 1,680,937 |
| 2012-13 | 69.157 | 1.73 | 1,733,512 |
| 2013-14 | 70.595 | 2.08 | 1,812,306 |
| 2014-15 | 71.593 | 1.41 | 1,888,114 |
| 2015-16 | 72.090 | 0.69 | 1,943,837 |
| 2016-17 | 73.535 | 2.00 | 2,027,118 |
| 2017-18 | 74.467 | 1.27 | 2,114,617 |
| 2018-19 | 76.164 | 2.28 | 2,189,839 |
| 2019-20 | 78.174 | 2.64 | 2,263,357 |
| 2020-21 | 82.259 | 5.23 | 2,109,996 |
| 2021-22 | 82.455 | 0.24 | 2,400,398 |
| 2022-23 | 88.251 | 7.03 | 2,634,336 |
| 2023-24 | 92.895 | 5.26 | 2,789,505 |
| 2024-25 | 96.669 | 4.06 | 2,933,954 |
| 2025-26 | 100.000 | 3.45 | 3,069,799 |
Data are based on the June 2026 National Accounts figures from ONS.
Please note that these deflators do not apply to the real terms Country and Regional Analysis (CRA) tables 9.3 and 9.4 that were originally published in November 2025.
Population numbers by country and region
The population numbers used in Chapter 9 are derived from ONS’s mid-year estimates as used in the November 2025 Country and Regional Analysis release.
ONS’s most recent mid-year population estimates for the UK are directly available online.
Future development of Public Spending Statistics
The July PSS release now includes an underlying dataset containing budgeting data, which was first published alongside July PSS 2024. The development of this publication was first announced within the July 2023 PSS release, based on feedback from a user consultation. The purpose of this database is to allow users to access underlying data to align to the departmental totals within PESA chapter 1 and chapter 2 for outturn years. More information about the fields within the database is available in the ‘Metadata’ sheet.
We would be interested in readers’ views on how PSS might be developed to further increase its value to users. Please write to:
The Editor, PESA
Government Financial Reporting
Floor 2 Red Zone
HM Treasury
1 Horse Guards Road
London
SW1A 2HQ
-
The Office of Gas and Electricity Markets (OFGEM), the Water Services Regulation Authority (aka OFWAT), the Office of Rail and Road (ORR), the National Audit Office (NAO) and House of Commons: Administration. ↩
-
Social exclusion n.e.c. includes Child and Working Tax Credits. Also included here are Universal Credit additional costs that were previously scored in 10.9 Social protection n.e.c. ↩