Public spending statistics: July 2023
Published 19 July 2023

© Crown copyright 2023
This publication is licensed under the terms of the Open Government Licence v3.0 except where otherwise stated. To view this licence, visit nationalarchives.gov.uk/doc/open-government-licence/version/3 or write to the Information Policy Team, The National Archives, Kew, London TW9 4DU, or email: psi@nationalarchives.gov.uk.
Where we have identified any third party copyright information you will need to obtain permission from the copyright holders concerned.
This publication is available at https://www.gov.uk/government/statistics/public-spending-statistics-release-july-2023/public-spending-statistics-july-2023
Introduction
This National Statistics release is intended to provide comprehensive information on public spending. Data are arranged thematically by section. Each section contains overview commentary on the statistics being released, statistical tables, and further background information.
The key data being updated in this release are for the years 2018-19 to 2022-23. This release contains the first estimate of 2022-23 outturn. All data in this release are National Statistics and are on an outturn basis. Where major revisions to the data for past years have been made we refer to them in the text accompanying the tables. Further background detail is found in the accompanying background material published alongside this release.
HM Treasury Public Spending Statistics provide a range of information about public spending. Further detailed explanations are provided in the PSS guidance document. This information can be found on the main release page. The release is classified as National Statistics and conforms to the rules and principles set out in the Code of Practice for Official Statistics overseen by the United Kingdom Statistics Authority.
A user survey gathering feedback on the outturn data presented in the Public Spending Statistics (PSS) National Statistics releases was launched with the July PSS 2022. This data also fed into the PESA outturn statistics. The consultation was split into three core sections: Accessing public spending statistics, use of data, and views on the presentation of data.
The survey found that users had an interest in using both PESA and the quarterly PSS releases, as well as other related HMT products (e.g. the Country and Regional Analysis (CRA) release).
As a result of the survey, we are reviewing options to publish the underlying data for the release alongside the PSS, in a format akin to the CRA database. Future updates and more detail will be provided in the Public Spending Statistics releases.
Related releases from HM Treasury
- The PESA command paper is an annual release, containing plans data for the Spending Review period, alongside the data contained in this release.
- The quarterly public spending statistics releases update the key series found in this release.
- In 2023 and 2024, HM Treasury will publish a Covid Cost Tracker on gov.uk as official statistics. This was previously published by the NAO. It will bring together data from across the UK government. and provide estimates of the cost of measures announced in response to the COVID-19 pandemic (where this information is publicly available or has been provided to HM Treasury by government departments).
- Changes to this release have been made in response to requests from the United Kingdom Statistics Authority and feedback received from users. We welcome further user feedback at pesa@hmtreasury.gsi.gov.uk
What’s new
- Not all departments had produced their Annual Report and Accounts for 2022-23 as at publication of the July 2023 PSS. Outturn data may therefore be subject to revisions. The public spending statistics (PSS) releases, published on a quarterly basis, will reflect any later revisions made by departments to their 2022-23 outturn.
- In February 2023 the Prime Minister announced a number of Machinery of Government changes which set up three new departments: the Department for Energy Security and Net Zero (DESNZ), the Department for Science, Innovation and Technology (DSIT) and the Department for Business and Trade (DBT) .
- DESNZ took over the energy portfolio from the former Department for Business, Energy and Industrial Strategy (BEIS). DSIT brought together the relevant functions from BEIS as well as the digital portfolio of the former Department for Digital, Culture, Media and Sport, which is now the Department for Culture, Media and Sport (DCMS). DBT combined the business focused functions of BEIS with the former Department for International Trade (DIT). In addition, responsibility for National Security and Investment policy was transferred from BEIS to the Cabinet Office.
- Data in the PSS reflect these changes. Note, however, that figures are still based on provisional calculations to assign expenditure by the former BEIS to the new departments. They are likely to be revised once departments have published their audited 2022-23 Annual Reports and Accounts and have been able to reassess the historical data. These changes will be incorporated into future Public Spending Statistics publications and in the 2023-24 Annual Reports and Accounts where required.
- Since PSS July 2022 NHS Provider depreciation has been moved out of the Resource DEL excluding depreciation ringfence. It remains part of total Resource DEL.
- Figures in 2020-21 and 2021-22 were heavily impacted by Covid spend, therefore time series of comparisons with 2022-23 need to be taken in context of this spend.
Departmental budgets
The tables for departmental budgets in chapter 1 bring together information on public expenditure within the current budgeting and control framework. This comprises departmental budgets, including all control totals, as well as reconciling from the budgetary framework to the fiscal aggregates in the National Accounts.
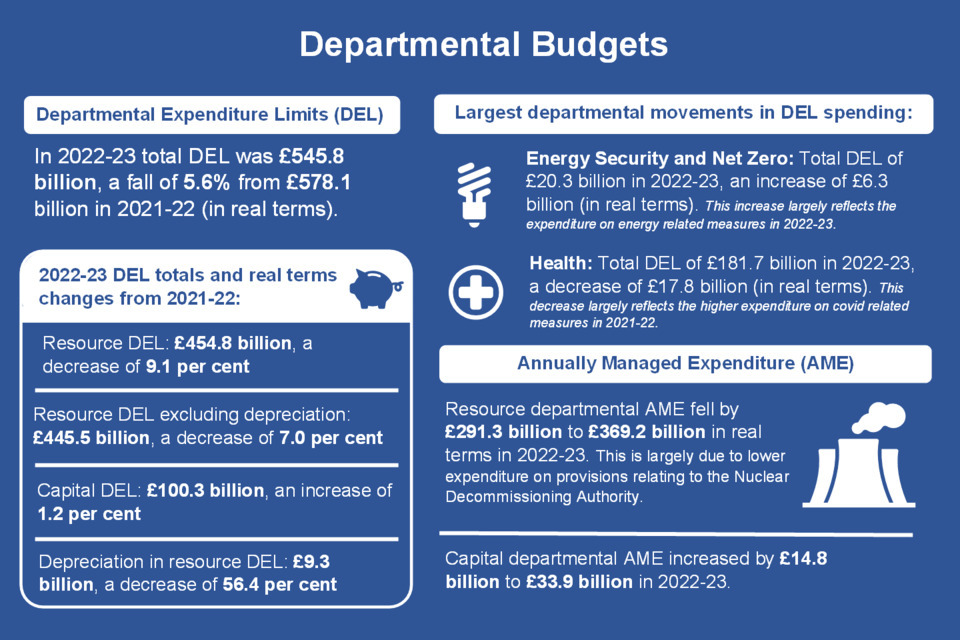
DEL expenditure in real terms (billions)
| Expenditure | 2021-22 | 2022-23 |
|---|---|---|
| Resource DEL | 500.4 | 454.8 |
| Depreciation | 21.4 | 9.3 |
| Capital DEL | 99.1 | 100.3 |
| Total DEL | 578.1 | 545.8 |
Total DEL is given by resource DEL excluding depreciation plus capital DEL.
Departmental expenditure limits (DEL)
- Total resource DEL was £454.8 billion in 2022-23, a decrease of 9.1 per cent in real terms on the previous year.
- Total resource DEL (RDEL) excluding depreciation was £445.5 billion in 2022-23, a decrease of 7.0 per cent in real terms on the previous year.
- Depreciation in resource DEL was £9.3 billion in 2022-23, a decrease of 56.4 per cent in real terms on 2021-22.
- Total capital DEL was £100.3 billion in 2022-23, an increase of 1.2 per cent in real terms on the previous year.
- Total DEL in real terms decreased by 5.6 per cent in 2022-23 from £578.1 billion in 2021-22 to £545.8 billion. The largest decrease in DEL spending in real terms in 2022-23 was for Health and Social Care which was down by £17.8 billion to £181.7 billion. This decrease reflects the higher expenditure related to Covid-19 measures in 2021-22.
Total Departmental Expenditure Limits, 2022-23 (£millions)
For the full table, including years from 2018-19 onward, please refer to Table 1.10 in the accompanying Chapter 1 tables ODS file.
| Departmental Group | Total DEL |
|---|---|
| Health and Social Care | 181,693 |
| Education | 81,774 |
| Home Office | 17,911 |
| Justice | 10,677 |
| Law Officers’ Departments | 771 |
| Defence | 52,797 |
| Single Intelligence Account | 3,796 |
| Foreign, Commonwealth and Development Office | 9,310 |
| DLUHC - Local Government | 11,772 |
| DLUHC - Housing and Communities | 10,835 |
| Culture, Media and Sport | 2,269 |
| Science, Innovation and Technology | 10,620 |
| Transport | 28,995 |
| Energy Security and Net Zero | 20,328 |
| Environment, Food and Rural Affairs | 5,977 |
| Business and Trade | 1,470 |
| Work and Pensions | 8,581 |
| HM Revenue and Customs | 6,407 |
| HM Treasury | 305 |
| Cabinet Office | 1,129 |
| Scotland | 42,028 |
| Wales | 18,158 |
| Northern Ireland | 15,631 |
| Small and Independent Bodies | 2,591 |
Data for these departments reflect the Machinery of Government changes announced in 2023 (See ‘What’s new’ section above). Figures are provisional and are likely to be revised.
Annually Managed Expenditure (AME)
- Resource departmental AME decreased by £291.3 billion to £369.2 billion in real terms in 2022-23. This is largely due to lower expenditure on provisions relating to the Nuclear Decommissioning Authority.
- Capital departmental AME increased by £14.8 billion to £33.9 billion in 2022-23.
Departmental AME expenditure in real terms (billions)
| Expenditure | 2021-22 | 2022-23 |
|---|---|---|
| Resource departmental AME | 660.5 | 369.2 |
| Capital departmental AME | 19.1 | 33.9 |
| Total departmental AME | 679.6 | 403.1 |
Economic analysis of budgets
The tables in chapter 2 of Public Spending Statistics present an analysis by economic category of the budgeting aggregates shown in chapter 1. A description of the economic categories referred to below can be found in the main chapter text of PESA.
Resource DEL
- Total resource DEL was £454.8 billion in 2022-23, compared to £469.6 billion in 2021-22, in nominal terms.
- Staff costs increased by 6.4 per cent in 2022-23 (to £161.5 billion) and gross current procurement rose by 3.6 per cent (to £159.0 billion). A breakdown of gross current procurement by individual departments is shown in table 2.2.
- Expenditure on grants to local government totalled £74.7 billion and subsidies to private sector companies totalled £3.0 billion in 2022-23, a decrease of 13.4 percent and 55.6 per cent, respectively. The large fall in subsidies reflects higher covid related spend in 2021-22 compared to 2022-23. The financing of local government expenditure is examined in more detail in chapter 7.
- Spending on administration, composed mainly of pay and procurement, stood at £12.3 billion in 2022-23. This is a rise of 5.5 per cent from the previous year.
Resource AME
- Resource departmental AME decreased by £250.7 billion to £369.2 billion in 2022-23 in nominal terms. The largest component of spending within resource AME is made up of grants to persons and non-profit bodies, which is mainly social security benefits. Expenditure on this heading rose by 16.1 per cent to £275.3 billion in 2022-23 from £237.1 billion in the previous year.
- In table 2.1 for resource departmental AME, take up of provisions showed the largest decrease in 2022-23 of 200.8 per cent, with a total of -£180.2 billion down from £178.8 billion the previous year. This reflects a reduction in provisions by Energy Security and Net Zero on Nuclear Decommissioning.
- Depreciation increased to £136.7 billion from £57.2 billion in 2021-22. This reflects, in part, changes in the fair value of the Bank of England Asset Purchase Facility Fund (APF) within HM Treasury’s budget.
Capital budgets
- Capital spending within budgets was £134.2 billion in 2022-23, an increase of 20.9 per cent on the previous year. The majority of capital spending occurred within DEL.
- Within capital budgets, gross capital procurement increased by £10.4 billion and capital support for local government decreased by £0.5 billion in 2022-23. These are broken down by department in Tables 2.3 and 7.3 respectively.
- Capital grants to private sector companies increased by £5.2 billion in 2022-23. Net lending and investment to the private sector and abroad increased by £2.6 billion to £27.5 billion in 2022-23.
Trends in public spending
The tables in chapter 4 show trends in public spending on a longer run basis than other chapters in this release, in nominal, real (inflation-adjusted) and percentage of GDP terms.
Table 4.1 shows long run trends in Total Managed Expenditure (TME) and its Public Sector Current Expenditure (PSCE) and Public Sector Net Investment (PSNI) components back to 1981-82.
Tables 4.2 to 4.4 show total expenditure on services split by high level spending function (health, education, social protection, etc.) back to 1999-00.
Trends in TME, PSCE and PSNI (Table 4.1)
- During 2022-23, Total Managed Expenditure has increased in nominal terms by £113.5 billion (10.9 per cent), and also in real (inflation-adjusted) terms by £45.2 billion (4.1 per cent).
- TME as a percentage of GDP, which shows the size of the public sector relative to the size of the whole economy, was 45.6 per cent in 2022-23. This has risen from 44.5 per cent in 2021-22.
Trends in functional expenditure (Table 4.2 to 4.4)
- In real terms, spending in six of the ten functions (excluding EU transactions) increased whilst spending in four functions fell during 2022-23.
- The largest real terms percentage increases were in ‘General public services’ (38.4 per cent), mainly as a result of an increase in public sector debt interest, and in ‘Economic affairs’ (19.3 per cent), mainly as a result of an increase in ‘enterprise and economic development’.
- The largest real terms decreases in spending were in ‘Health’ (-8.2 per cent), reflecting the higher expenditure in 2021-22 for Covid-19 related measures, and in ‘Environment protection’ (-5.3 per cent).
- For greater detail see Table 5.2, which shows a breakdown of public spending at the sub-functional level.
Chart 1: Trends in public spending since 1999-00
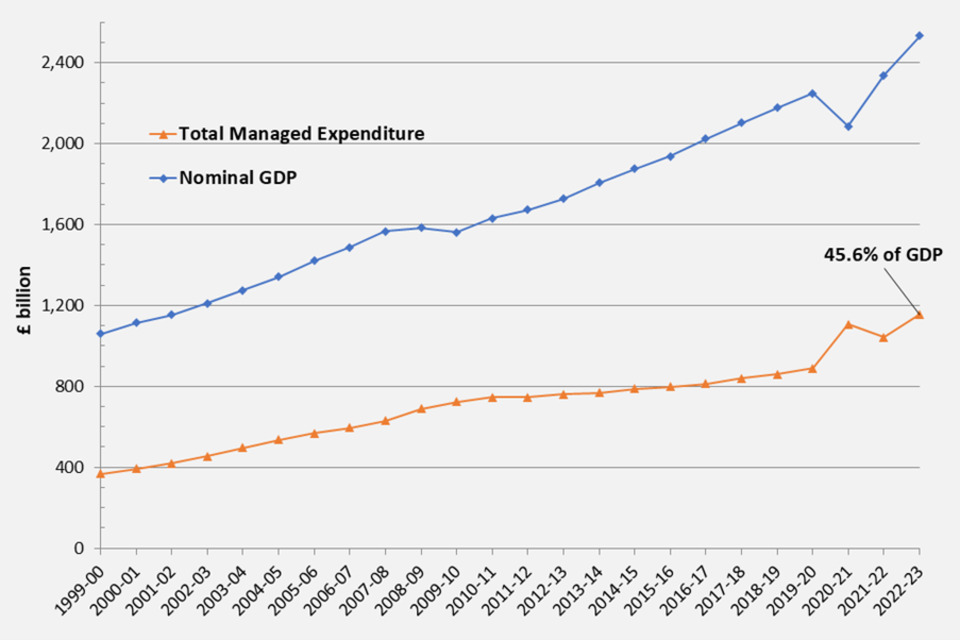
Chart 2: Real terms trends in Public Spending

From 2011-12 onwards the ‘grant-equivalent element of student loans’ is no longer part of the TES framework and has therefore been removed from the Education function. Therefore figures are not directly comparable between 2010-11 and 2011-12. A full explanation of this decision can be found in PESA 2016 Annex E.
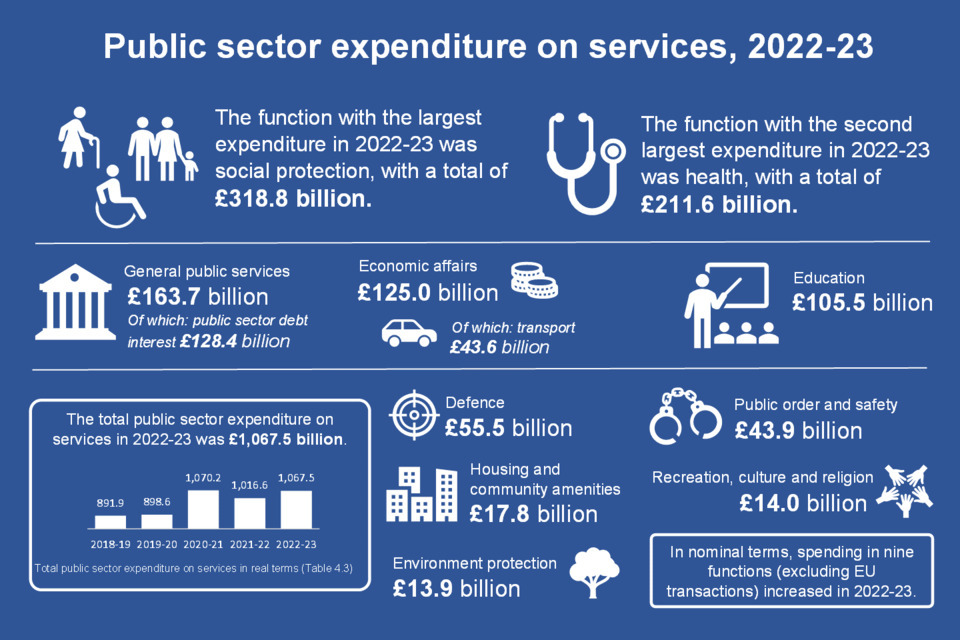
Public sector spending by function, sub-function and economic category
- The tables in chapter 5 of this release present analysis of total public sector expenditure on services split by function, sub-function and economic category.
- Year on year changes on a functional basis as described below are derived from tables 4.2 or 5.4, whilst sub-functional changes year on year are derived from table 5.2.
- These presentations are more stable between years than presentations of data by government department on a budgeting basis (Chapters 1 and 2) because they are not affected by changes in the structure of Government over time.
Functional tables
- In nominal terms, spending in nine of the ten functions (excluding EU transactions) increased in 2022-23.
- The largest increases in percentage terms were in ‘General public services’ (47.5 per cent), ‘Economic affairs’ (27.1 per cent), and ‘Housing and community amenities’ (16.9 per cent). The one functional decrease in percentages terms was in ‘Health’ (-2.2 per cent).
Sub-functional tables
- The largest nominal spending increase by function in 2022-23 was in ‘General public services’, which rose by £52.7 billion to a total of £163.7 billion (an increase of 47.5 per cent). This was largely driven by an increase of £53.9 billion in ‘Public debt transactions’, of which ‘Central government debt interest’ increased by £34.3 billion.
- ‘Economic affairs’ saw the second largest nominal increase in 2022-23 of £26.7 billion. Within this, ‘Fuel and energy’ rose by £39.4 billion while ‘General economic, commercial and labour affairs’ fell by £12.5 billion.
- ‘Social protection’ saw the third largest nominal increase in 2022-23 of £18.7 billion (an increase of 6.2 per cent), of which ‘pensions’ rose by £8.1 billion.
Central government own expenditure
The tables in chapter 6 of Public Spending Statistics (PSS) present analyses of central government own expenditure. This is spending by government departments and other central government bodies on their own activities. Central government support for local government and capital support for public corporations is not included.
- Tables 6.1 to 6.3 show central government expenditure on a budgeting basis, consistent with the data shown in chapters 1 and 2.
- Tables 6.4 to 6.6 show expenditure on services, consistent with chapters 4 and 5.
Expenditure in budgets
- Central government own expenditure within DEL stood at £414.6 billion in 2022-23, up 3.6 per cent on the total of £400.1 billion in 2021-22.
- Expenditure within AME decreased to £389.5 billion in 2022-23 from £632.9 billion in 2021-22. The decrease in AME is largely due to reductions in the take up of provisions by DHSC and DESNZ.
Expenditure on services
- Central government’s own current expenditure on services rose to £784.1 billion in 2022-23, from £713.1 billion the previous year. Capital expenditure on services increased from £66.2 billion in 2021-22 to £85.2 billion in 2022-23.
- As shown in Table 6.4, ‘Social protection’ and ‘Health’ together account for more than half of all of central government own expenditure on services. In 2022-23 spending on social protection increased to £261.9 billion compared to £243.4 billion in the previous year.
- Expenditure on ‘Central government debt interest’ increased from £72.5 billion in 2021-22 to £106.8 billion in 2022-23, an increase of 47.3 per cent.
- Expenditure on ‘Current grants to persons and non-profit bodies’, which is mainly composed of social benefits, rose from £262.9 billion in 2021-22 to £307.1 billion in 2022-23.
- Expenditure on ‘Subsidies to private sector companies’ fell by £13.7 billion to £24.1 billion in 2022-23.. This was driven by expenditure on Covid-19 related measures in the previous year.
Local government financing and expenditure
Chapter 7 analyses central government support for local government within budgets (tables 7.1 to 7.3) and local government expenditure on services (tables 7.4 to 7.8). It deals primarily with Great Britain, as most equivalent spending in Northern Ireland is central government spending carried out by Northern Ireland departments.
Central government support for Local government
- Total central government support in DEL was £86.0 billion in 2022-23, down from £98.2 billion the year before. Support in AME rose from £38.1 billion to £39.2 billion over the same period.
- Capital support for local government fell slightly from £13.0 billion in 2021-22 to £12.5 billion in 2022-23.
Local government expenditure on services
- Total local government current expenditure on services was £146.9 billion in 2022-23, up from £145.8 billion in 2021-22. Over the same period total local government capital expenditure on services rose to £21.8 billion from £20.3 billion.
- As shown in table 7.4, local government current expenditure on ‘Education’ showed an increase from £44.8 billion in 2021-22 to £46.1 billion in 2022-23.
- Local government current expenditure rose in 2022-23 for five of the ten functions. The increases were seen in ‘Education’ (up £1.3 billion), ‘Public order and safety’ (up £1.0 billion), ‘Environment protection’ (up £0.4 billion), ‘Social protection’ and ‘Housing and community amenities’ (both up £0.2 billion) over the same period.
- A breakdown of local government expenditure by economic category is shown in table 7.8. Spending on pay, which amounted to £70.9 billion in 2022-23, accounts for over 42 per cent of all spending on services by local government.
Public corporations
Chapter 8 analyses the impact of public corporations on departmental budgets and expenditure on services.
Tables 8.1 and 8.2 examine the impact on departmental budgets (DEL and departmental AME), breaking this down by economic category and departmental group.
Tables 8.3 to 8.5 analyse capital spending by public corporations. They break the expenditure down by individual public corporations as well as by function and economic category. Debt interest payments to the private sector, which is the only public corporation current spending that forms part of Total Managed Expenditure (TME), is also included.
- Public corporations’ capital expenditure was £12.7 billion in 2022-23, up from £6.5 billion the year before.
- Out of this total, expenditure by the Housing Revenue Account (for England, Scotland and Wales) was £6.3 billion, up from £5.3 billion the previous year.
- The other main contributors to public corporations’ capital expenditure were London Underground (as Transport Trading Limited) and Scottish Water.
Public expenditure by country and additional information
Country and regional analysis in this release
The Country and Regional Analysis (CRA) is published each autumn. As a result there are no new substantive data on regional spending for this PSS release. However, the four headline tables of the CRA release published in November 2022 have been included in chapter 9.
Revisions in this release
All of the data contained in the Public Spending National Statistics are open for revision in every publication. The table below summarises the key revisions in this release.
| Revisions to Budgets since July 2022 (£million) | 2018-19 | 2019-20 | 2020-21 | 2021-22 |
|---|---|---|---|---|
| Total Managed Expenditure | 1,055 | 4,531 | 2,430 | -18,836 |
| Total Departmental Expenditure Limits (DEL) | -1,901 | -2,401 | -2,342 | -2,226 |
| Departmental Annually Managed Expenditure (AME) | -232 | 1,255 | 4,747 | -2,974 |
| Other AME | 3,187 | 5,317 | 25 | -13,636 |
| Total resource DEL | 4 | 2 | -1 | -2,331 |
| Total capital DEL | 0 | 0 | 0 | -9 |
Figures for Total Managed Expenditure (TME) are taken from the ONS/HM Treasury Public Sector Finances release. The main revisions since last July’s publication are:
- Changes to TME and other AME in all years are due to updated ONS data. More information about these changes is available in the monthly ONS public sector finances (PSF) release.
- Since PESA 2022 NHS Provider depreciation has been moved out of the Resource DEL excluding depreciation ringfence, causing a majority of the revisions to Total DEL shown above. It remains part of total Resource DEL.
- Local government expenditure has also been revised.
GDP deflators and population numbers
GDP deflators
A number of the tables in this publication give figures in real terms. Real terms figures are the current price outturns or plans adjusted to a constant price level by excluding the effect of general inflation as measured by the GDP deflator at market prices. The real terms figures in this publication are given in 2022-23 prices. The GDP deflators used in this publication are those given below. The most up to date deflators can be found on the GOV.UK website.
| Financial year | GDP deflator at market prices | Per cent change on previous year | Money GDP (£million) |
|---|---|---|---|
| 1981-82 | 26.182 | 10.84 | 298,340 |
| 1982-83 | 28.172 | 7.60 | 327,518 |
| 1983-84 | 29.621 | 5.14 | 358,116 |
| 1984-85 | 31.403 | 6.01 | 386,018 |
| 1985-86 | 33.270 | 5.95 | 423,777 |
| 1986-87 | 34.848 | 4.74 | 455,595 |
| 1987-88 | 36.871 | 5.80 | 511,862 |
| 1988-89 | 39.499 | 7.13 | 570,572 |
| 1989-90 | 42.756 | 8.25 | 630,291 |
| 1990-91 | 46.384 | 8.49 | 679,960 |
| 1991-92 | 49.285 | 6.25 | 716,107 |
| 1992-93 | 50.782 | 3.04 | 738,364 |
| 1993-94 | 52.249 | 2.89 | 782,760 |
| 1994-95 | 53.129 | 1.68 | 821,496 |
| 1995-96 | 55.002 | 3.52 | 866,221 |
| 1996-97 | 57.280 | 4.14 | 924,548 |
| 1997-98 | 57.324 | 0.08 | 965,482 |
| 1998-99 | 58.336 | 1.77 | 1,010,722 |
| 1999-00 | 59.071 | 1.26 | 1,058,494 |
| 2000-01 | 59.812 | 1.26 | 1,114,341 |
| 2001-02 | 61.042 | 2.05 | 1,152,999 |
| 2002-03 | 62.438 | 2.29 | 1,209,047 |
| 2003-04 | 63.960 | 2.44 | 1,275,294 |
| 2004-05 | 65.896 | 3.03 | 1,342,278 |
| 2005-06 | 67.713 | 2.76 | 1,420,970 |
| 2006-07 | 69.740 | 2.99 | 1,487,963 |
| 2007-08 | 71.388 | 2.36 | 1,567,027 |
| 2008-09 | 73.967 | 3.61 | 1,583,394 |
| 2009-10 | 74.956 | 1.34 | 1,561,331 |
| 2010-11 | 76.207 | 1.67 | 1,630,474 |
| 2011-12 | 77.557 | 1.77 | 1,671,352 |
| 2012-13 | 78.901 | 1.73 | 1,726,983 |
| 2013-14 | 80.542 | 2.08 | 1,806,096 |
| 2014-15 | 81.428 | 1.10 | 1,875,897 |
| 2015-16 | 82.077 | 0.80 | 1,937,570 |
| 2016-17 | 83.762 | 2.05 | 2,022,931 |
| 2017-18 | 85.159 | 1.67 | 2,102,925 |
| 2018-19 | 86.680 | 1.79 | 2,177,222 |
| 2019-20 | 88.934 | 2.60 | 2,249,423 |
| 2020-21 | 94.507 | 6.27 | 2,085,204 |
| 2021-22 | 93.852 | -0.69 | 2,337,907 |
| 2022-23 | 100.000 | 6.55 | 2,531,870 |
Data are based on the June 2023 National Accounts figures from ONS.
Please note that these deflators do not apply to the real terms Country and Regional Analysis (CRA) tables 9.3 and 9.4 that were originally published in November 2022.
Population numbers by country and region
The population numbers used in Chapter 9 are derived from ONS’s mid-year estimates as used in the November 2022 Country and Regional Analysis release.
ONS’s most recent mid-year population estimates for the UK are directly available online.
Future development of Public Spending Statistics
We would be interested in readers’ views on how PSS might be developed to further increase its value to users. Please write to:
The Editor, PESA
Government Financial Reporting
Floor 2 Red Zone
HM Treasury
1 Horse Guards Road
London
SW1A 2HQ