Public Health Outcomes Framework: statistical commentary, May 2020
Published 5 May 2020

© Crown copyright 2020
This publication is licensed under the terms of the Open Government Licence v3.0 except where otherwise stated. To view this licence, visit nationalarchives.gov.uk/doc/open-government-licence/version/3 or write to the Information Policy Team, The National Archives, Kew, London TW9 4DU, or email: psi@nationalarchives.gov.uk.
Where we have identified any third party copyright information you will need to obtain permission from the copyright holders concerned.
This publication is available at https://www.gov.uk/government/statistics/public-health-outcomes-framework-may-2020-data-update/public-health-outcomes-framework-statistical-commentary-may-2020
Public Health Outcomes Framework statistical summary May 2020
1. New in this update
The latest update includes data for 26 indicators, of which 9 are new to the public domain and 2 are new to the framework:
- B13b - Re-offending levels - average number of re-offences per re-offender
- D04g - Population vaccination coverage - Meningococcal ACWY conjugate vaccine (MenACWY) (14-15 years)
This summary provides the main messages from indicators updated with data new to the public domain. For a complete list of indicators that have been updated please see Public Health Outcomes Framework: indicator updates.
2. Summary of selected updated indicators
2.1 Complaints about noise (indicator B14a)
The government’s policy on noise is set out in the Noise Policy Statement for England[footnote 1]. The long-term vision is to:
“Promote good health and a good quality of life through the effective management of noise within the context of Government policy on sustainable development.”
Data for this indicator is collected by the Chartered Institute of Environmental Health (CIEH) based on voluntary submissions from local authorities. Public Health England models the data for those local authorities that did not provide a submission, based on reporting in previous years. Updates for this indicator have been unavailable for several years due to the CIEH temporarily pausing their annual data collation.
The crude rate of complaints about noise in England was 6.8 per 1,000 population in 2018 to 2019. Noise complaints are significantly higher in London compared with other regions across England. The value for London was 17.0 per 1,000 population, the next highest region was Yorkshire and the Humber at 6.4 per 1,000 (figure 1).
Figure 1: Crude rate of complaints about noise in England by region, 2018 to 2019
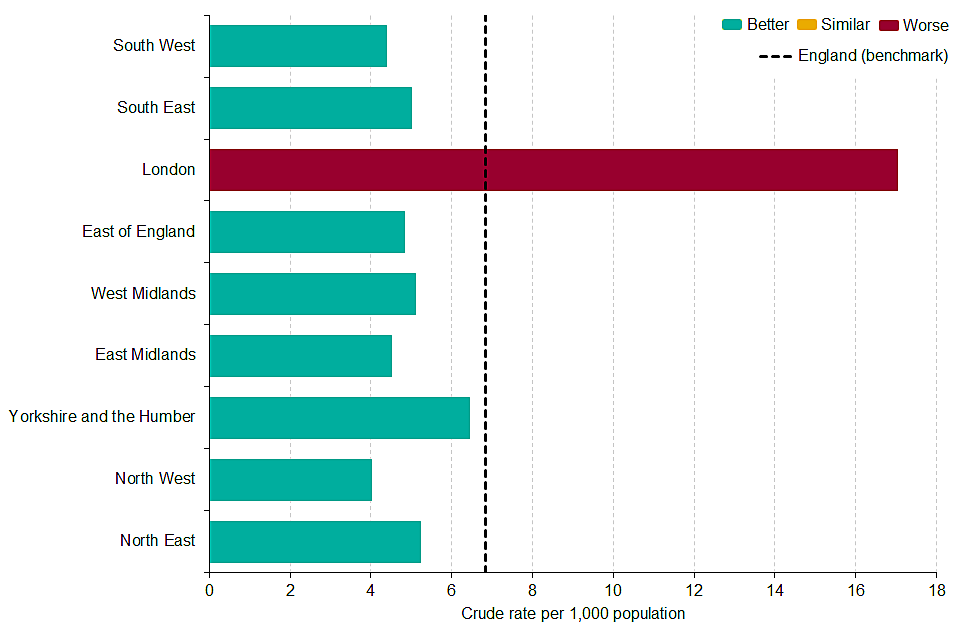
Figure 1: Crude rate of complaints about noise in England by region, 2018 to 2019
This indicator should not be used as a definitive measure of the total number of noise complaints within a local authority boundary, both because of incomplete data, but also because noise complaints can be made to different authorities, for example housing associations, railway operators and airports.
2.2 The proportion of overweight or obese adults (indicator C16)
This update shows that the percentage of adults aged 18 and over classified as overweight or obese (a body mass index of 25 kilograms per metre squared or greater) increased slightly, but not significantly, to 62.3% in 2018 to 2019, up from 62.0% in 2017 to 2018. Excess weight is a leading cause of type 2 diabetes, heart disease and cancer and reducing obesity is a PHE priority.
In each of the four time points for which the PHOF has comparable data, the percentage has consistently been higher for men than women (figure 2).
There is also a clear trend across socio-economic groups. Communities with higher levels of deprivation have higher proportions of adults who are classified as overweight or obese.
Figure 2: Trend in percentage of adults aged 18 and over classified as overweight or obese in England, by sex
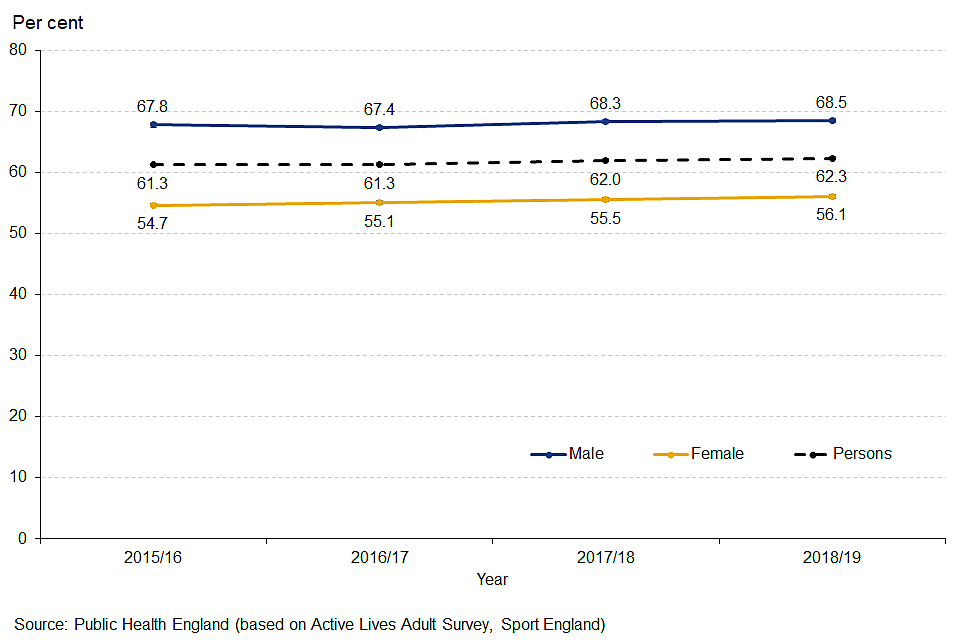
Figure 2: Trend in percentage of adults aged 18 and over classified as overweight or obese in England, by sex
2.3 Physical activity in adults (indicators C17a and C17b)
Regular physical activity can help to prevent and manage a range of chronic conditions and diseases. In adults, there is strong evidence to demonstrate the protective effect of physical activity on a range of many chronic conditions including coronary heart disease, obesity and type 2 diabetes, mental health problems and social isolation[footnote 2].
Physical inactivity is defined as engaging in less than 30 minutes of moderate intensity physical activity a week. In 2018 to 2019 the percentage of physically inactive adults decreased to 21.4%, down from 22.2% in 2017 to 2018. In 2018 to 2019, estimates of physically inactive adults among local authority districts and unitary authorities in England ranged from 10.8% to 43.0%.
In 2018 to 2019 the percentage of physically active adults (those completing at least 150 minutes of moderate intensity physical activity a week) increased from 66.3% in 2017 to 2018 to 67.2%. In 2018 to 2019, estimates of physically active adults among local authority districts and unitary authorities in England ranged from 46.7% to 82.0%.
Levels of physical activity in adults continued to vary across socio-economic groups with those in less deprived areas, in employment or in managerial and professional occupations more likely to report being physically active and less likely to report being physically inactive.
Figure 3: Percentage of physically active adults, by age and year
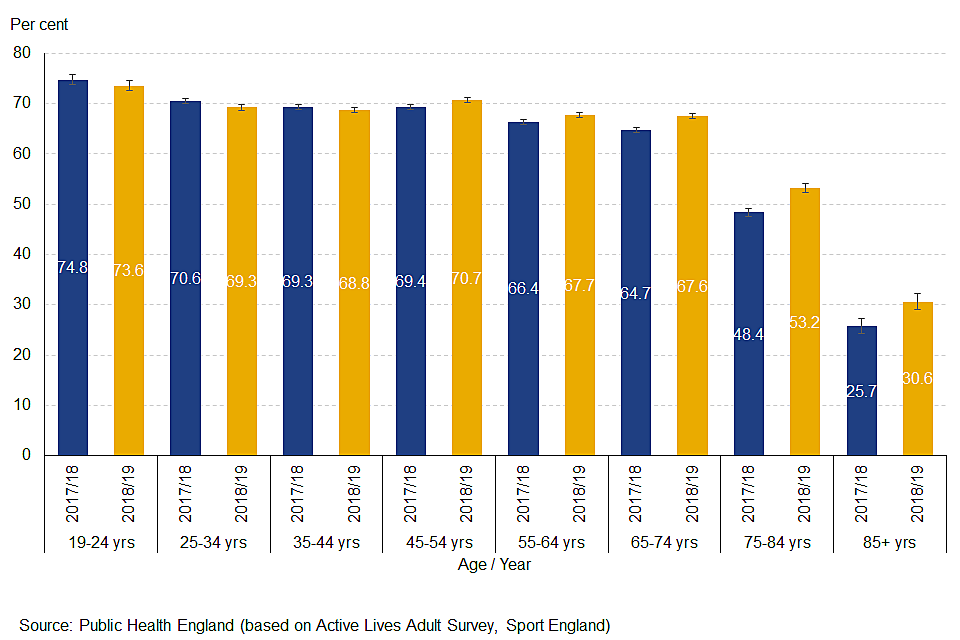
Figure 3: Percentage of physically active adults, by age and year !!3
The increased physical activity levels were largely driven by increases for older adults aged 55 and over (figure 3) and people with disabilities or long-term health conditions (figure 4).
Figure 4: Trend in percentage of physically active adults, by disability status
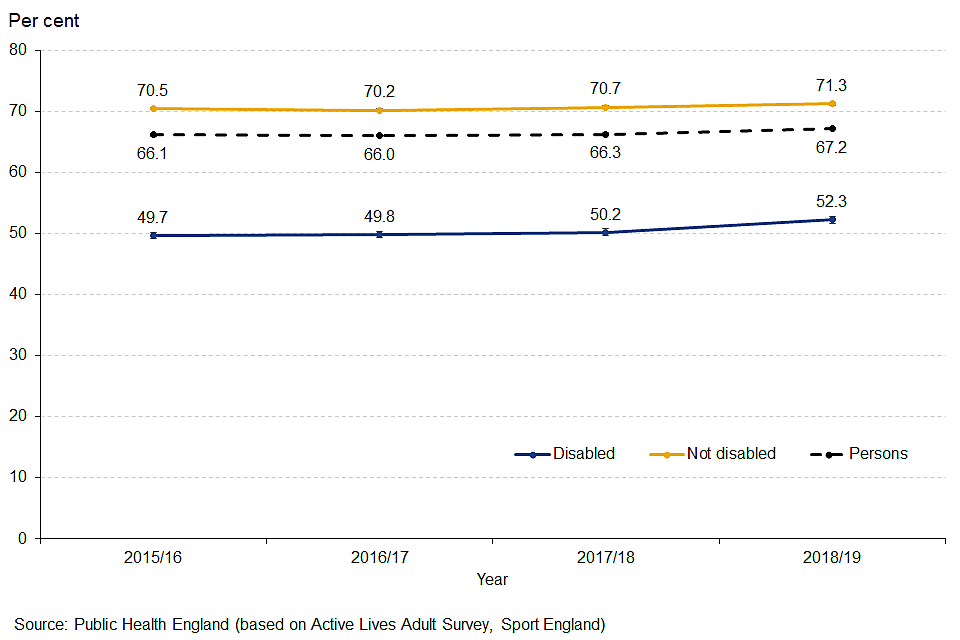
Figure 4: Trend in percentage of physically active adults, by disability status
2.4 Preventable sight loss (indicators E12a, E12b, E12c and E12d)
These indicators are included in the framework to ensure that avoidable sight loss is recognised as a critical and modifiable public health issue. Prevention of sight loss will help people maintain independent lives as far as possible and reduce the need for social care support, which would be necessary if sight was lost permanently.
Certifications of visual impairment (CVI) for these indicators are provided by the certifications office of Moorfields Eye Hospital, who are contracted by Department of Health and Social Care and the Royal College of Ophthalmologists to be responsible for certifications. Preventable sight loss is measured by four indicators that cover sight loss certifications from all causes (preventable and non-preventable) and the three most common causes of preventable sight loss:
- age-related macular degeneration (ages 65 and over)
- glaucoma (ages 40 and over)
- diabetic eye disease (ages 12 and over)
The latest data are for 2018 to 2019, measured as a crude rate of new certifications per 100,000 population. The rate shows an increase compared with the previous time period for both sight loss due to age related macular degeneration (AMD) and the overall rate of new sight loss certifications (which includes both preventable and non-preventable causes of sight loss). Sight loss due to glaucoma and diabetic eye disease did not change significantly.
In England in 2018 to 2019 there were:
- 11,427 new CVIs due to AMD, which was a rate of 112.3 per 100,000 population aged 65 and over
- 3,696 CVIs due to glaucoma, which was a rate of 13.2 per 100,000 population aged 40 and over
- 1,481 CVIs due to diabetic eye disease, which was a rate of 3.1 per 100,000 population aged 12 and over
- 24,284 new sight loss certifications, which was a rate of 43.4 per 100,000 population
Figure 5: Trend in sight loss certifications in England, by cause of certification of visual impairment
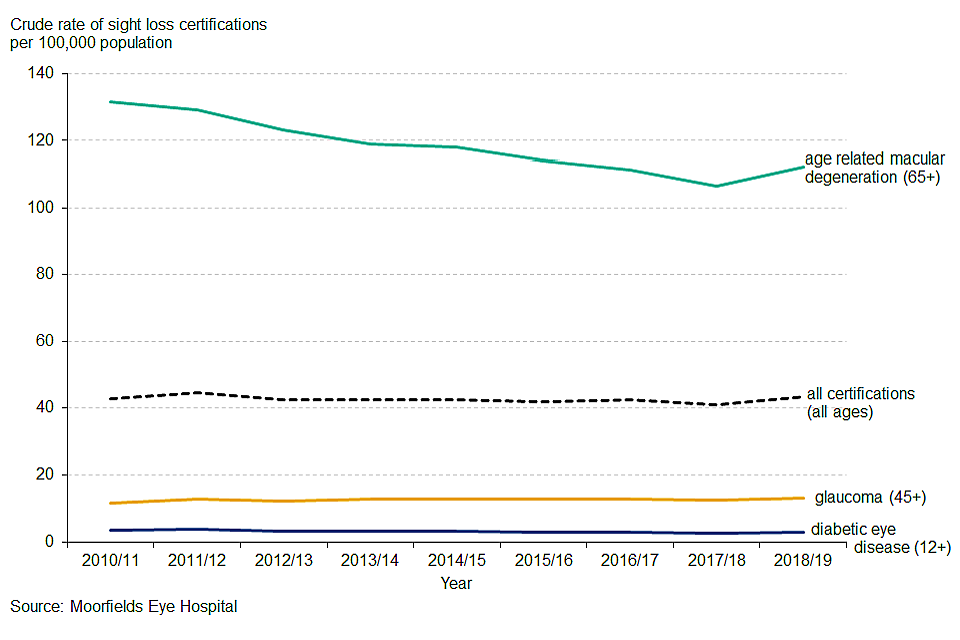
Figure 5: Trend in sight loss certifications in England, by cause of certification of visual impairment
Recent trend analysis based on the five most recent time points, shows that the rate of people with AMD has significantly decreased, for the other 3 indicators there has been no significant change (figure 5). It should be noted that sight loss certification is voluntary so true rates may be higher than this analysis shows.
Figure 6: Sight loss certifications by deprivation decile in England 2018 to 2019
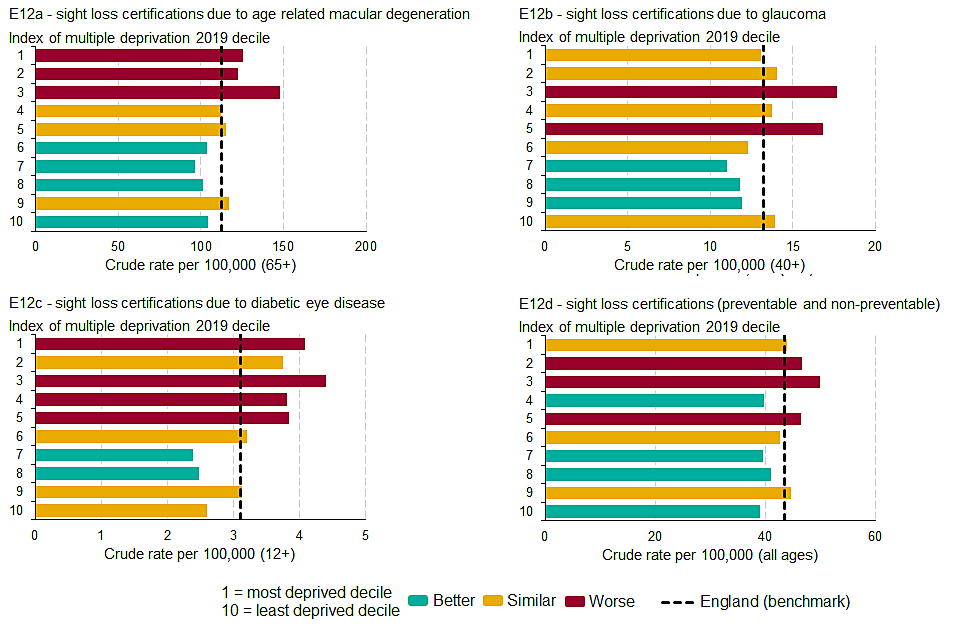
Figure 6: Sight loss certifications by deprivation decile in England 2018 to 2019
Index of multiple deprivation (IMD) 2019 deciles for county and unitary authority areas have been calculated for the latest data. These show that rates tend to be higher among people living in the more deprived areas compared with those living in the less deprived areas (figure 6).
3. Background and further information
The Public Health Outcomes Framework sets out a high-level overview of public health outcomes, at national and local level, supported by a broad set of indicators. An interactive web tool makes the PHOF data available publicly. This allows local authorities to assess progress in comparison to national averages and their peers, and develop their work plans accordingly.
View the Public Health Outcomes Framework
Responsible statistician, product lead: James Westwood. For queries relating to this publication contact PHOF.Enquiries@phe.gov.uk
The next planned update is August 2020.
4. References
-
Noise policy statement for England. Available at: https://www.gov.uk/government/publications/noise-policy-statement-for-england last accessed 24/04/2020 ↩
-
Physical activity guidelines: UK Chief Medical Officers’ report. Available at: https://www.gov.uk/government/publications/physical-activity-guidelines-uk-chief-medical-officers-report last accessed 27/04/2020 ↩