Provisional entries for GCSE, AS and A level: summer 2021 exam series
Published 27 May 2021
Applies to England

© Crown copyright 2021
This publication is licensed under the terms of the Open Government Licence v3.0 except where otherwise stated. To view this licence, visit nationalarchives.gov.uk/doc/open-government-licence/version/3 or write to the Information Policy Team, The National Archives, Kew, London TW9 4DU, or email: psi@nationalarchives.gov.uk.
Where we have identified any third party copyright information you will need to obtain permission from the copyright holders concerned.
This publication is available at https://www.gov.uk/government/statistics/provisional-entries-for-gcse-as-and-a-level-summer-2021-exam-series/provisional-entries-for-gcse-as-and-a-level-summer-2021-exam-series
1. Summer 2021 series
This report presents provisional figures for the number of entries for GCSEs, AS and A levels submitted by schools and colleges in England to exam boards by 28 April 2021 for qualifications which are to be awarded in summer 2021.
Entries reflect the information submitted to exam boards at that time but numbers for final entries are always expected to vary to some degree.
2. Main trends
The main trends in provisional entries for GCSE and GCE (AS and A level) for the summer 2021 series are:
- Overall, GCSE entries remain stable (approximately 5.3m) this year (increasing by 0.4%), though an increase in entries from year 11 students masks decreases in entries from candidates in other year groups.
- There are small increases in the proportion of entries for the higher tier in most tiered GCSEs.
- A level entries for the summer 2021 increased by 3% (756,230 in 2021 compared to 731,855 in 2020) overall.
- The overall entry for AS in summer 2021 decreased by 33% (58,300 in 2021 compared to 86,970 in 2020).
3. GCSE entries
The overall entries for GCSEs in summer 2021 remain stable: 5,301,075 entries in 2021 compared to 5,281,745 in 2020 (a difference of 0.4%).
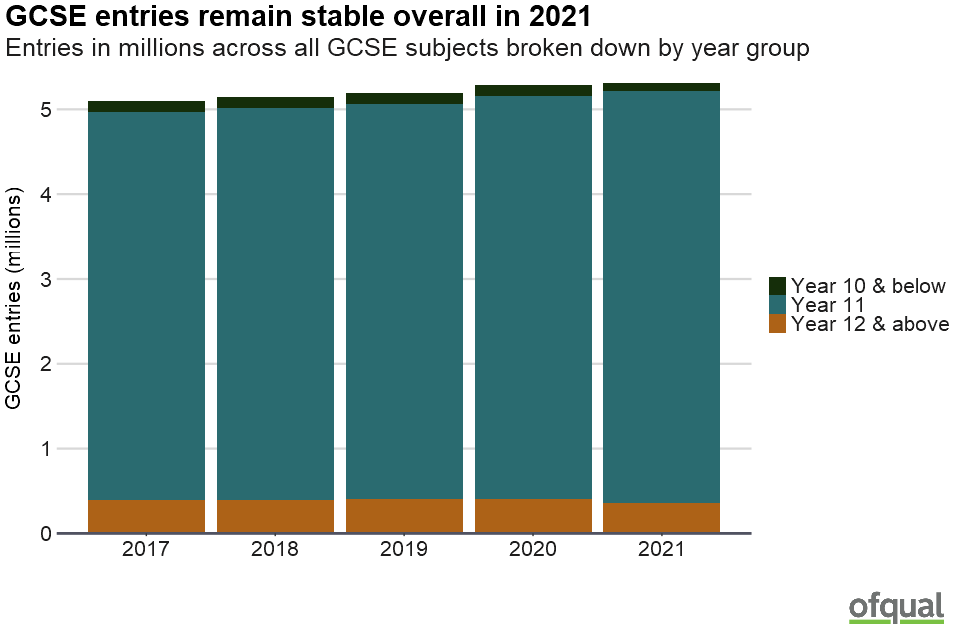
A bar chart showing the entries in millions across all GCSE subjects broken down by year group. GCSE entries remain stable overall in 2021. Further details are listed under the heading "GCSE entries".
| Year | Year 10 & below | Year 11 | Year 12 & above | Total |
|---|---|---|---|---|
| 2017 | 134,300 | 4,573,175 | 390,550 | 5,098,020 |
| 2018 | 123,350 | 4,619,275 | 393,870 | 5,136,495 |
| 2019 | 127,240 | 4,657,115 | 401,480 | 5,185,840 |
| 2020 | 124,310 | 4,756,135 | 401,300 | 5,281,745 |
| 2021 | 95,580 | 4,847,140 | 358,350 | 5,301,075 |
The majority of GCSE entries are from year 11 students as in other years. Entries from year 11 students are higher than at any time in the past five years. This is likely to be partly explained by a small increase in the size of the 16 year old cohort, which increased by 2% in 2021 compared to 2020 according to ONS population estimates (634,043 compared to 624,590). The increased number of entries from year 11 is offset by decreases in the number of entries from younger and older candidates resulting in a very similar overall entry to 2020.
The small change in entries for GCSE (an increase of 0.4% overall) was mostly due to a rise in entries for EBacc subjects. Entries for EBacc subjects increased by 40,580 (1%) and entries for non-EBacc subjects decreased by 21,255 (-2%) compared to 2020, continuing a trend seen in previous years.
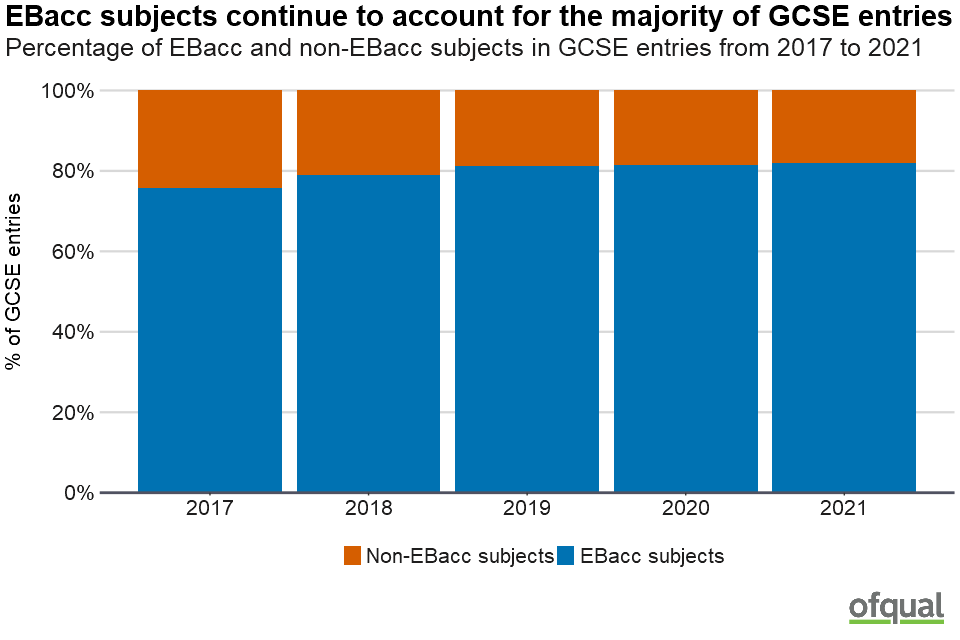
A bar chart showing the percentage of EBacc and non-EBacc subjects in GCSE entries from 2017 to 2021. EBacc subjects continue to account for the majority of GCSE entries. Further details are listed under the heading "GCSE entries".
| Year | Number non-EBacc entries | Number EBacc entries | Percent non-EBacc entries | Percent EBacc entries |
|---|---|---|---|---|
| 2017 | 1,247,220 | 3,850,805 | 24% | 76% |
| 2018 | 1,082,020 | 4,054,475 | 21% | 79% |
| 2019 | 979,140 | 4,206,700 | 19% | 81% |
| 2020 | 984,645 | 4,297,100 | 19% | 81% |
| 2021 | 963,390 | 4,337,685 | 18% | 82% |
3.1 Change from previous year in GCSE entries for EBacc subjects
Entries for many EBacc subjects show small increases compared to 2020. Subjects are ordered by total entry size in 2021 (largest to smallest) in the graph below, which shows the change in entry compared to last year.
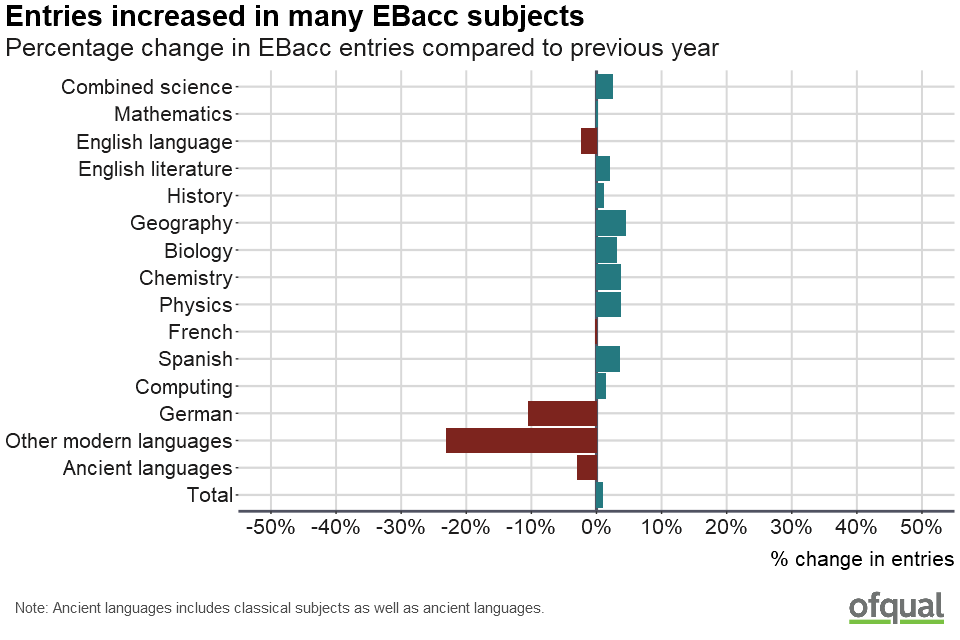
A diverging bar chart showing the percentage change in EBacc entries compared to previous year. Entries increased in many EBacc subjects. Further details are listed under the heading "Change from previous year in GCSE entries for EBacc subjects".
Note: In the table below, ancient languages includes classical subjects as well as ancient languages.
| Subject grouping | June 2020 | June 2021 | % change in entries |
|---|---|---|---|
| Combined science | 820,270 | 840,955 | 3% |
| Mathematics | 757,235 | 758,755 | 0% |
| English language | 746,705 | 729,605 | -2% |
| English literature | 561,315 | 572,765 | 2% |
| History | 275,910 | 278,880 | 1% |
| Geography | 256,805 | 268,180 | 4% |
| Biology | 166,635 | 171,835 | 3% |
| Chemistry | 159,760 | 165,710 | 4% |
| Physics | 158,395 | 164,330 | 4% |
| French | 125,770 | 125,655 | 0% |
| Spanish | 105,840 | 109,655 | 4% |
| Computing | 76,180 | 77,245 | 1% |
| German | 41,320 | 37,035 | -10% |
| Other modern languages | 32,755 | 25,225 | -23% |
| Ancient languages | 12,215 | 11,860 | -3% |
| Total | 4,297,100 | 4,337,685 | 1% |
There have been increases in entries for many EBacc subjects, particularly combined science, English literature and geography. The largest proportional increases were in geography, physics and chemistry.
Overall, modern foreign language entries remain stable (272,930 in 2020 to 272,345 in 2021) but the entries for the individual languages have been subject to different changes. German entry decreased in contrast to the increase in Spanish (by around -10% and 4% respectively) whilst French entries remain stable compared to 2020.
Entries in computing increased slightly this year (from 76,180 in 2020 to 77,245 in 2021) after a fall last year.
3.2 GCSE entries in EBacc subjects over time and by year group
Entries for combined science, geography, history and Spanish have increased each year for the last five years. Please note that combined science entry is double counted because 2 GCSEs are awarded.
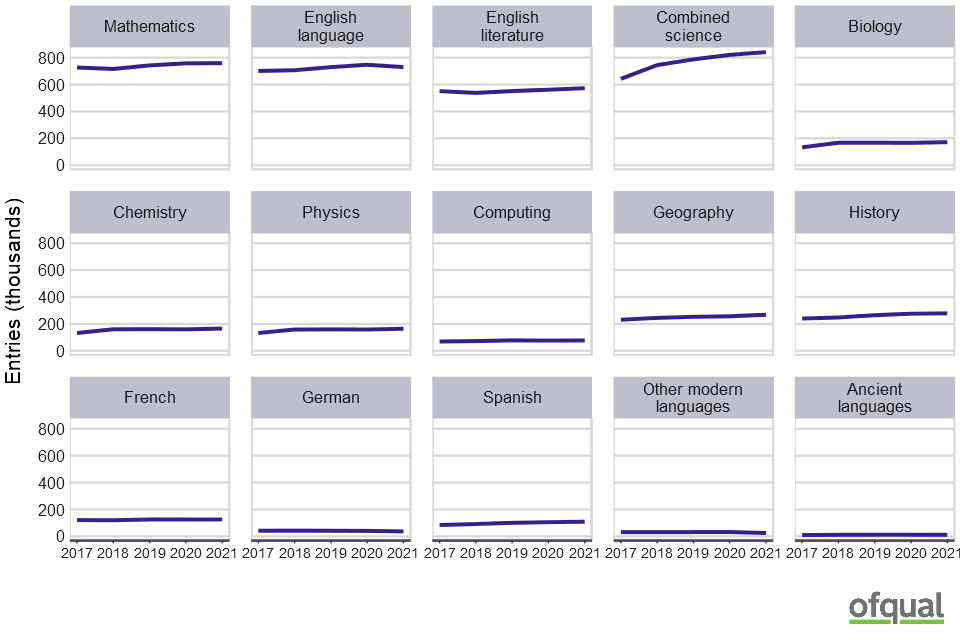
A line chart showing the entries in thousands from 2017 to 2021. Trends in EBacc subject entry size over time. Further details are listed under the heading "Entries in EBacc subjects over time and by year group".
Table: Trends in GCSE EBacc subject entry size over time
| Subject | 2017 | 2018 | 2019 | 2020 | 2021 |
|---|---|---|---|---|---|
| Ancient languages | 10,265 | 11,770 | 12,170 | 12,215 | 11,860 |
| Biology | 133,030 | 167,075 | 167,525 | 166,635 | 171,835 |
| Chemistry | 132,520 | 160,110 | 160,980 | 159,760 | 165,710 |
| Combined science | 641,725 | 744,185 | 786,830 | 820,270 | 840,955 |
| Computing | 69,350 | 72,360 | 78,080 | 76,180 | 77,245 |
| English language | 701,020 | 706,255 | 729,315 | 746,705 | 729,605 |
| English literature | 551,030 | 537,990 | 551,205 | 561,315 | 572,765 |
| French | 121,485 | 120,605 | 125,700 | 125,770 | 125,655 |
| Geography | 231,350 | 244,925 | 253,125 | 256,805 | 268,180 |
| German | 41,990 | 43,260 | 42,175 | 41,320 | 37,035 |
| History | 240,170 | 248,040 | 264,680 | 275,910 | 278,880 |
| Mathematics | 726,595 | 715,775 | 742,245 | 757,235 | 758,755 |
| Other modern languages | 32,295 | 31,850 | 32,035 | 32,755 | 25,225 |
| Physics | 132,595 | 158,295 | 159,555 | 158,395 | 164,330 |
| Spanish | 85,380 | 91,980 | 101,080 | 105,840 | 109,655 |
There are some small changes to entry by year group in 2021 compared to previous years. In all subjects, the majority of entries are from candidates in year 11, but the proportion of entries from candidates in year 10 and below (“early entries”) in other modern languages is consistently higher than observed in other subjects. This remains the case in 2021 but the proportion of early entries has fallen. In English language, the proportion of candidates in year 12 and above is also lower than seen in other recent years.
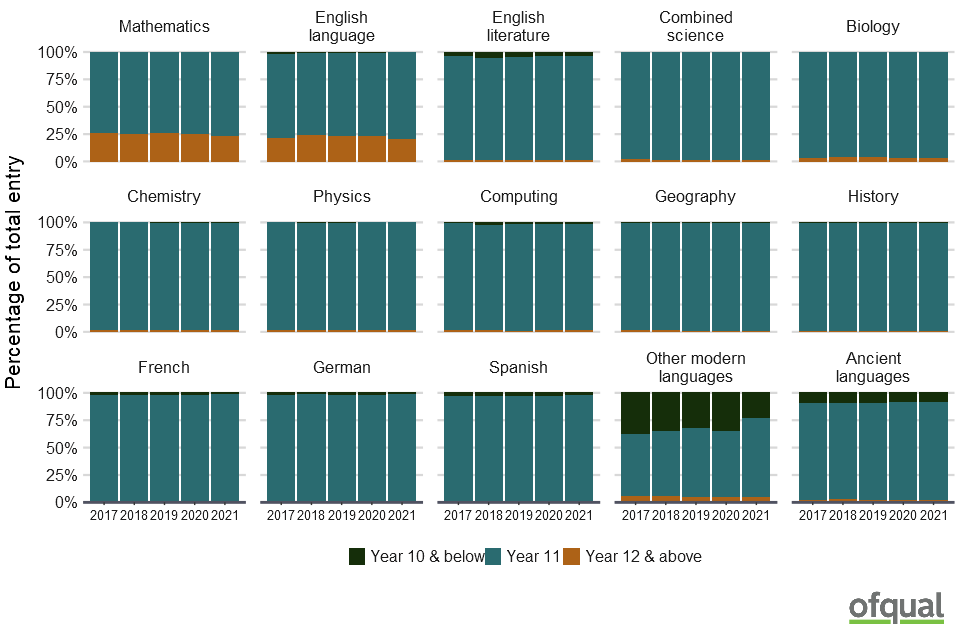
A bar chart showing the entries in EBacc subjects by year group. The percentage of entries from year 11 students is slightly higher this year. Further details are listed under the heading "Entries in EBacc subjects over time and by year group".
Table: Percentage of candidates by year group in EBacc subjects
| Subject | Year group | 2017 | 2018 | 2019 | 2020 | 2021 |
|---|---|---|---|---|---|---|
| Ancient languages | Year 10 & below | 10% | 9% | 10% | 9% | 9% |
| Ancient languages | Year 11 | 88% | 88% | 88% | 89% | 89% |
| Ancient languages | Year 12 & above | 2% | 2% | 2% | 2% | 2% |
| Biology | Year 10 & below | 0% | 1% | 1% | 1% | 1% |
| Biology | Year 11 | 97% | 96% | 96% | 96% | 97% |
| Biology | Year 12 & above | 3% | 3% | 3% | 3% | 3% |
| Chemistry | Year 10 & below | 0% | 0% | 1% | 1% | 1% |
| Chemistry | Year 11 | 98% | 98% | 98% | 98% | 98% |
| Chemistry | Year 12 & above | 1% | 1% | 1% | 1% | 1% |
| Combined science | Year 10 & below | 0% | 0% | 0% | 0% | 0% |
| Combined science | Year 11 | 97% | 99% | 99% | 99% | 99% |
| Combined science | Year 12 & above | 2% | 1% | 1% | 1% | 1% |
| Computing | Year 10 & below | 1% | 3% | 2% | 2% | 2% |
| Computing | Year 11 | 98% | 97% | 97% | 97% | 98% |
| Computing | Year 12 & above | 1% | 1% | 1% | 1% | 1% |
| English language | Year 10 & below | 2% | 2% | 1% | 1% | 1% |
| English language | Year 11 | 76% | 75% | 76% | 76% | 80% |
| English language | Year 12 & above | 21% | 24% | 23% | 23% | 20% |
| English literature | Year 10 & below | 4% | 6% | 5% | 4% | 4% |
| English literature | Year 11 | 95% | 94% | 94% | 95% | 96% |
| English literature | Year 12 & above | 1% | 1% | 1% | 1% | 1% |
| French | Year 10 & below | 2% | 2% | 2% | 2% | 2% |
| French | Year 11 | 97% | 97% | 97% | 97% | 98% |
| French | Year 12 & above | 1% | 1% | 1% | 1% | 0% |
| Geography | Year 10 & below | 1% | 1% | 1% | 1% | 1% |
| Geography | Year 11 | 98% | 98% | 98% | 99% | 99% |
| Geography | Year 12 & above | 1% | 1% | 1% | 1% | 1% |
| German | Year 10 & below | 2% | 2% | 2% | 2% | 1% |
| German | Year 11 | 97% | 98% | 97% | 97% | 98% |
| German | Year 12 & above | 1% | 1% | 1% | 1% | 0% |
| History | Year 10 & below | 1% | 1% | 1% | 1% | 1% |
| History | Year 11 | 98% | 98% | 98% | 99% | 99% |
| History | Year 12 & above | 1% | 1% | 1% | 1% | 1% |
| Mathematics | Year 10 & below | 1% | 1% | 0% | 0% | 0% |
| Mathematics | Year 11 | 74% | 75% | 74% | 75% | 77% |
| Mathematics | Year 12 & above | 25% | 25% | 25% | 24% | 23% |
| Other modern languages | Year 10 & below | 38% | 35% | 33% | 35% | 24% |
| Other modern languages | Year 11 | 56% | 59% | 63% | 60% | 72% |
| Other modern languages | Year 12 & above | 6% | 6% | 5% | 5% | 5% |
| Physics | Year 10 & below | 0% | 1% | 1% | 0% | 0% |
| Physics | Year 11 | 99% | 98% | 98% | 98% | 98% |
| Physics | Year 12 & above | 1% | 1% | 1% | 1% | 1% |
| Spanish | Year 10 & below | 3% | 3% | 3% | 3% | 2% |
| Spanish | Year 11 | 96% | 96% | 96% | 96% | 97% |
| Spanish | Year 12 & above | 1% | 1% | 1% | 1% | 1% |
3.3 Changes in GCSE entries for non-EBacc subjects
Overall, entries in non-EBacc subjects decreased slightly in 2021 with more subjects experiencing decreases in entry than increases. Statistics, other sciences and engineering have the largest proportional changes (-31%, -19% and -11%).
The graph and table below show the change this year in entries for non-EBacc subjects compared to 2020. The subjects are ordered by total entry size in 2021 (largest to smallest).
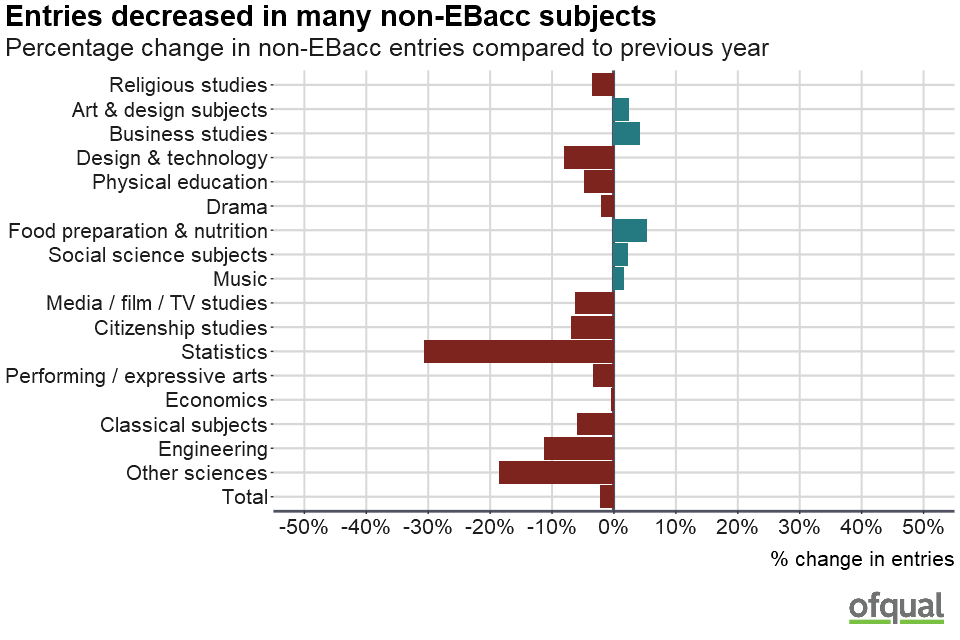
A diverging bar chart showing the percentage change in non-EBacc entries compared to previous year. Entries decreased in many non-EBacc subjects. Further details are listed under the heading "Changes in GCSE entries for non-EBacc subjects".
| Subject grouping | June 2020 | June 2021 | % change in entries |
|---|---|---|---|
| Religious studies | 248,340 | 239,680 | -3% |
| Art & design subjects | 193,035 | 197,595 | 2% |
| Business studies | 91,800 | 95,610 | 4% |
| Design & technology | 89,665 | 82,505 | -8% |
| Physical education | 74,995 | 71,425 | -5% |
| Drama | 58,000 | 56,860 | -2% |
| Food preparation & nutrition | 47,495 | 49,965 | 5% |
| Social science subjects | 38,560 | 39,395 | 2% |
| Music | 34,865 | 35,400 | 2% |
| Media / film / TV studies | 34,845 | 32,705 | -6% |
| Citizenship studies | 22,285 | 20,750 | -7% |
| Statistics | 25,845 | 17,950 | -31% |
| Performing / expressive arts | 9,085 | 8,780 | -3% |
| Economics | 6,525 | 6,500 | 0% |
| Classical subjects | 3,755 | 3,540 | -6% |
| Engineering | 2,830 | 2,515 | -11% |
| Other sciences | 2,725 | 2,220 | -19% |
| Total | 984,645 | 963,390 | -2% |
3.4 Entries for tiered GCSEs
In some subjects, there are two tiers of entry: foundation and higher. The graph below shows the entry by tier for the last 3 years for those reformed specifications which are tiered. Entry to higher tier has increased slightly in most tiered subjects in 2021.
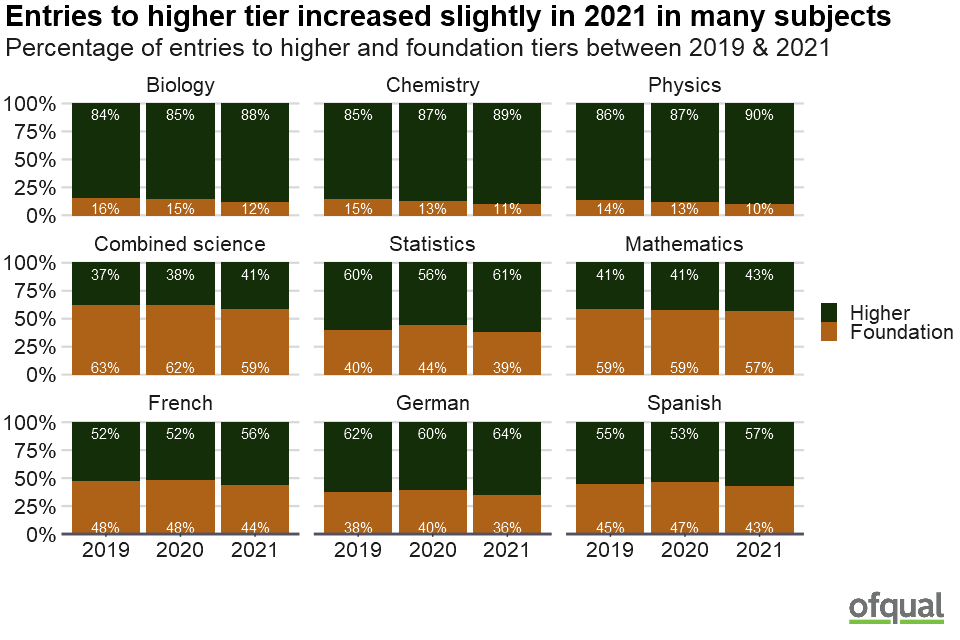
A bar chart showing the percentage of entries to higher and foundation tiers between 2019 & 2021. Entries to higher tier increased slightly in 2021 in many subjects. Further details are listed under the heading "Entries for tiered GCSEs".
Table: Percentage of entries for higher tier between 2019 and 2021
| Subject | 2019 | 2020 | 2021 |
|---|---|---|---|
| Biology | 84% | 85% | 88% |
| Chemistry | 85% | 87% | 89% |
| Physics | 86% | 87% | 90% |
| Combined science | 37% | 38% | 41% |
| Statistics | 60% | 56% | 61% |
| Mathematics | 41% | 41% | 43% |
| French | 52% | 52% | 56% |
| German | 62% | 60% | 64% |
| Spanish | 55% | 53% | 57% |
4. AS and A level entries
The overall entry for A levels in summer 2021 increased by 3% (756,230 in 2021 compared to 731,855 in 2020). The change is likely to partly reflect a change in the size of the overall cohort: ONS census data indicates that there are more 18 year olds in England in 2021 than in 2020 (607,496 compared to 599,393).
The overall entry for AS in summer 2021 decreased by 33% (58,300 in 2021 compared to 86,970 in 2020). This drop in AS entries continues a trend caused by the decoupling of AS from A levels as part of AS and A level reforms.
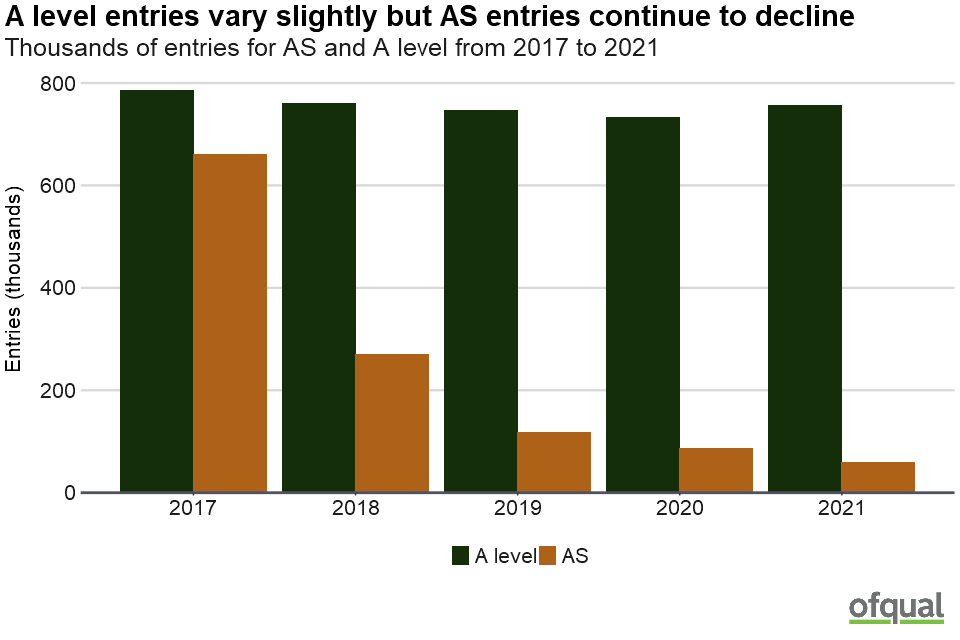
A bar chart showing the thousands of entries for AS and A level from 2017 to 2021. A level entries vary slightly but AS entries continue to decline. Further details are listed under the heading "AS and A level entries".
| Qualification | 2017 | 2018 | 2019 | 2020 | 2021 |
|---|---|---|---|---|---|
| A level | 785,450 | 759,670 | 745,585 | 731,855 | 756,230 |
| AS | 659,880 | 269,090 | 117,595 | 86,970 | 58,300 |
| Total | 1,445,330 | 1,028,765 | 863,180 | 818,825 | 814,525 |
4.1 A level entries
Some A level subjects have increased in entry size and other subjects show a decrease. Geography, law and computing show the biggest percentage increases. Overall, modern foreign language (French, German, Spanish) entries varied a little compared to last year (increased entry in Spanish but a decrease in German, similar to GCSE), but entries in other modern languages decreased by 17%. Entries in biology, chemistry and physics all show a slight increase this year. Entries in computing also show another sizeable increase (10%), following a similar change in 2020.
The graph and table below show the change in entries this year compared to 2020. The subjects are ordered by total entry size in 2021 (largest to smallest).
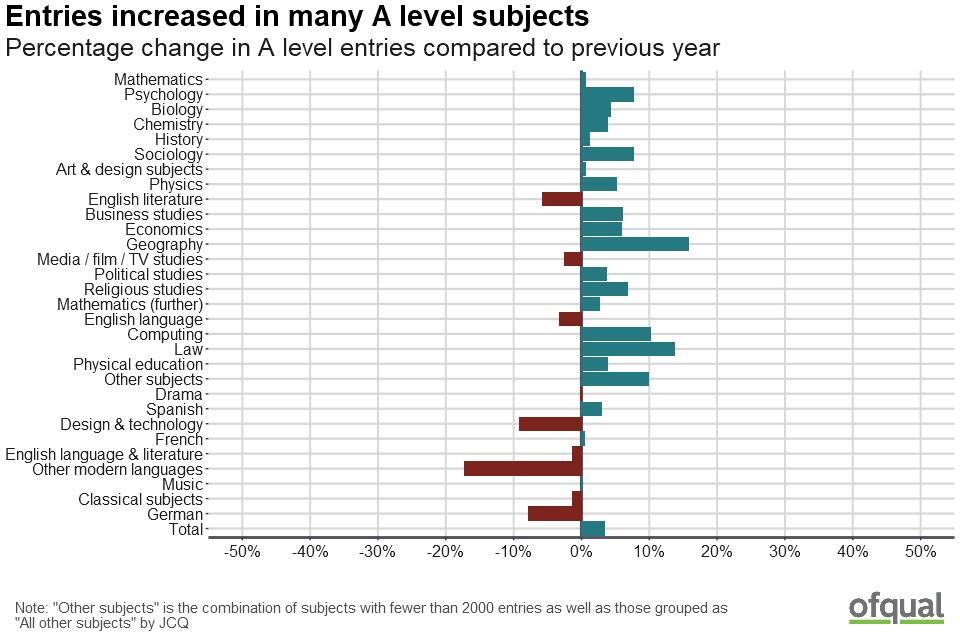
A diverging bar chart showing the percentage change in A level entries compared to previous year. Entries increased in many A level subjects. Further details are listed under the heading "A level entries".
Note: In this table, “Other subjects” is the combination of subjects with fewer than 2,000 entries as well as those grouped as “All other subjects” by JCQ.
| Subject grouping | June 2020 | June 2021 | % change in entries |
|---|---|---|---|
| Mathematics | 89,730 | 90,290 | 1% |
| Psychology | 63,490 | 68,315 | 8% |
| Biology | 61,130 | 63,765 | 4% |
| Chemistry | 53,435 | 55,485 | 4% |
| History | 41,120 | 41,585 | 1% |
| Sociology | 36,965 | 39,825 | 8% |
| Art & design subjects | 39,145 | 39,370 | 1% |
| Physics | 35,740 | 37,560 | 5% |
| English literature | 38,310 | 36,135 | -6% |
| Business studies | 33,260 | 35,285 | 6% |
| Economics | 30,865 | 32,700 | 6% |
| Geography | 27,470 | 31,810 | 16% |
| Media / film / TV studies | 19,525 | 19,025 | -3% |
| Political studies | 16,455 | 17,065 | 4% |
| Religious studies | 14,680 | 15,685 | 7% |
| Mathematics (further) | 14,475 | 14,850 | 3% |
| English language | 14,715 | 14,230 | -3% |
| Computing | 11,730 | 12,930 | 10% |
| Law | 11,275 | 12,825 | 14% |
| Physical education | 10,355 | 10,755 | 4% |
| Other subjects | 8,095 | 8,890 | 10% |
| Drama | 8,685 | 8,670 | 0% |
| Spanish | 8,225 | 8,465 | 3% |
| Design & technology | 9,185 | 8,340 | -9% |
| French | 7,685 | 7,725 | 1% |
| English language & literature | 7,250 | 7,155 | -1% |
| Other modern languages | 6,420 | 5,315 | -17% |
| Music | 5,035 | 5,045 | 0% |
| Classical subjects | 4,665 | 4,600 | -1% |
| German | 2,735 | 2,525 | -8% |
| Total | 731,855 | 756,230 | 3% |
4.2 Change in A level entries over time
The graphs below show the change in entries from 2017 to 2021 for a selection of A level subjects in 2021. Entries for social science subjects continue to increase.
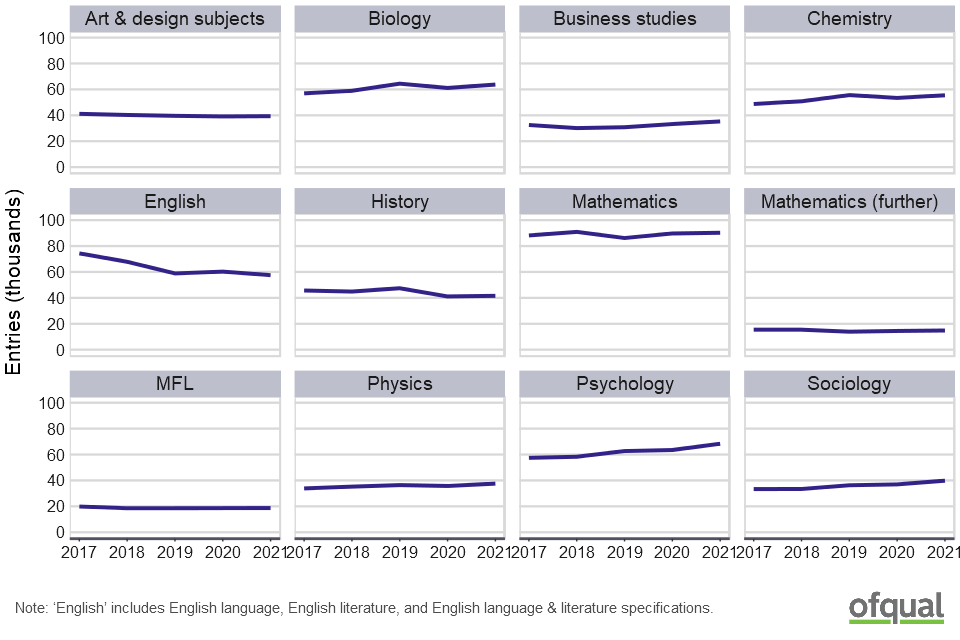
A line chart showing the entries in thousands from 2017 to 2021. Trends in A level entry size over time. Further details are listed under the heading "Change in A level entries for larger entry subjects".
Table: Selected A level subject entry size over time. Note: In this table, ‘English’ includes English language, English literature and English language & literature specifications.
| Subject | 2017 | 2018 | 2019 | 2020 | 2021 |
|---|---|---|---|---|---|
| Art & design subjects | 41,150 | 40,300 | 39,635 | 39,145 | 39,370 |
| Biology | 56,945 | 58,925 | 64,460 | 61,130 | 63,765 |
| Business studies | 32,540 | 30,155 | 30,820 | 33,260 | 35,285 |
| Chemistry | 48,765 | 50,830 | 55,615 | 53,435 | 55,485 |
| English | 74,355 | 67,865 | 58,870 | 60,275 | 57,515 |
| History | 45,725 | 44,900 | 47,455 | 41,120 | 41,585 |
| Mathematics | 88,205 | 90,955 | 86,185 | 89,730 | 90,290 |
| Mathematics (further) | 15,450 | 15,450 | 13,920 | 14,475 | 14,850 |
| Physics | 33,840 | 35,255 | 36,420 | 35,740 | 37,560 |
| Psychology | 57,460 | 58,300 | 62,685 | 63,490 | 68,315 |
| Sociology | 33,330 | 33,420 | 36,295 | 36,965 | 39,825 |
| Modern foreign languages | 19,885 | 18,540 | 18,585 | 18,645 | 18,715 |
4.3 AS entries
Entries in all AS subjects experience another substantial decrease this year (percentage decreases range from 15% to 45%) although the decrease is less pronounced in Mathematics (further) and Art & design subjects. Overall, there has been a decline of 96% to 58,300 in 2021 from 1,331,955 entries in 2015, the last year that AS formed part of the A level qualification prior to reform.
The graph and table below show the change in entries this year (for subjects with entries of 2,000 or more) compared to 2020. The subjects are ordered by total entry size in 2021 (largest to smallest).
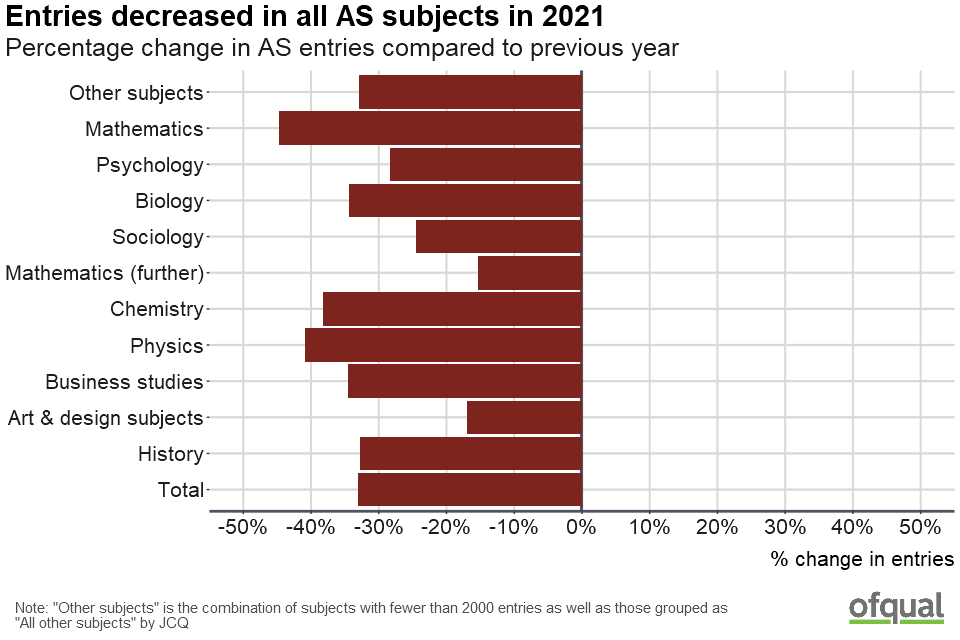
A diverging bar chart showing the percentage change in AS entries compared to previous year. Entries decreased in all AS subjects in 2021. Further details are listed under the heading "AS entries".
Table: Percentage change in AS entries compared to previous year. Note: “Other subjects” is the combination of subjects with fewer than 2,000 entries as well as those grouped as “All other subjects” by JCQ
| Subject grouping | June 2020 | June 2021 | % change in entries |
|---|---|---|---|
| Other subjects | 26,105 | 17,530 | -33% |
| Mathematics | 12,550 | 6,955 | -45% |
| Psychology | 8,110 | 5,820 | -28% |
| Biology | 7,230 | 4,745 | -34% |
| Sociology | 5,960 | 4,510 | -24% |
| Mathematics (further) | 4,925 | 4,175 | -15% |
| Chemistry | 6,390 | 3,950 | -38% |
| Physics | 4,745 | 2,810 | -41% |
| Business studies | 4,140 | 2,710 | -35% |
| Art & design subjects | 3,230 | 2,685 | -17% |
| History | 3,585 | 2,410 | -33% |
| Total | 86,970 | 58,300 | -33% |
5. Entries by centre type
The graph below indicates the percentage of entries for each qualification by centre type. In all cases, the majority of entries are from secondary non-selective, maintained centres, followed by sixth form and further education (FE) establishments.
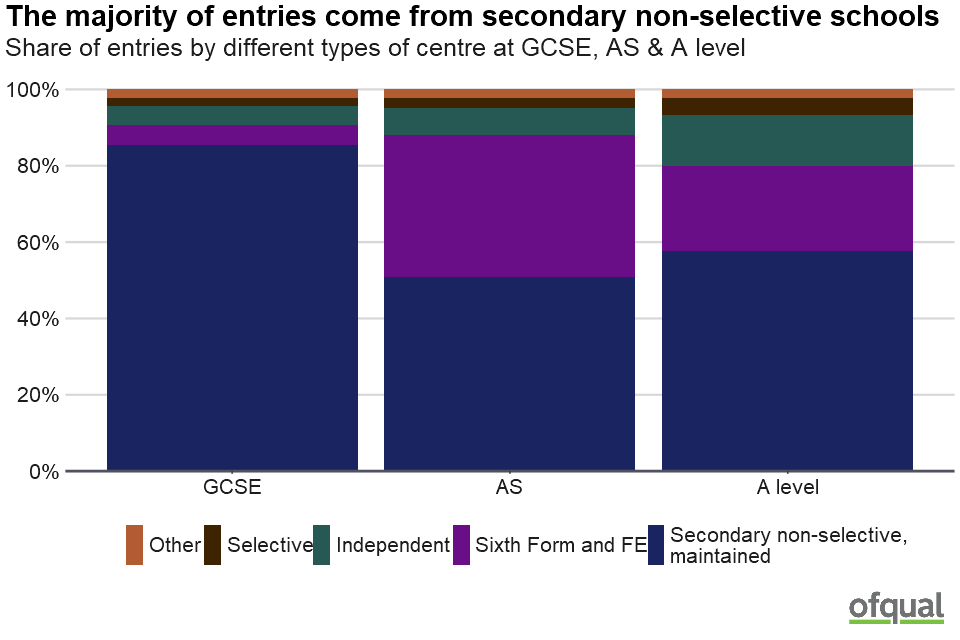
A bar chart showing the share of entries by different types of centre at GCSE, AS & A level. The majority of entries come from secondary non-selective schools. Further details are listed under the heading "Entries by centre type".
Table: Number of entries by qualification and centre type
| Centre type | GCSE | AS | A level |
|---|---|---|---|
| Secondary non-selective, maintained | 4,535,745 | 29,720 | 437,010 |
| Sixth Form and FE | 274,090 | 21,745 | 168,750 |
| Independent | 267,030 | 4,105 | 101,155 |
| Selective | 114,285 | 1,475 | 32,390 |
| Other | 109,920 | 1,250 | 16,925 |
Table: Percentage of total entries by centre type for each qualification
| Centre type | GCSE | AS | A level |
|---|---|---|---|
| Secondary non-selective, maintained | 86% | 51% | 58% |
| Sixth Form and FE | 5% | 37% | 22% |
| Independent | 5% | 7% | 13% |
| Selective | 2% | 3% | 4% |
| Other | 2% | 2% | 2% |
6. Background information
In this report, Ofqual presents data on the number of provisional entries for GCSEs, AS and A levels in England received by exam boards for the summer 2021 series.
Schools and colleges enter students with exam boards to take qualifications in the summer. The figures for entries can normally change up to the day of the exams. On 4 January 2021, the Prime Minister announced that schools and colleges would again be closed to most students to help fight the spread of coronavirus and that exams would not take place as normal. On 25 February 2021, following consultation and a letter of direction from the Secretary of State, Ofqual published information setting out how grades would be determined for students entering for qualifications in summer 2021. We collect provisional data at the same time every year, at a point when it should be reasonably complete, although in 2021 centres were given an extension to the deadline for private candidates. The figures presented here are the provisional figures as received by exam boards by 28 April 2021 and final entry numbers may be slightly different from these.
In this report, all figures for the number of entries are rounded to the nearest 5.
Background information accompanying this report includes factors which may have an impact upon the entries in summer 2021 as well as information on data collected for this release and definitions of important terms used in the report.
Data tables published along with this report give provisional entry data (rounded to the nearest 5) for different subjects broken down by year group for GCSE, AS and A levels.
7. User feedback
We welcome your feedback on our publications. Should you have any comments on this statistical release and how to improve it to meet your needs please contact us at data.analytics@ofqual.gov.uk.
Head of profession: Vikas Dhawan