Port freight quarterly statistics: January to March 2021
Published 9 June 2021

© Crown copyright 2021
This publication is licensed under the terms of the Open Government Licence v3.0 except where otherwise stated. To view this licence, visit nationalarchives.gov.uk/doc/open-government-licence/version/3 or write to the Information Policy Team, The National Archives, Kew, London TW9 4DU, or email: psi@nationalarchives.gov.uk.
Where we have identified any third party copyright information you will need to obtain permission from the copyright holders concerned.
This publication is available at https://www.gov.uk/government/statistics/port-freight-quarterly-statistics-january-to-march-2021/port-freight-quarterly-statistics-january-to-march-2021
Following user feedback, the department are trialling publishing estimates of cargo group alongside the quarterly port freight statistics, in a proposed third quarterly table PORT0503. This has been published containing current quarter data for the first time.
This new data is regarded as Experimental Statistics, awaiting user feedback and further quality assurance to provide timely estimates. You can provide feedback about this change by filling in this form. We continue to welcome any feedback on any aspect of the port freight statistics, you can contact us by email to maritime statistics or phone 020 7944 4847.
When comparing January to March 2021 with January to March 2020 through UK major ports:
- total freight tonnage decreased by 9% to 103.9 million tonnes
- inward tonnage decreased by 8% to 67.2 million tonnes
- outward tonnage decreased by 11% to 36.6 million tonnes
- total volume of unitised traffic decreased by 13% to 4.2 million units
- inward units decreased by 17% to 2.2 million units
- outward units decreased by 8% to 2.0 million units
When comparing the rolling year to March 2021 with March 2020 through UK major ports:
- total tonnage decreased by 11% to 419.1 million tonnes
- total volume of unitised traffic decreased by 23% to 17.3 million units
Detailed final annual statistics for 2020 will be published in July 2021 and for 2021 in summer 2022.
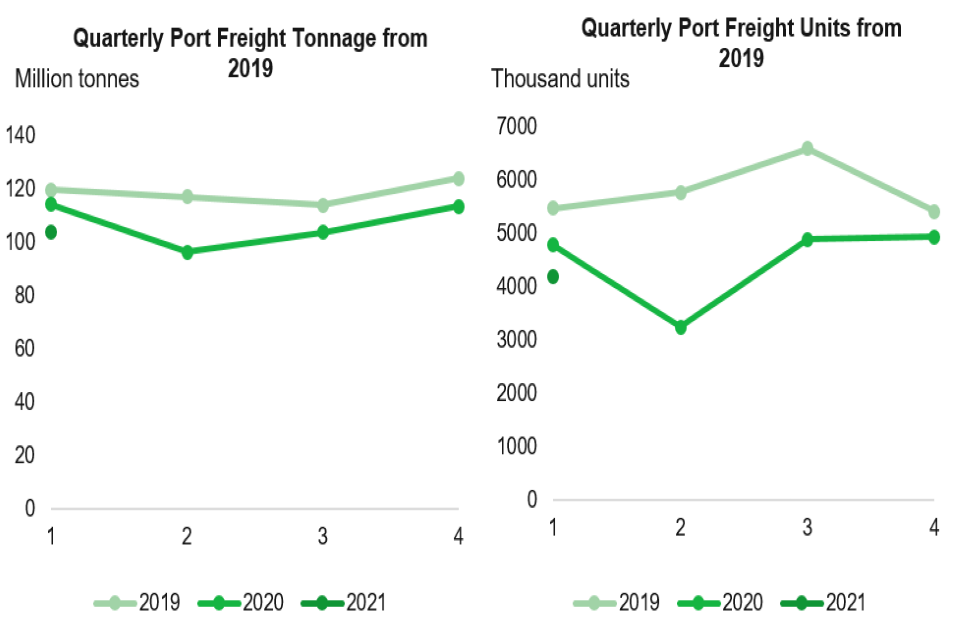
This chart shows the quarterly port freight trends from 2019.
Factors affecting port freight: coronavirus (COVID-19)
These statistics cover a period of government measures to limit the impact and transmission of the coronavirus (COVID-19) pandemic. A timeline of measures that are relevant to freight and units traffic is shown below alongside quarters.
First quarter: January to March 2020
March 2020:
- Foreign and Commonwealth Office advised against all non-essential international travel
- UK lockdown applied
Second quarter: April to June 2020
Lockdown restrictions started to ease and continued to be gradually reduced throughout the next quarter.
June 2020:
- requirement to self-isolate introduced for persons travelling to the UK from outside the Common Travel Area.
Third quarter: July to September 2020
July 2020:
- introduction of travel corridors, allowing travel into the UK from countries on an exempt list without the need to self-isolate
August 2020:
- Belgium, France and Netherlands removed from the exempt list
Fourth quarter: October to December 2020
October 2020:
- new 3-tier system of restrictions for England introduced
November 2020:
- England lockdown applied
December 2020:
- reduction of the self-isolation period for travellers returning from non-travel corridor countries, from 14 to 10 days
- introduction of test to release to shorten the self-isolation period for international arrivals
- varying Christmas travel guidelines across the UK
Stricter tier 4 restrictions brought in for the South-East, after the discovery of a new variant. In response to this new variant, restrictions were brought in by other countries, that all individuals including freight drivers needed a negative COVID-19 test.
Passenger and accompanied freight travel to France was stopped completely for 2 days, accompanied freight travel was only allowed following this ban with the driver receiving a negative test within the last 72 hours.
First quarter: January to March 2021 (this release)
National lockdown comes into force on 5 January for the duration of the first quarter of 2021. The UK advised against all international travel unless it is for a permitted exempt reason, with all travel corridors being suspended. Pre-departure testing requirements for all inbound passengers to England were introduced, with passengers having to take a test up to 3 days before departure and provide evidence of a negative result before they travel. All inbound international passengers required to take 2 mandatory COVID-19 tests on day 2 and 8 of their quarantine with those arriving from red list countries required to quarantine in managed quarantine facilities.
Quarterly traffic compared to forecasts
DfT’s Port freight traffic forecasts were published in 2019 and therefore provide a pre-pandemic estimation of how port freight traffic was expected to evolve in 2020.
The different scenarios shown in the port forecasts were based on key economic drivers, namely OBR GDP forecasts, ONS population projections, fuel projections from the OGA, National Grid and BEIS, and EIA Brent price forecasts. These forecasts presented low, central and high scenarios from 2017 up to 2050.
The impact of coronavirus on port freight can be estimated by comparing provisional 2020 and 2021 traffic statistics to the port freight forecasts (adjusted as described in the below note on method). The comparison below shows that all 4 quarters of 2020 were lower than levels expected pre-pandemic, with the lowest point reached in the second quarter of 2020 (April to June). The gap reduced in the fourth quarter (October to December), and then increased again in the first quarter of 2021 (January to March). Traffic remains lower than levels expected pre-pandemic. The fall in imports and exports is consistent with the unwinding of stocks seen in January and February 2021 ONS trade statistics, after businesses stockpiled in December 2020 in preparation for the end of the transition period with the European Union.
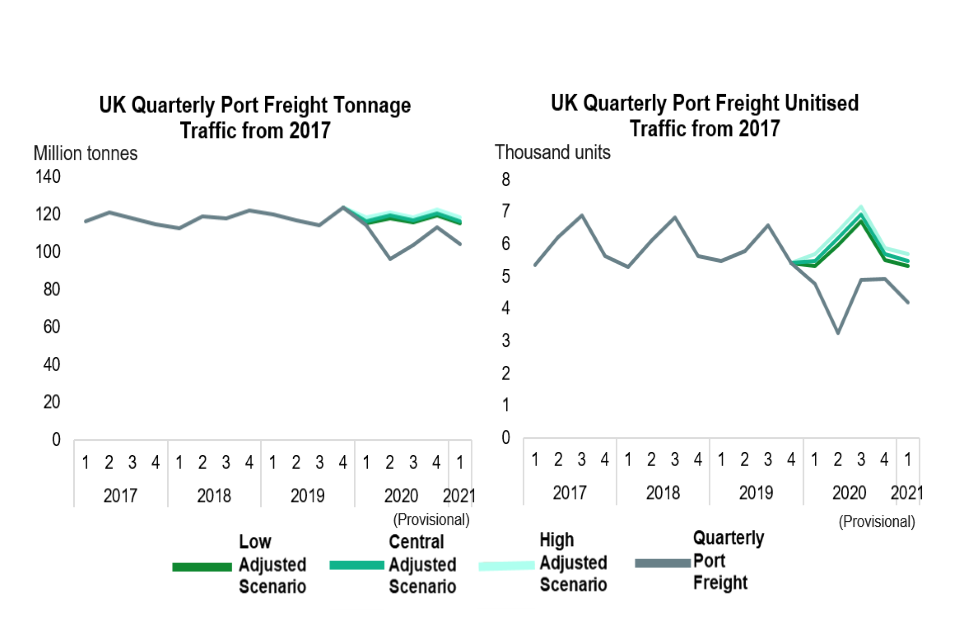
This chart shows the trend of actual quarterly tonnage and unitised traffic against forecasted traffic in separate charts since 2017.
Note on method:
For past years, the annual DfT port freight traffic forecasts were adjusted so that the central scenario is in line with published annual port freight figures. 2020 to 2021 annual figures were scaled up based on the average adjustments made to the previous years. The low and high scenarios were then adjusted to keep the same yearly ratio to the central scenario. This is to adjust for the difference observed between actuals and forecasts for the years where the data has become available since forecasts were calculated.
The annual forecasts were broken down into quarters based on the quarterly trend observed in published port freight data in each year for 2017 to 2019. For 2020 and 2021, an average quarterly trend over previous years was used to apportion the annual forecast. This is so that the comparison of quarters impacted by coronavirus can be made to the proportion of the annual forecasts we would have expected these quarters to represent.
Passenger vehicle numbers were not included in the port freight forecasts but are included in the quarterly port freight data. Published annual figures for passenger vehicles were added to the forecasts for 2017 to 2019. As a pre-pandemic forecast for 2020, 2019 passenger vehicles volumes were used. This is because the recent trend for passenger vehicles has been relatively stable (absolute volumes varying between 5.9 and 5.5 million units since 2012).
The above methodology ensures that the baseline used for 2020 to assess the impact of coronavirus on these quarterly statistics has a comparable scope and reflects known trends since the forecasts were produced.
Quarterly traffic compared to variation of port freight traffic
This analysis puts the fall of port freight volumes since the pandemic into the context of how much port freight traffic usually varies over time. The below graphs show tonnage and unitised quarterly traffic since 2015 plotted against a long-term linear trend estimated from 2009 to 2019 data (grey line). The area shaded in light green represents the range of values within one standard deviation from this trend. The area shaded in dark green represents the range of values within two standard deviations from the trend.
Up to 2019, unitised traffic has tended to remain within one standard deviation from the trend, with a very regular seasonal variation. Tonnage traffic has varied slightly more than unitised traffic over time around the long-term trend and does not follow a very regular seasonal pattern, but has remained within the wider range of two standard deviations from the trend. As can be seen from the charts, figures for both tonnage and units have fallen far below historical variability, showing the impact coronavirus and related effects of coronavirus (e.g. on the economy) may have had on port freight traffic.
In the fourth quarter of 2020, tonnage was back within one standard deviation of pre-pandemic variability, while unitised traffic was within two standard deviations in both the third and fourth quarters. However, in the first quarter of 2021, both tonnage and units have fallen beyond two standard deviations again, related to further lockdowns in the UK as well as the unwinding of stockpiling in the lead to the end of the transition period with the European Union, as mentioned above
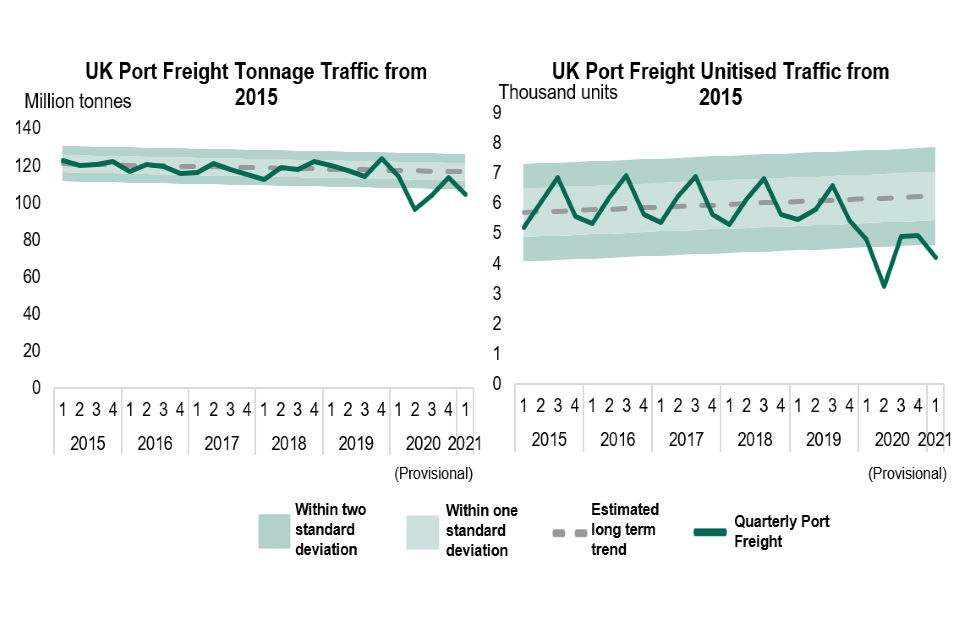
This chart shows the trend of actual quarterly tonnage and unitised traffic against a linear trend and the expected standard deviation of traffic over time, in separate charts since 2015.
Note on method:
To calculate the ranges of standard deviation, the differences between the published quarterly port freight figures and the trend was calculated for each quarter and then squared. The sum of these squared differences, divided by the number of quarters minus 2, gives the expected variance. To obtain the standard deviation, the square root of this variance was performed. This standard deviation was then added or subtracted from the trend to show the range of how much we might expect port traffic to vary over time around the trend.
Further information and definitions
Unitised goods:
Goods which are lifted on or of the vessel in large (20 foot or longer) shipping containers or rolled on or off in one of a variety of self-propelled or towed units are said to be unitised cargoes. For these cargo types, the number of units as well as the weight of goods is recorded.
Tonnage:
Gross weight in tonnes, including crates and other packaging. The tare weights of containers, road goods vehicles, trailers and other items of transport equipment (i.e. the unloaded weight of the vehicle or equipment itself) are excluded.
Further information about these statistics is available, including:
- background information on quarterly port freight statistics
- notes and definitions for all port freight statistics
Please contact Maritime Forecasts if you have any questions about DfT port freight forecasts.
We are trialling this compact HTML format for our quarterly port freight releases, and we would like to hear your comments. If you have any feedback on our use of this format, or any questions about this release, please email Maritime Statistics.