Port Freight Quarterly Statistics: April to June 2020
Published 9 September 2020

© Crown copyright 2020
This publication is licensed under the terms of the Open Government Licence v3.0 except where otherwise stated. To view this licence, visit nationalarchives.gov.uk/doc/open-government-licence/version/3 or write to the Information Policy Team, The National Archives, Kew, London TW9 4DU, or email: psi@nationalarchives.gov.uk.
Where we have identified any third party copyright information you will need to obtain permission from the copyright holders concerned.
This publication is available at https://www.gov.uk/government/statistics/port-freight-quarterly-statistics-april-to-june-2020/port-freight-quarterly-statistics-april-to-june-2020
When comparing April to June 2020 with April to June 2019 through UK major ports:
- total volume of freight tonnage decreased by 18% to 96.1 million tonnes
- inward tonnage decreased by 21% to 60.1 million tonnes
- outward tonnage decreased by 13% to 36.0 million tonnes
- total volume of unitised traffic decreased by 44% to 3.2 million units
- inward units decreased by 45% to 1.7 million units
- outward units decreased by 43% to 1.6 million units
When comparing the rolling year to June 2020 with June 2019 through UK major ports:
- total tonnage decreased by 6% to 447.7 million tonnes
- total volume of unitised traffic decreased by 16% to 20.0 million units
Detailed final annual statistics for 2020 will be published in summer 2021.
Factors affecting port freight: coronavirus (COVID-19)
These statistics cover the period following the government’s announcement of measures to limit the impact and transmission of the coronavirus (COVID-19) pandemic. In early March 2020, the UK government set out four phases in its response to the pandemic. Coronavirus has had a wide impact on UK society and economic activity since March 2020, with the lockdown and quarantine measures impacting unitised traffic, especially passenger vehicles. Sea passenger volumes over this period are published in DfT’s Sea Passenger data collection. The two sections below aim to provide an exploratory picture of the impact of coronavirus on the two first quarters of 2020 port freight traffic.
Quarterly traffic compared to forecasts
DfT’s Port Freight Traffic Forecasts were published in 2019 and therefore provide a pre-pandemic estimation of how port freight traffic was expected to evolve in 2020.
The different scenarios shown in the port forecasts were based on key economic drivers, namely OBR GDP forecasts, ONS population projections, fuel projections from the OGA, National Grid and BEIS, and US EIA Brent price forecasts. These forecasts presented low, central and high scenarios from 2017 up to 2050.
The impact of coronavirus on port freight can be estimated by comparing provisional 2020 traffic statistics to the port freight forecasts (adjusted as described in the below note on method). The comparison below shows that the first two quarters of 2020 were lower than levels expected pre-pandemic, even compared to the low scenario.
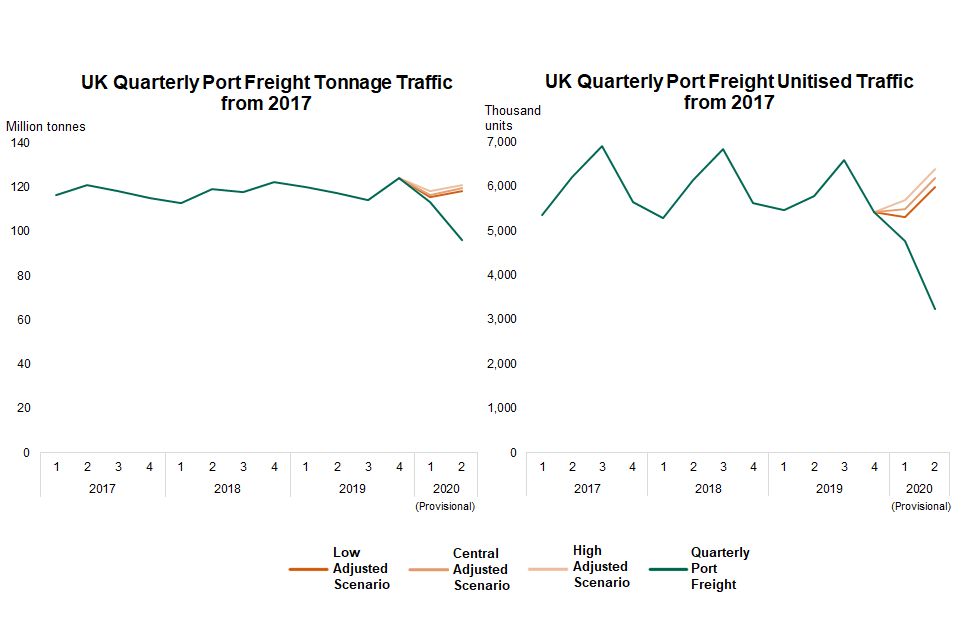
This chart shows the trend of actual quarterly tonnage and unitised traffic against forecasted traffic in separate charts since 2017.
Note on method: For past years, the annual DfT port freight traffic forecasts were adjusted so that the central scenario is in line with published annual port freight figures. 2020 annual figures were scaled up based on the average adjustments made to the previous years. The low and high scenarios were then adjusted to keep the same yearly ratio to the central scenario. This is to adjust for the difference observed between actuals and forecasts for the years where the data has become available since forecasts were calculated.
The annual forecasts were broken down into quarters based on the quarterly trend observed in published port freight data in each year for 2017 to 2019. For the first two quarters of 2020, an average quarterly trend over previous years was used to apportion the annual forecast. This is so that the comparison of quarters impacted by coronavirus can be made to the proportion of the annual forecasts we would have expected these quarters to represent.
Passenger vehicle numbers were not included in the port freight forecasts, but are included in the quarterly port freight data. Published annual figures for passenger vehicles were added to the forecasts for 2017 to 2019. As a pre-pandemic forecast for 2020, 2019 passenger vehicles volumes were used. This is because the recent trend for passenger vehicles has been relatively stable (absolute volumes varying between 5.9 and 5.5 million units since 2012).
The above methodology ensures that the baseline used for 2020 to assess the impact of coronavirus on these quarterly statistics has a comparable scope, and reflects known trends since the forecasts were produced.
Quarterly traffic compared to variation of port freight traffic
This analysis puts the fall of port freight volumes in 2020 into the context of how much port freight traffic usually varies over time. The below graphs show tonnage and unitised quarterly traffic since 2015 plotted against a long-term linear trend estimated from 2009 to 2019 data (grey line). The area shaded in light green represents the range of values within one standard deviation from this trend. The area shaded in dark green represents the range of values within two standard deviations from the trend.
Unitised traffic has tended to remain within one standard deviation from the trend, with a very regular seasonal variation. Tonnage traffic has varied slightly more than unitised traffic over time around the long-term trend and does not follow a very regular seasonal pattern, but has remained within the wider range of two standard deviations from the trend. As can be seen from the charts, 2020 figures for both tonnage and units have fallen far below historical variability, showing the impact coronavirus and related effects of coronavirus (e.g. on the economy) may have had on port freight traffic.
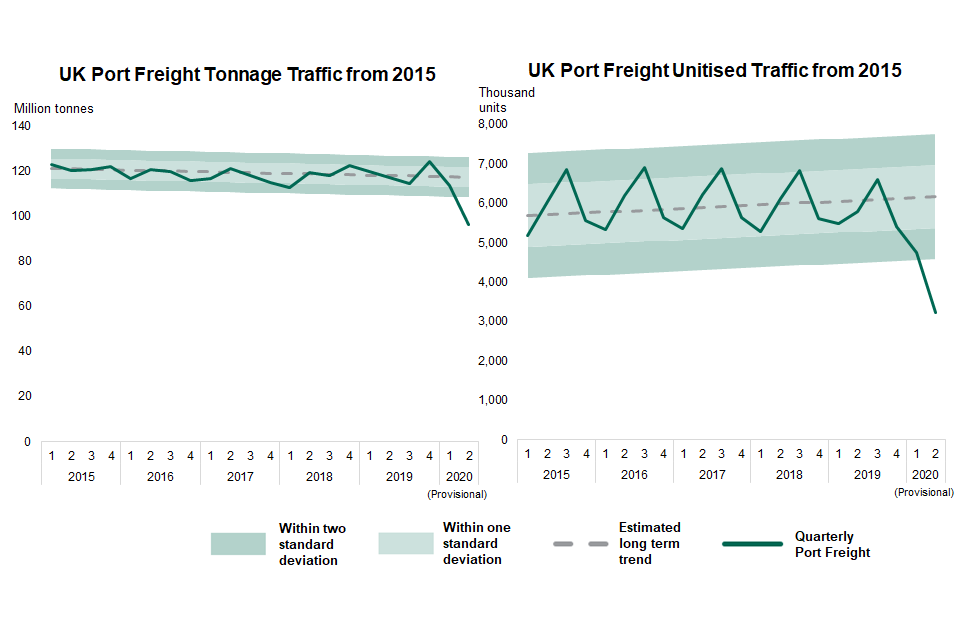
This chart shows the trend of actual quarterly tonnage and unitised traffic against a linear trend and the expected standard deviation of traffic over time, in separate charts since 2015.
Note on method: To calculate the ranges of standard deviation, the differences between the published quarterly port freight figures and the trend was calculated for each quarter and then squared. The sum of these squared differences, divided by the number of quarters minus two, gives the expected variance. To obtain the standard deviation, the square root of this variance was performed. This standard deviation was then added/subtracted from the trend to show the range of how much we might expect port traffic to vary over time around the trend.
Further information about these statistics is available, including:
- background information on quarterly port freight statistics
- notes and definitions for all port freight statistics
Please contact MaritimeForecasts@dft.gov.uk if you have any questions about DfT port freight forecasts.
We are trialling this compact HTML format for our quarterly Port Freight releases, and we would like to hear your comments. If you have any feedback on our use of this format, or any questions about this release, please email maritime.stats@dft.gov.uk.