Non-domestic rating: stock of properties statistical commentary
Published 19 June 2025
Applies to England and Wales

© Crown copyright 2025
This publication is licensed under the terms of the Open Government Licence v3.0 except where otherwise stated. To view this licence, visit nationalarchives.gov.uk/doc/open-government-licence/version/3 or write to the Information Policy Team, The National Archives, Kew, London TW9 4DU, or email: psi@nationalarchives.gov.uk.
Where we have identified any third party copyright information you will need to obtain permission from the copyright holders concerned.
This publication is available at https://www.gov.uk/government/statistics/non-domestic-rating-stock-of-properties-2025/non-domestic-rating-stock-of-properties-statistical-commentary
This release contains statistics relating to stock of non-domestic properties for England and Wales at 31 March 2025. The statistics provide information on the number and value of the stock of rateable properties (known as “hereditaments”), broken down by sector, geographic location, Special Category (SCat), property type and rateable value band.
Responsible Statistician
Anna McReady
Statistical enquiries
Date of next publication
Spring 2026
1. Headline figures
1.1 Properties in England and Wales on the Local Rating List at 31 March 2025
The stock of properties at 31 March 2025 was 2.13 million, equal to 2.13 million at 31 March 2024.
Out of these properties, England accounted for 2 million (94%) of the total, and Wales accounted for the 126 thousand (6%) remaining properties.
The total rateable value of the properties at 31 March 2025 was £70.9 billion, up from £70.7 billion at 31 March 2024.
England accounted for £68.5 billion (97%), and Wales accounted for £2.4 billion (3%).
1.2 The Central Rating List in England and Wales
The central rating list contains the rating assessments of the network property of major transport, utility and telecommunications undertakings and cross-country pipelines.
Rates from central rating list rateable properties in England are paid directly to the Ministry of Housing, Communities and Local Government (MHCLG), and in Wales are paid to the Welsh Government.
The total rateable value of properties on the central list at 31 March 2025 was £4.0 billion, the same level as at 31 March 2024.
The properties in England accounted for £3.8 billion (95%) of this total and in Wales accounted for the remaining £0.2 billion (5%).
The total rateable value of the central list reported in this publication is not directly comparable with the 2017 central list figures reported in the 2023 Revaluation statistical release published in April 2023.
For more information on the Central Rating List, please refer to the Background Information Note.
The remainder of this statistical commentary refers to the local rating list.
2. Changes to stock of property counts in England and Wales
The following section shows the changes to stock of property counts by the reason for the change. This includes changes from the start of the 2023 rating list on 1 April 2023 to 31 March 2025.
Figure 1: Changes to stock of property counts by the reason for the change in England and Wales
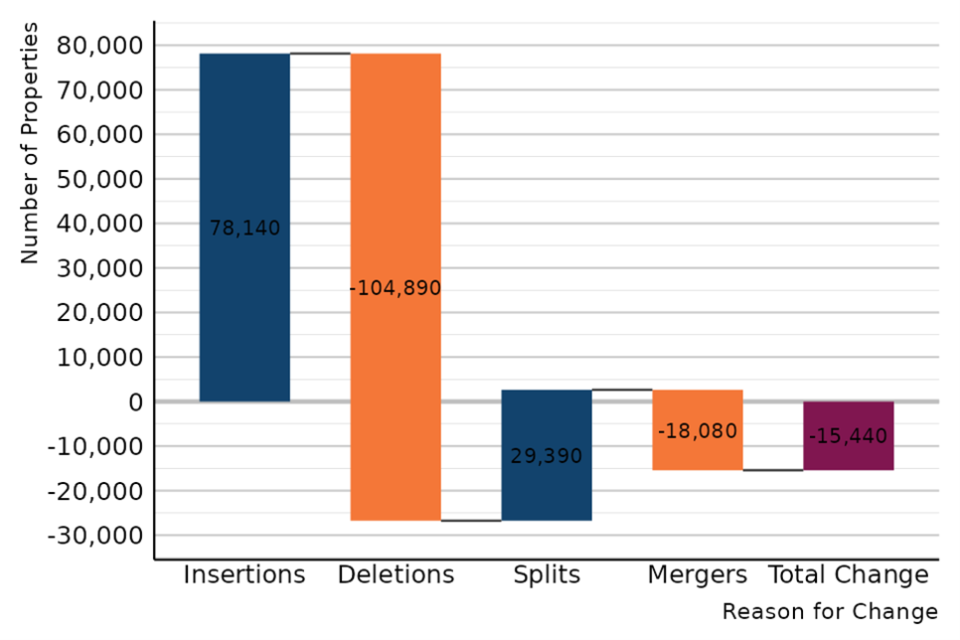
Source: NDR Stock of Properties Changes (Table SOP8.1)
Figure 1 shows the changes to the stock of property counts in England and Wales between 1 April 2023 and 31 March 2025, broken down by the reason for change. Since the start of the 2023 rating list, 107,530 properties have been inserted into the rating list: 78,140 new properties and 29,390 as a result of properties being split into a greater number. There have also been 122,970 properties removed from the rating list: 104,890 deleted properties and 18,080 due to properties merging. This leads to an overall decrease of 15,440 to the total count of stock of properties.
Of the deleted properties, 25,440 (24%) are attributable to self-catering holiday homes following the introduction of the Non-Domestic Rating (Definition of Domestic Property) (England) Order 2022. See the Further Information section for additional details on the statistics of self-catering holiday homes.
Figure 2: Changes to rateable value by the reason for the change in England and Wales
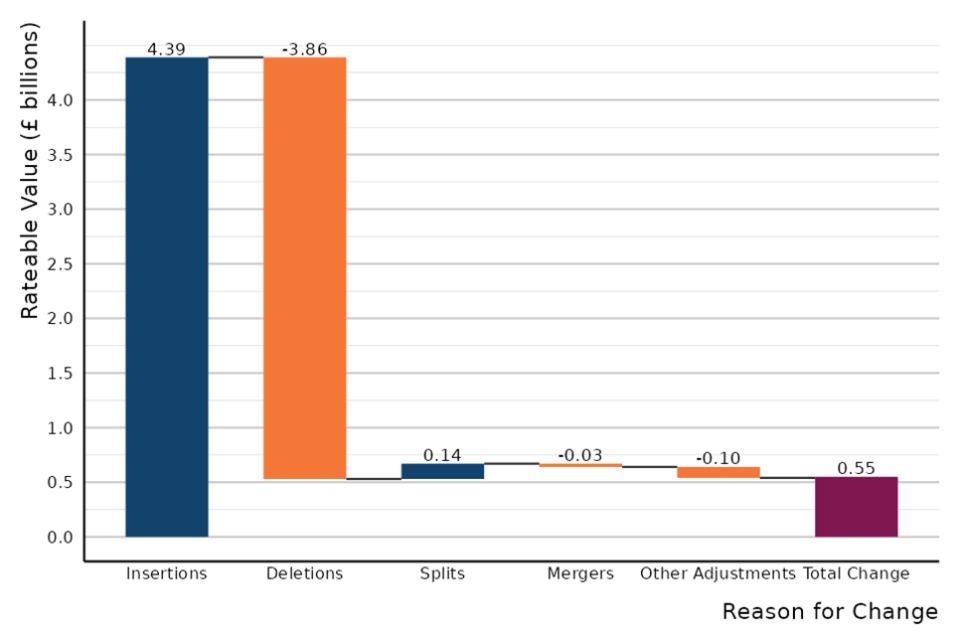
Source: NDR Stock of Properties Changes (Table SOP8.2)
Figure 2 shows the changes to rateable value in England and Wales between 1 April 2023 and 31 March 2025, broken down by the reason for change. Since the start of the 2023 rating list, £4.43 billion of rateable value has been added: £4.39 billion due to insertions and £0.14 billion as a result of properties being split into a greater number. There has also been £3.99 billion of rateable value removed from the rating list: £3.86 billion due to the deletion of properties, £0.03 billion due to properties merging and £0.1 billion from other adjustments. This leads to an overall increase of £0.55 billion to the total rateable value.
3. Time series of the stock of properties in England and Wales
The following section shows the changes to property counts and total rateable value (RV) over time. Each time series covers three distinct Rating Lists (2010, 2017, and 2023) and shows data at 31 March for each year.
Figure 3: Number of rateable properties in England and Wales
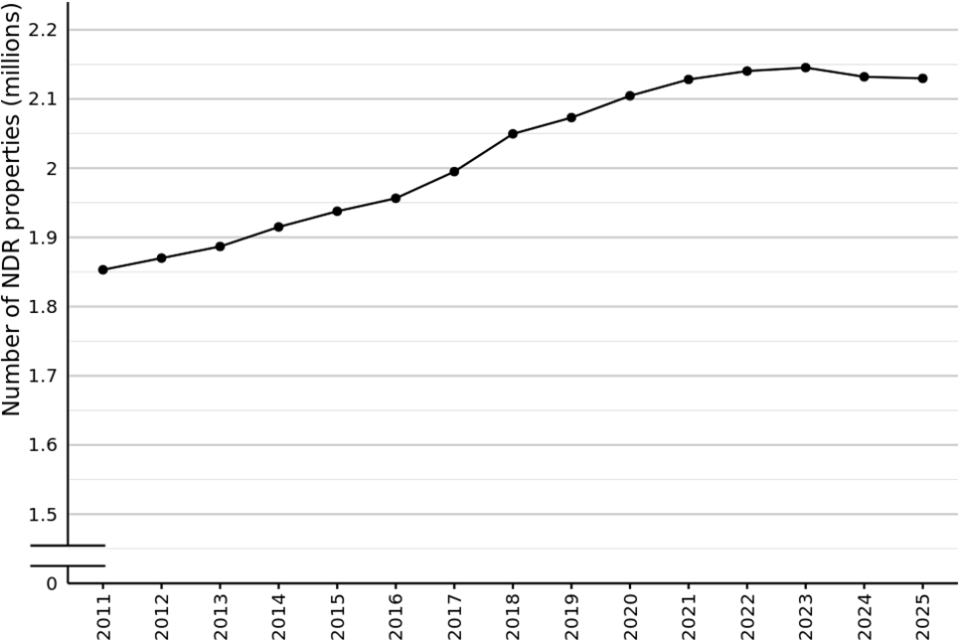
Source: NDR Stock of Properties (Table SOP3.1)
Figure note: The y-axis has been zoomed in so that the change over time is visible
Figure 3 shows the total number of properties in England and Wales at 31 March of each year from 2011 to 2025. The number of properties has been steadily increasing since 31 March 2011: at 31 March 2025 it had increased from 1.85 million to 2.13 million (an increase of 15%). Between 31 March 2024 and 31 March 2025, the number decreased from 2.13 million by 2,270 (less than 1%). A breakdown of the change to stock since the start of the 2023 rating list (1 April 2023) can be seen in figure 1.
Figure 4: Total rateable value in England and Wales
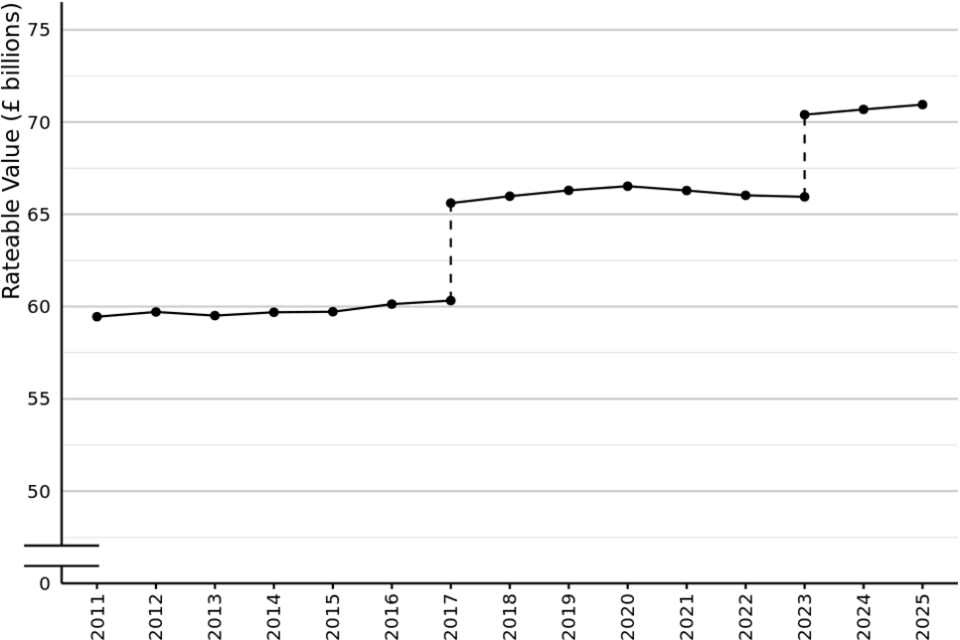
Source: NDR Stock of Properties (Table SOP3.2)
Figure note: The y-axis has been zoomed in so that the trend over time is visible
Figure 4 shows total RV in England and Wales at 31 March of each year from 2011 to 2025. Each dotted line coincides with the end of a revaluation cycle and the introduction of a new Rating List. Between 31 March 2024 and 31 March 2025, RV increased from £70.7 billion by £260 million (less than 1%). Since 1 April 2023 (the start of the 2023 Rating List), total RV has increased by £0.5 billion from £70.4 billion to £70.9 billion. A breakdown of the change to rateable value since the start of the 2023 rating list can been see in figure 2.
3.1 Distribution by sector
‘Sector’ consists of the following categories: Retail, Industrial and Office (RIO), which is a categorisation commonly used by those in the surveying profession. VOA statisticians have, in conjunction with operational colleagues, mapped each SCat code to one of the three categories. The ‘Other’ category was created to cover SCat codes which could not be readily assigned to ‘Retail’, ‘Office’ or ‘Industry’. This includes Assembly and Leisure, Education, Health, Hotels, and Utilities – for more details see Figure 13.
Further detail on sector composition is available in the Background Information document and Metadata files.
Figure 5: Number of rateable properties by sector in England and Wales

Source: NDR Stock of Properties (Tables SOP4.1, SOP5.1, SOP6.1, and SOP7.1)
Figure 5 shows the total number of properties in each sector in England and Wales at 31 March of each year from 2011 to 2025.
Since 31 March 2011:
- the number of properties in the Retail sector has increased by 1%, from 509,080 to 513,340
- the Office sector has increased by 26%, from 341,360 to 430,100 properties
- the Industry sector has increased by 17%, from 482,530 to 562,480
- the Other sector has increased by 20%, from 520,180 to 623,810
Since 31 March 2024:
- the number of properties in the Retail sector has decreased by 1,260 (less than 1%)
- the Office sector has increased by 470 (less than 1%)
- the Industry sector has increased by 2,370 (less than 1%)
- the Other sector has decreased by 3,850 (less than 1%)
Figure 6: Total rateable value by sector in England and Wales
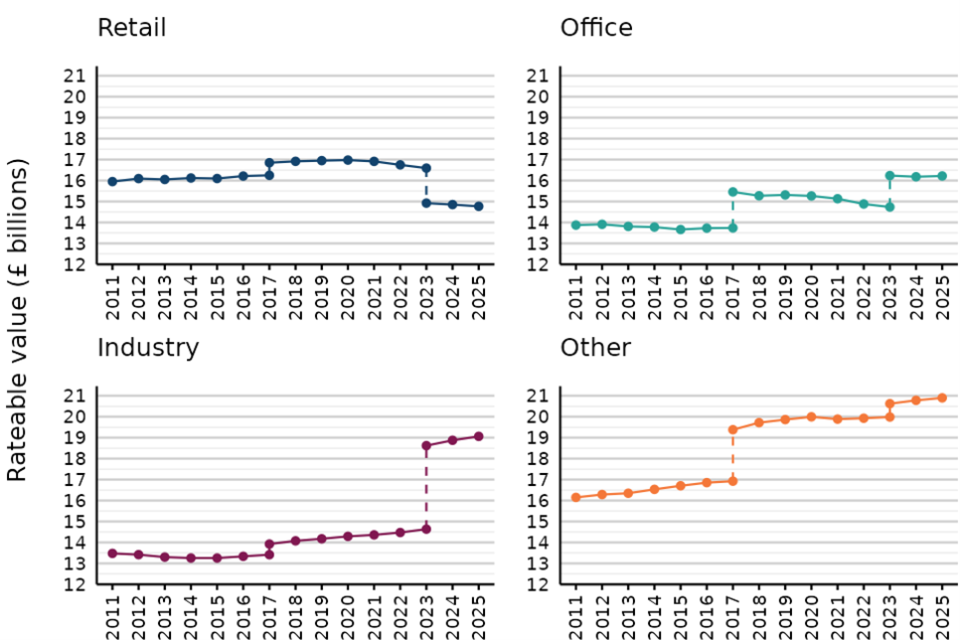
Source: NDR Stock of Properties (Tables SOP4.2, SOP5.2, SOP6.2, and SOP7.2)
Figure 6 shows total RV in each sector in England and Wales at 31 March of each year from 2011 to 2025. Each dotted line coincides with the end of a revaluation cycle and the introduction of a new Rating List. Since 31 March 2018 (the first full year of the 2017 Rating List):
- the total RV for the Retail sector has decreased by 13%, from £16.9 to £14.8 billion
- the Office sector has increased by 6%, from £15.3 to £16.2 billion
- the Industry sector has increased by 35%, from £14.1 to £19.1 billion
- the Other sector has increased by 6%, from £19.7 to £20.9 billion
Since 31 March 2024:
- the total RV for the Retail sector has decreased from £14.9 billion to £14.8 billion
- the Office sector remained the same at £16.2 billion
- the Industry sector has increased from £18.9 billion to £19.1 billion
- the Other sector has increased from £20.8 billion to £20.9 billion
4. The Stock of Properties in England and Wales at 31 March 2025
The following section shows a more detailed view of property counts and total RV at 31 March 2025.
4.1 Distribution by sector
Figure 7: Number of rateable properties by sector in England and Wales
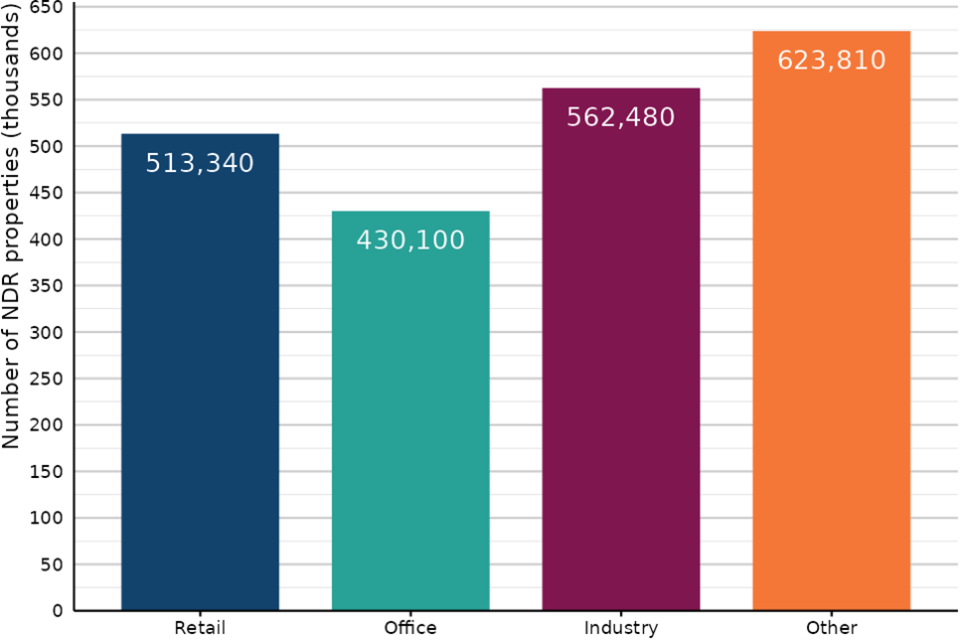
Source: NDR Stock of Properties (Tables SOP4.1, SOP5.1, SOP6.1, and SOP7.1)
Figure note: Counts are rounded to the nearest 10
Figure 7 shows property counts by sector at 31 March 2025. The Other sector had the highest count with 623,810 properties (29% of the total properties). The Office sector had the lowest count with 430,100 properties (20%).
Figure 8: Total rateable value by sector in England and Wales
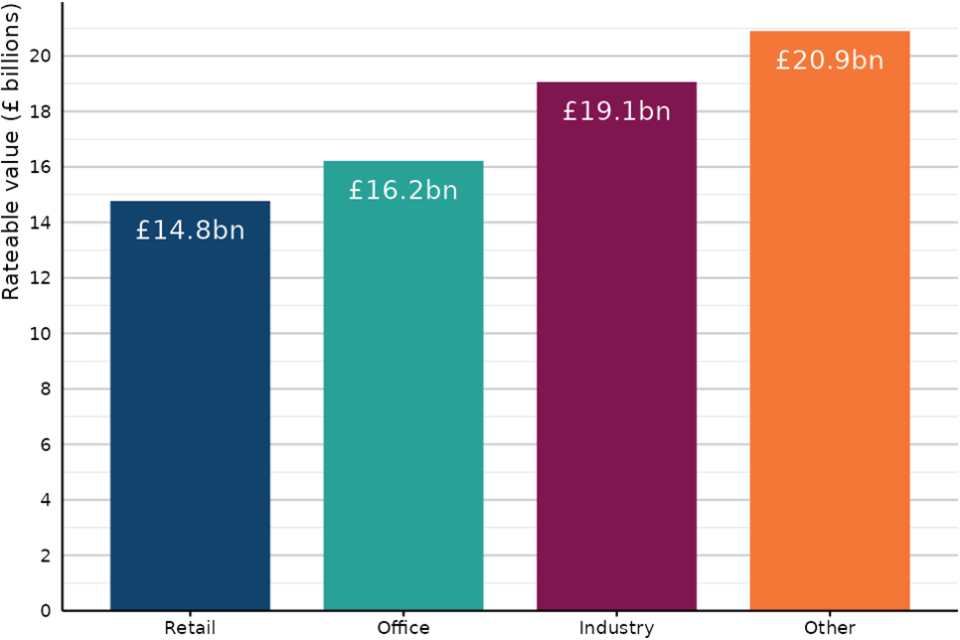
Source: NDR Stock of Properties (Tables SOP4.2, SOP5.2, SOP6.2, and SOP7.2)
Figure note: RV totals are rounded to the nearest £100 million
Figure 8 shows total RV by sector at 31 March 2025. The Other sector had the highest total RV with £20.9 billion (29% of the overall total RV). The Retail sector had the lowest total RV with £14.8 billion (21%).
4.2 Distribution by region
Figure 9: Number of rateable properties by region and sector
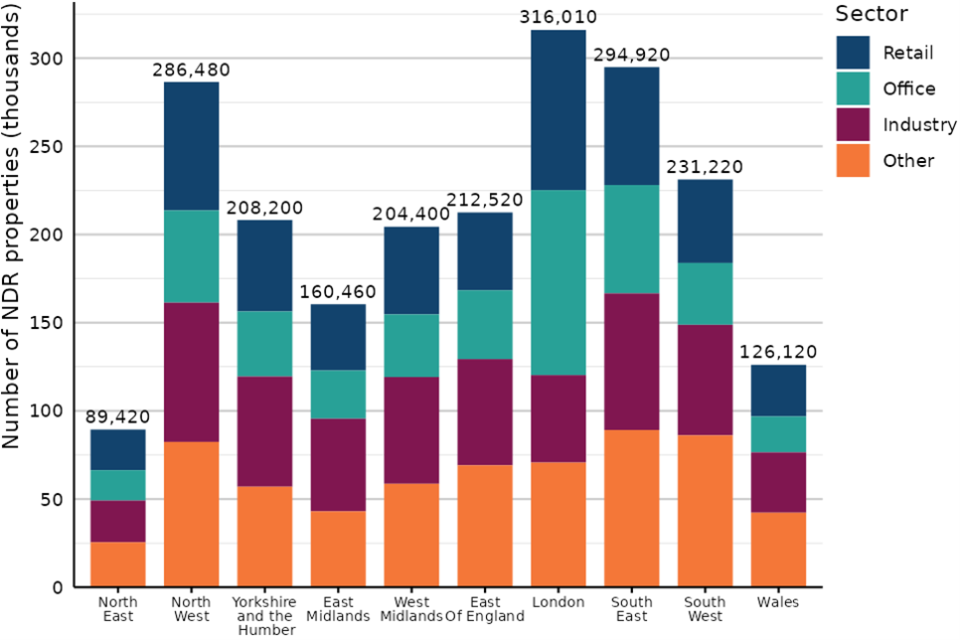
Source: NDR Stock of Properties (Tables SOP4.1, SOP5.1, SOP6.1, and SOP7.1)
Figure note: Counts are rounded to the nearest 10
Figure 9 shows property counts by region and sector at 31 March 2025. London had the highest count with 316,010 properties (15% of the total properties). The North East had the lowest count with 89,420 properties (4%).
Figure 10: Total rateable value by region and sector
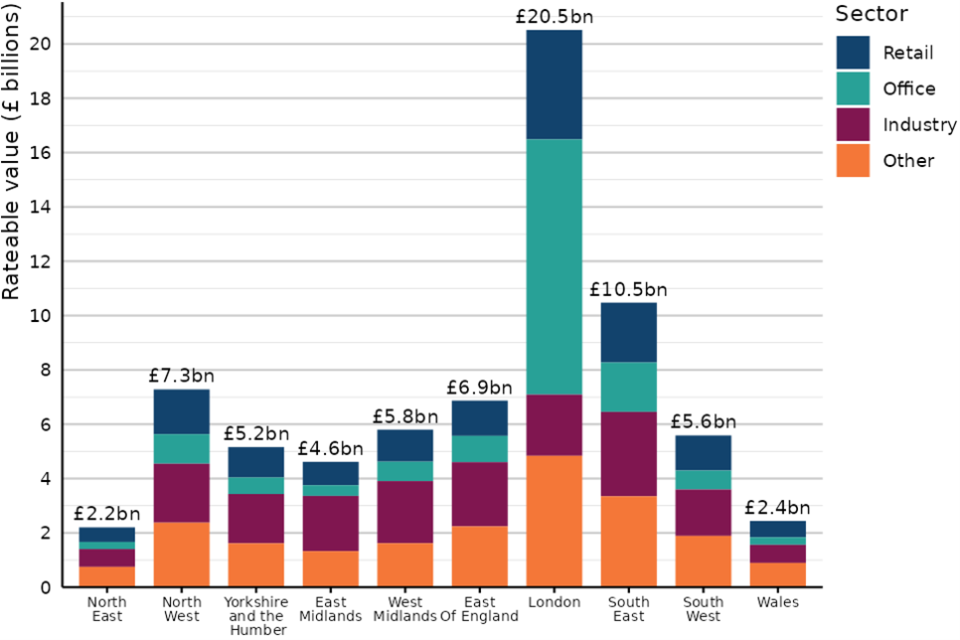
Source: NDR Stock of Properties (Tables SOP4.2, SOP5.2, SOP6.2 & SOP7.2)
Figure note: RV totals are rounded to the nearest £100 million
Figure 10 shows total RV by region and sector at 31 March 2025. London had the highest total RV with £20.5 billion (29% of the overall total RV). The North East had the lowest total RV with £2.2 billion (3%).
4.3 Distribution by rateable value band
Figure 11: Number of rateable properties by rateable value band
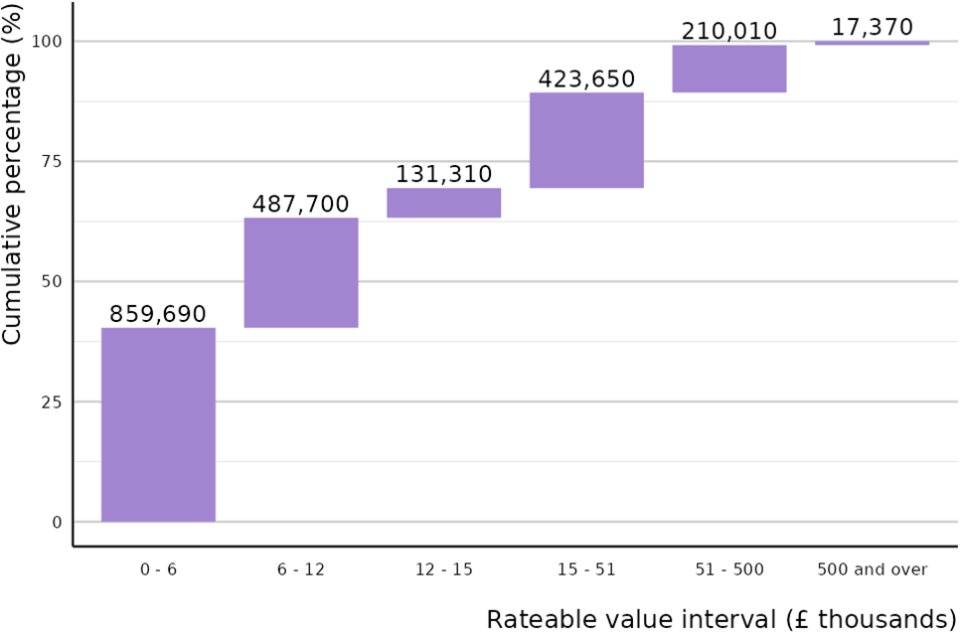
Source: Tables SOP2.1, Stock_SCat1.2, Stock_SCat1.3, Stock_SCat1.4, Stock_SCat1.5 and Stock_SCat1.6
Figure notes: Counts are rounded to the nearest 10. Totals may not sum due to rounding. The Background Information document provides details on the upper and lower limits of rateable value bands.
Figure 11 shows property counts by RV band in England and Wales at 31 March 2025. 63% of properties have a rateable value of £12,000 or less while 37% of properties have a rateable value of over £12,000. The band ranges are not consistent sizes therefore band totals should not be compared directly.
Figure 12: Total rateable value by rateable value band
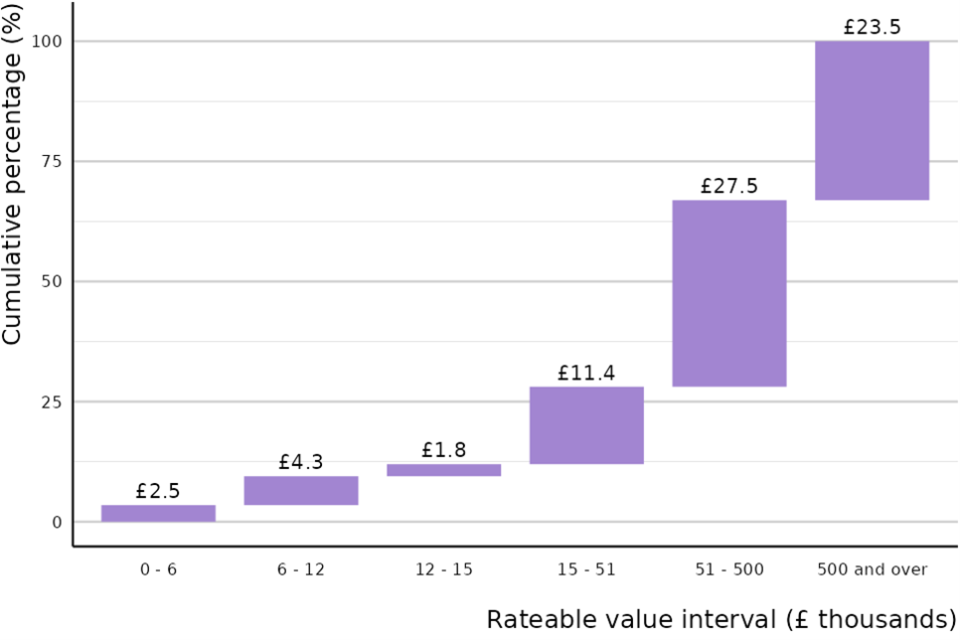
Source: Tables SOP2.1, Stock_SCat1.2, Stock_SCat1.3, Stock_SCat1.4, Stock_SCat1.5 and Stock_SCat1.6
Figure notes: Figures are presented in billions of pounds. Totals may not sum due to rounding. The Background Information document provides details on the upper and lower limits of rateable value bands.
Figure 12 shows rateable value by RV band in England and Wales at 31 March 2025. The RV band with the most RV is £51,000 - £500,000, with 27.5 billion (39% of total RV). 28% of RV lies within the bands less than £51,000, while 33% of RV falls within the band of £500,000 and over. The band ranges are not consistent sizes therefore band totals should not be compared directly.
4.4 Distribution by sub-sector
Figure 13: Number of rateable properties by sector and sub-sector in England and Wales
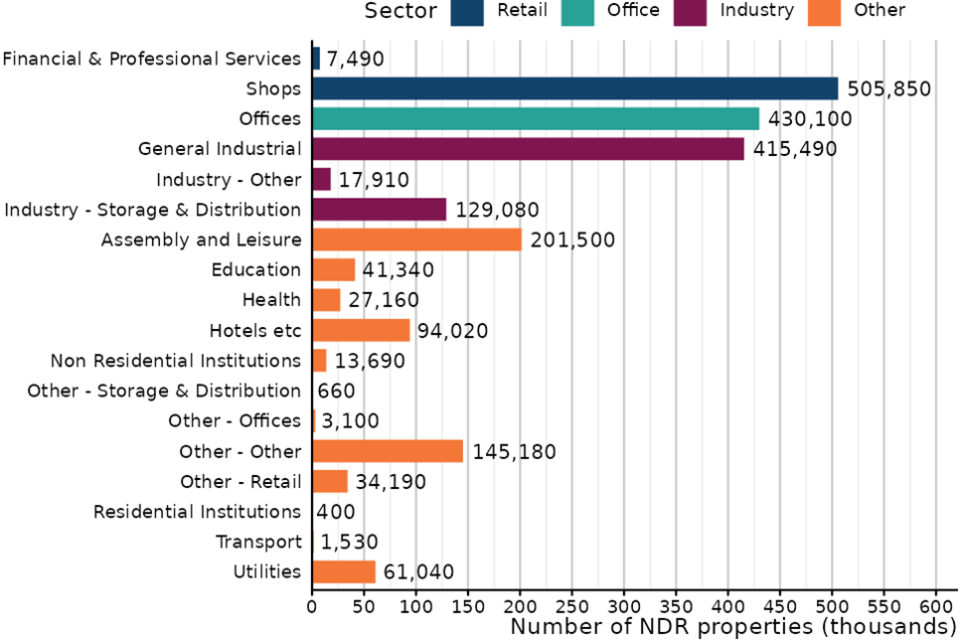
Source: Stock SCat, 2025 (Table_Stock_SCat1.1)
Figure note: Counts are rounded to the nearest 10
Figure 13 shows property counts by sub-sector in England and Wales at 31 March 2025. The sub-sector with the most properties was Shops with 505,850. The sub-sector with the fewest properties was Residential Institutions with 400.
Figure 14: Total rateable value by sector and sub-sector in England and Wales
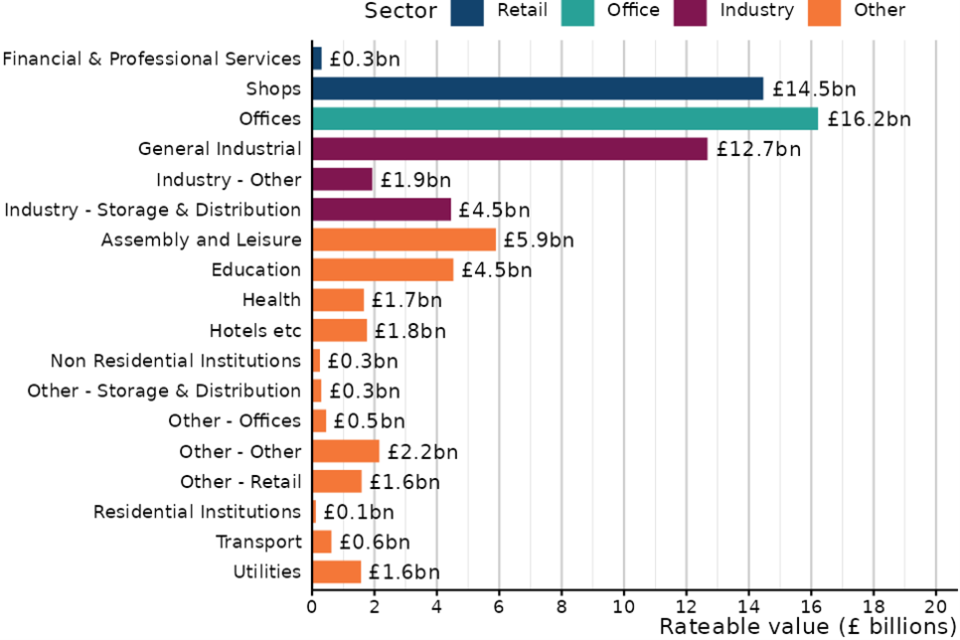
Source: Stock SCat, 2025 (Table_Stock_SCat1.1)
Figure note: RV totals are rounded to the nearest £100 million
Figure 14 shows total RV by sub-sector in England and Wales at 31 March 2025. The sub-sector with the highest RV was Offices with £16.2 billion. The sub-sector with the lowest RV was Residential Institutions with £121.2 million.
5. Further Information
In December 2024, VOA published an ad hoc release relating to holiday lets in England and Wales.
We recognise this area is of interest to users of both our council tax and non-domestic rates statistics and the analysis provides an explanation and provisional best estimate of holiday let properties moving between the council tax and non-domestic rating lists between 2019-20 and 2023-24.
More information about this release can be found in the Background Information document
Further information on the area codes used in this can be found on the ONS website
More information on statistics at the VOA can be found on the Agency’s website: About VOA statistics
Timings of future releases are regularly placed on the VOA research and statistics calendar
We will keep the format of this document under review to continue improving the presentation of our statistics, and welcome feedback from users on the value of the information provided in this commentary – please forward any comments to the Statistics inbox.