Non-domestic rating: challenges and changes statistical commentary
Published 18 May 2023

© Crown copyright 2023
This publication is licensed under the terms of the Open Government Licence v3.0 except where otherwise stated. To view this licence, visit nationalarchives.gov.uk/doc/open-government-licence/version/3 or write to the Information Policy Team, The National Archives, Kew, London TW9 4DU, or email: psi@nationalarchives.gov.uk.
Where we have identified any third party copyright information you will need to obtain permission from the copyright holders concerned.
This publication is available at https://www.gov.uk/government/statistics/non-domestic-rating-challenges-and-changes-2017-rating-list-march-2023/non-domestic-rating-challenges-and-changes-statistical-commentary
About this release:
This release includes statistics on challenges made by taxpayers (or their representatives) against the England and Wales 2017 non-domestic rating (NDR) list up to 31 March 2023. It also includes statistics on reviews of rating assessments (known as “reports”) that have either been initiated by the Valuation Office Agency (VOA) or a Billing Authority, when new information becomes available.
These statistics do not include the number of appeals registered under the Check, Challenge, Appeal (CCA) system in England because these are the responsibility of the independent Valuation Tribunal Service (VTS), however, the VTS publish their latest statistics on their website.
The 2017 rating list closed on 31 March 2023 and the 2023 rating list came into effect on 1 April 2023. This has resulted in a large increase in the number of customer registrations for the CCA process in England and Wales. There has also been an increase in Checks received through the CCA system in England, and challenges received in Wales this quarter ahead of the closure of the 2017 rating list. Due to the lag between Checks and Challenges in the CCA process we would not expect to see an increase in Challenges in England until the next quarter.
Responsible Statistician
Anna McReady
Statistical enquiries
Date of next publication
August 2023
1. Headline figures
1.1. Checks and Challenges for England across all quarters (1 April 2017 to 31 March 2023) against the 2017 non-domestic rating list
The total number of Checks registered in England under the Check, Challenge, Appeal (CCA) system was 845,670.
The total number of Challenges registered in England under the CCA system was 141,410. It is estimated that 55,570 of these Challenges were made as a result of Covid-19 restrictions being imposed.
In addition:
-
748,050 Checks have been resolved
-
110,380 Challenges have been resolved; of these, an estimated 51,560 were related to Covid-19 restrictions being imposed
-
18,390 Challenges have been marked as incomplete; of these, an estimated 4,010 were related to Covid-19 restrictions being imposed
-
266,220 Interested Persons (IPs) and 18,450 agents had registered to use the Check and Challenge service
-
the VOA has approved 729,320 property claims by businesses
1.2. Checks and Challenges for England in this quarter (1 January to 31 March 2023) against the 2017 non-domestic rating list
The number of Checks registered in England from 1 January to 31 March 2023 was 132,690 up from 19,660 in the previous quarter (1 October to 31 December 2022).
The number of Challenges registered in England from 1 January to 31 March 2023 was 5,060 up from 4,360 in the previous quarter.
In addition:
-
45,680 Checks were resolved, up from 20,610 in the previous quarter
-
4,340 Challenges were resolved, up from 3,750 in the previous quarter
-
97,610 Checks were outstanding on 31 March 2023, up from 10,610 at the end of the previous quarter
-
12,630 Challenges were outstanding on 31 March 2023, down from 13,040 at the end of the previous quarter
1.3. Challenges for Wales in this quarter (1 January to 31 March 2023) against the 2017 non-domestic rating list
The number of challenges registered in Wales from 1 January to 31 March 2023 was 2,320 up from 790 in the previous quarter.
The number of challenges resolved in Wales from 1 January to 31 March 2023 was 1,020 down from 6,380 in the previous quarter.
The number of challenges outstanding in Wales at 31 March 2023 was 7,840 up from 6,540 in the previous quarter.
1.4. Appeals outstanding from the 2010 non-domestic rating list for England and Wales at 31 March 2023:
The number of appeals outstanding for the 2010 list at 31 March 2023 was 3,460 down from 4,840 at 31 December 2022.
These include those awaiting listing, relisting, or decisions from the Valuation Tribunal, which the VOA do not control, and also some highly complex cases relating to specialist properties where a longer time frame is necessary to settle the appeals.
2. Checks, Challenges and Changes against the England 2017 rating list
There was a spike in the use of VOA services during the Covid-19 pandemic, which is reflected in the statistics shown in this release.
Before anyone can access more detailed valuation data about a property, they must prove that they have a legal interest in the property under the non-domestic rating legislation, for example, as an owner or occupier or both. To do this, they are required to register to use the CCA system and then can ‘claim their property’ through the VOA’s online service by providing proof of their relationship to the property, such as a copy of a business rates or utility bill. Once the VOA confirm the interested person’s relationship to the property, the claim is approved, and the interested person is able to view or request the detailed valuation for that property. The interested party can then start the CCA process. More information is available on GOV.UK.
Figure 1: Customer registrations by customer type and month, 1 April 2017 to 31 March 2023
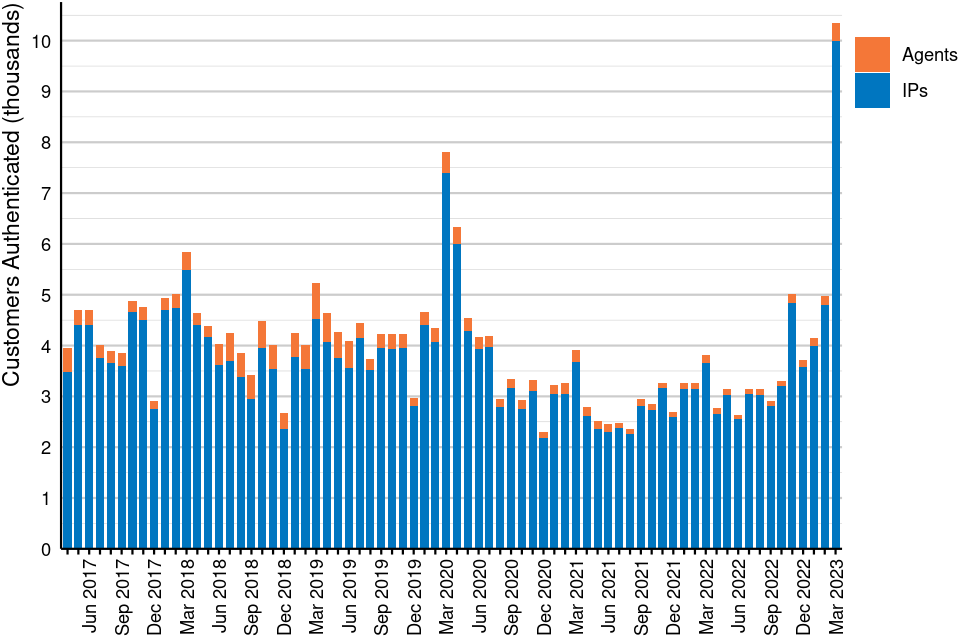
Source: Checks, Challenges and Changes against the 2017 local rating list, England (Table 1.2)
The number of interested persons (IPs) and agents registering for CCA each month is shown in Figure 1. More than 90% of customer registrations are from interested persons rather than agents.
A seasonal pattern is visible in the graph; customer registrations are generally higher at the start of the year and gradually decrease as the year goes on. In March and April 2020 there were 14,140 customer registrations, which is a spike attributable to the Covid-19 pandemic. Following this spike, the number of customer registrations steadily decreased.
The recent business rates revaluation saw an increase in the number of customer registrations following the publication of the 2023 draft rating lists on 17 November 2022. Further increases in customer registrations were seen between January and March 2023, particularly in March ahead of the 2023 rating lists coming into effect on 1 April 2023.
From 1 April 2023 ratepayers in Wales were also required to follow the CCA process to challenge a property on the 2023 rating list. Customers were able to register for CCA before 1 April, therefore the data shown in the graph for recent months may include customer registrations relating to properties in Wales as well as England.
Figure 2: Approved property claims by month, 1 April 2017 to 31 March 2023
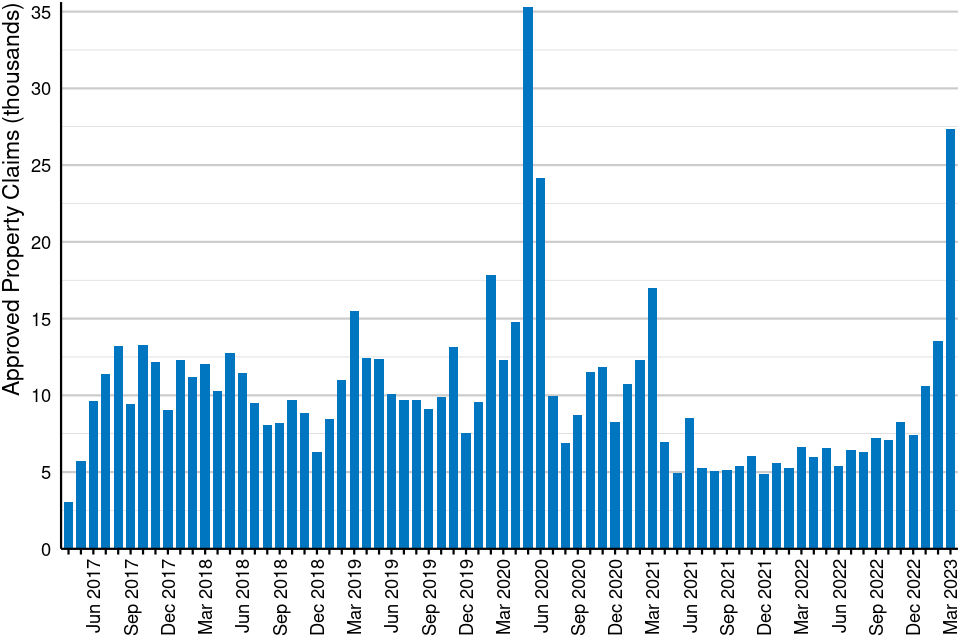
Source: Checks, Challenges and Changes against the 2017 local rating list, England (Table 1.3)
The number of approved property claims by month is shown in Figure 2. In the period May to June 2020 there were 59,400 approved property claims. This spike in approved property claims was due to the Covid-19 pandemic. The difference from the March to April 2020 spike shown in Figure 1 reflects the time it takes for a customer registering for CCA to claim a property and then have their claim approved by a Valuation Officer. In March 2023 there was another spike in approved property claims prior to the closure of the 2017 list on 31 March.
Figure 3: Checks against the England 2017 NDR list by case status and month, 1 April 2017 to 31 March 2023
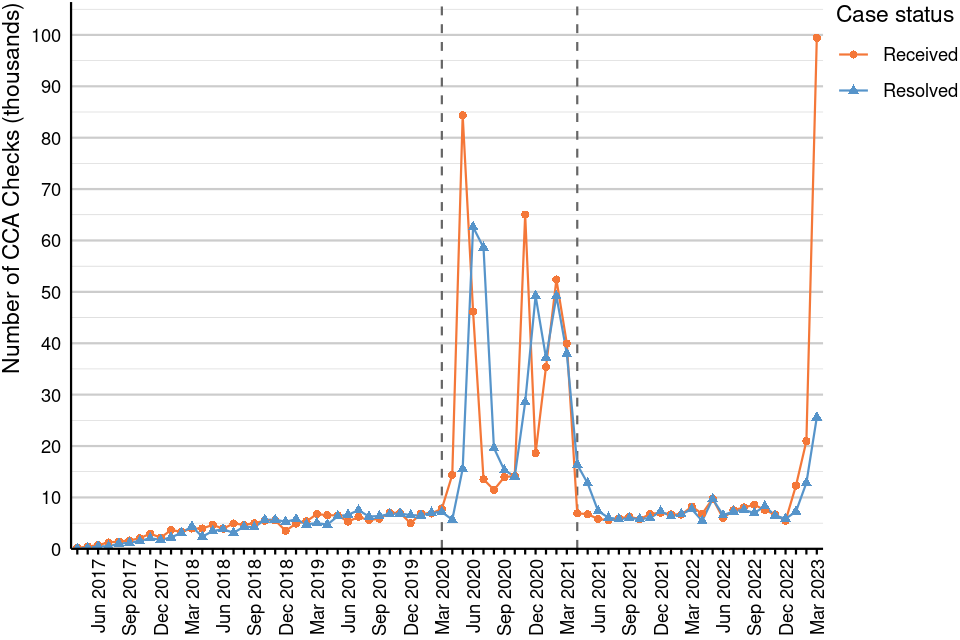
Source: Checks, Challenges and Changes against the 2017 local rating list, England (Tables 2.1 and 2.2)
Figure notes: Between late March 2020, when the first national lockdown was announced, and 8 March 2021, when a phased exit from lockdown began, a range of national and local Covid-19 restrictions were in place in England at various times. This period is indicated by the vertical dashed lines.
Figure 3 shows the number of Checks received and resolved each month. The spikes seen in mid-2020 and November 2020 to February 2021 are a result of the Covid-19 pandemic and the Government-imposed restrictions on business; see figure notes. The spike in Checks received and resolved from January to March 2023 is a result of an increase in the number of customers submitting Checks prior to the 2017 list closure on 31 March.
Figure 4: Challenges against the England 2017 NDR list by case status and month, 1 April 2017 to 31 March 2023
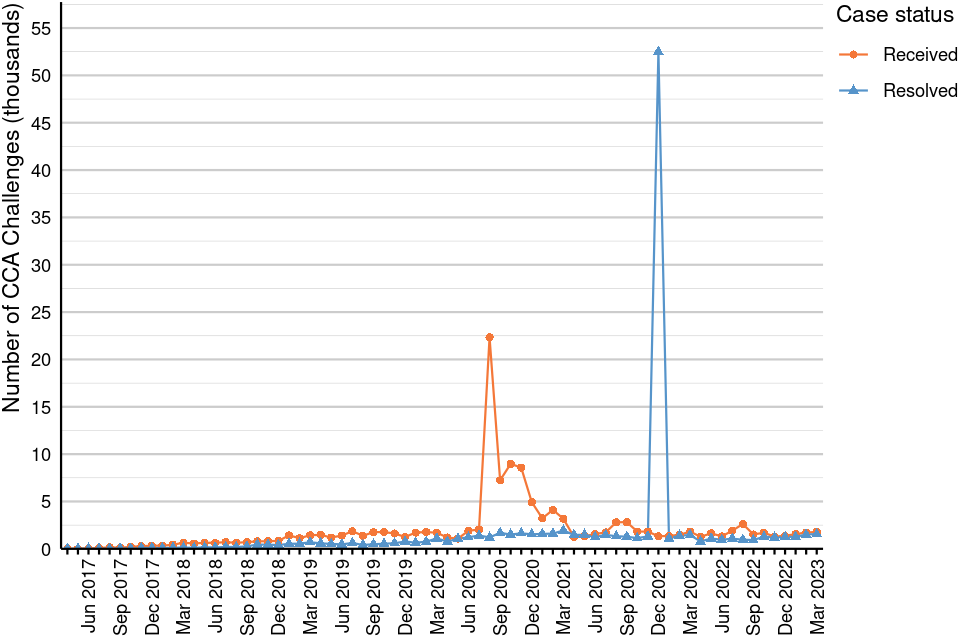
Source: Checks, Challenges and Changes against the 2017 local rating list, England (Tables 2.1 and 2.2)
Figure 4 shows the number of CCA Challenges received by month and case status. The month with the highest number of Challenges received was August 2020, when the VOA received 22,330 Challenges; this was a consequence of the prior rise seen in Checks (Figure 3) and is attributable to the Covid-19 pandemic. The VOA resolved 52,490 Challenges in December 2021, a figure which is around 30 times the average number of Challenges resolved in all previous months, as a result of the enactment of the Rating (Coronavirus) and Directors Disqualification (Dissolved Companies) Act 2021. For further details please refer to Non-domestic Rating: Challenges and Changes, 2017 Rating List, March 2022.
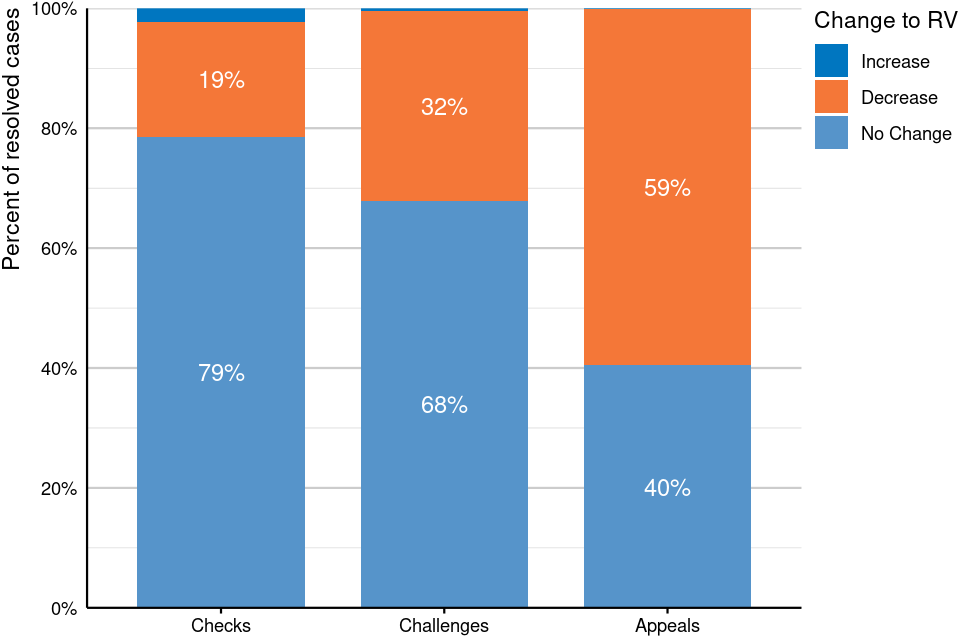
Figure 5: Resolved CCA cases by case type and outcome against the England 2017 NDR list, 1 April 2017 to 31 March 2023
Source: Checks, Challenges and Changes against the 2017 local rating list, England (Table 3.1)
Table 1: Resolved CCA cases by case type and outcome against the England 2017 NDR list, 1 April 2017 to 31 March 2023
| Case type | Increase | Decrease | No Change |
|---|---|---|---|
| Checks | 16,570 | 143,570 | 587,920 |
| Challenges | 510 | 34,900 | 74,970 |
| Appeals | – | 910 | 620 |
Source: Checks, Challenges and Changes against the 2017 local rating list, England (Table 3.1)
Table notes: Counts are rounded to the nearest 10 with counts fewer than 5 reported as negligible and denoted by ‘–’
Figure 5 and Table 1 show breakdowns for the outcome (change to rateable value (RV)) of resolved CCA cases by case type. The highest percentage of cases resulting in no change to the RV was in Checks, with 79% (587,920 cases), followed by Challenges (68%, 74,970 cases) and then Appeals (40%, 620 cases). For cases resulting in an RV decrease, the highest percentage was in Appeals, with 59% (910 cases), followed by Challenges (32%, 34,900 cases) and then Checks (19%, 143,570 cases). Cases resulting in an RV increase made up 2% of Checks, less than 1% of Challenges and less than 1% of Appeals.
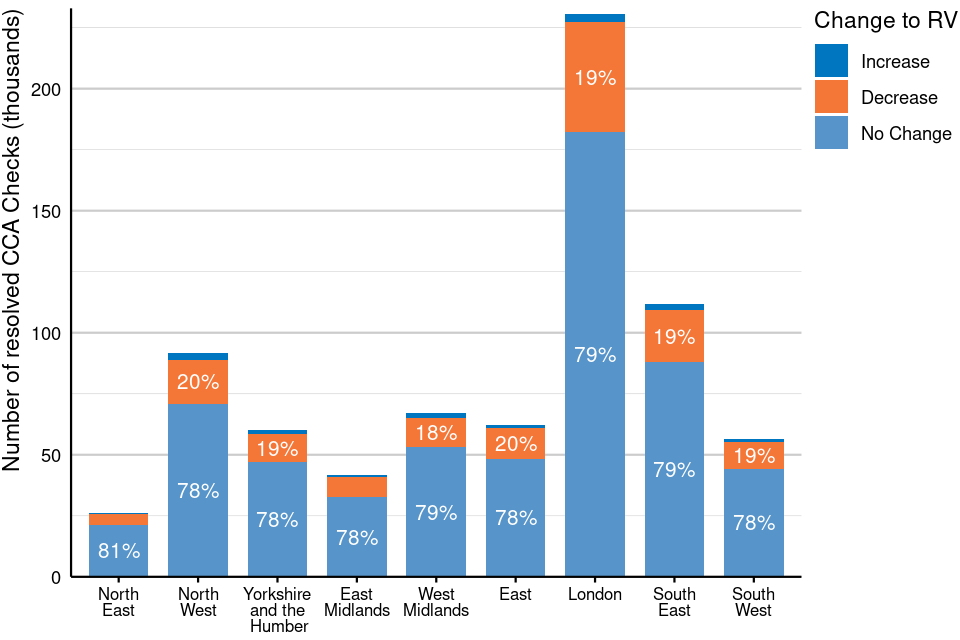
Figure 6: Resolved CCA Checks by region and outcome against the England 2017 NDR list, 1 April 2017 to 31 March 2023
Source: Checks, Challenges and Changes against the 2017 local rating list, England (Table 3.1)
Figure notes: Please note that the percentage labels in most of the bars are only displayed for the outcomes of ‘No change’ and ‘Decrease’. Therefore, the percentages will not sum to 100% for each region.
Table 2: Resolved CCA Checks by region and outcome against the England 2017 NDR list, 1 April 2017 to 31 March 2023
| Region | Increase | Decrease | No Change |
|---|---|---|---|
| North East | 630 | 4,250 | 21,320 |
| North West | 2,650 | 17,870 | 71,010 |
| Yorkshire and the Humber | 1,650 | 11,520 | 47,000 |
| East Midlands | 1,020 | 8,290 | 32,550 |
| West Midlands | 1,740 | 12,240 | 53,020 |
| East | 1,340 | 12,500 | 48,310 |
| London | 3,510 | 44,860 | 182,250 |
| South East | 2,620 | 21,150 | 88,090 |
| South West | 1,420 | 10,880 | 44,370 |
Source: Checks, Challenges and Changes against the 2017 local rating list, England (Table 3.1)
Table notes: Counts are rounded to the nearest 10
Figure 6 and Table 2 show the number of resolved CCA Check cases by geographical region and their outcome. The distribution of Check cases resulting in no change to RV, RV decreases and RV increases was fairly uniform across all of the regions; the outcome of no change to RV ranged between 78% in the North West to 81% in the North East.
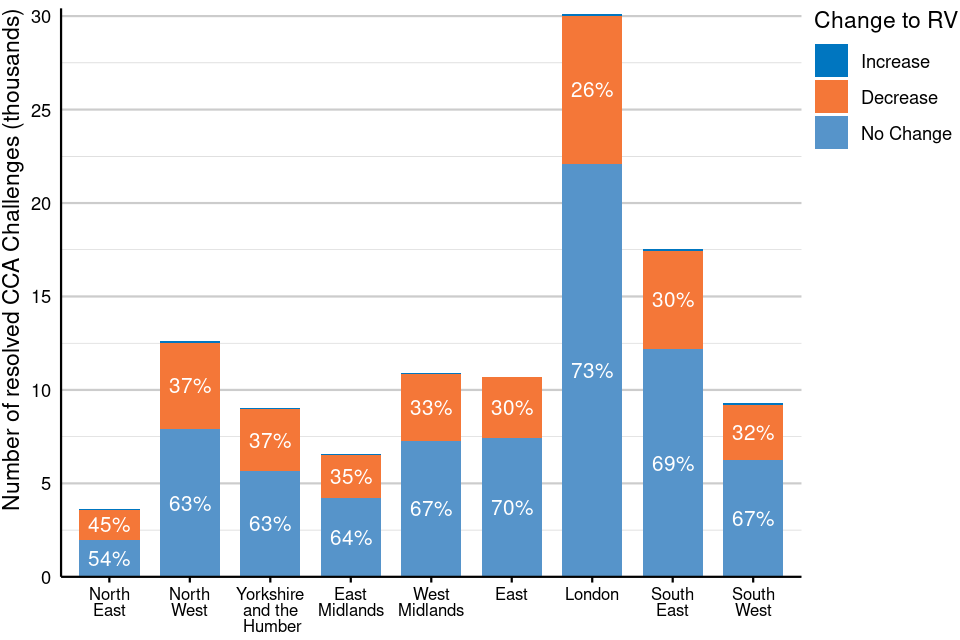
Figure 7: Resolved CCA Challenges by region and outcome against the England 2017 NDR list, 1 April 2017 to 31 March 2023
Source: Checks, Challenges and Changes against the 2017 local rating list, England (Table 3.1)
Figure notes: Please note that the percentage labels are only displayed for the outcomes of ‘No change’ and ‘Decrease’. Therefore, the percentages will not sum to 100% for each region.
Table 3: Resolved CCA Challenges by region and outcome against the England 2017 NDR list, 1 April 2017 to 31 March 2023
| Region | Increase | Decrease | No Change |
|---|---|---|---|
| North East | 20 | 1,630 | 1,960 |
| North West | 70 | 4,650 | 7,890 |
| Yorkshire and the Humber | 50 | 3,310 | 5,660 |
| East Midlands | 40 | 2,330 | 4,210 |
| West Midlands | 50 | 3,570 | 7,290 |
| East | 30 | 3,230 | 7,450 |
| London | 90 | 7,950 | 22,080 |
| South East | 100 | 5,270 | 12,180 |
| South West | 70 | 2,960 | 6,260 |
Source: Checks, Challenges and Changes against the 2017 local rating list, England (Table 3.1)
Table notes: Counts are rounded to the nearest 10
Figure 7 and Table 3 show the number of resolved CCA Challenge cases by geographical region and their outcome. For Challenges, the outcome of no change to RV ranged from 54% in the North East to 73% in London.
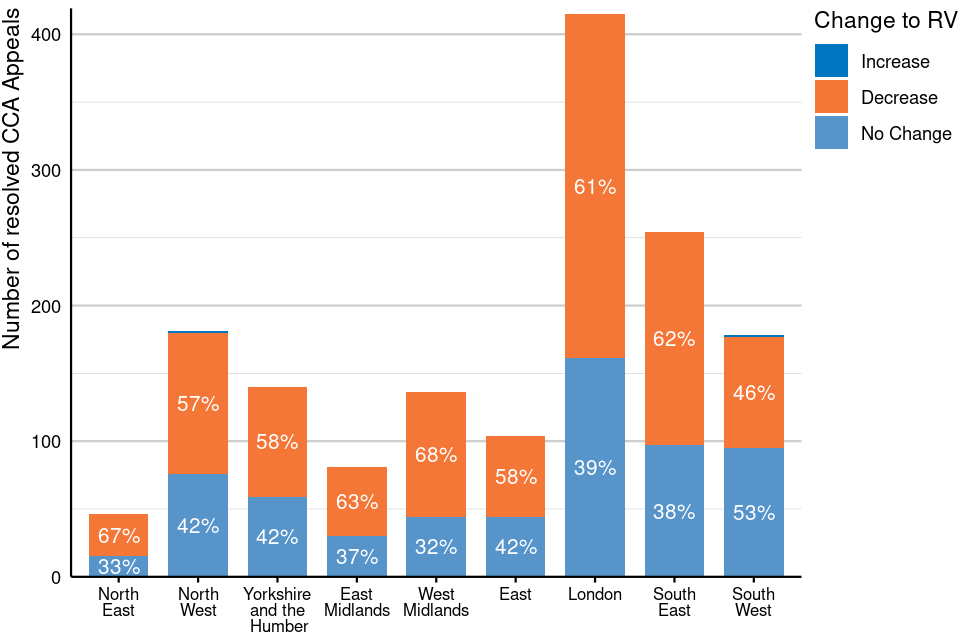
Figure 8: Resolved CCA Appeals by region and outcome against the England 2017 NDR list, 1 April 2017 to 31 March 2023
Source: Checks, Challenges and Changes against the 2017 local rating list, England (Table 3.1)
Figure notes: Please note that the percentage labels in most of the bars are only displayed for the outcomes of ‘No change’ and ‘Decrease’. Therefore, the percentages will not sum to 100% for each region.
Table 4: Resolved CCA Appeals by region and outcome against the England 2017 NDR list, 1 April 2017 to 31 March 2023
| Region | Increase | Decrease | No Change |
|---|---|---|---|
| North East | 0 | 30 | 20 |
| North West | – | 100 | 80 |
| Yorkshire and the Humber | 0 | 80 | 60 |
| East Midlands | 0 | 50 | 30 |
| West Midlands | 0 | 90 | 40 |
| East | 0 | 60 | 40 |
| London | 0 | 250 | 160 |
| South East | 0 | 160 | 100 |
| South West | – | 80 | 100 |
Source: Checks, Challenges and Changes against the 2017 local rating list, England (Table 3.1)
Table notes: Counts are rounded to the nearest 10 with counts of 0 being reported as 0 and counts fewer than 5 reported as negligible and denoted by ‘–’
Figure 8 and Table 4 show the number of resolved CCA Appeal cases by geographical region and their outcome. For Appeals, the outcome of no change to RV ranged between 32% in the West Midlands to 53% in the South West.
Figure 9: Assessment Reviews against the England 2017 NDR list by case status and quarter, 1 April 2017 to 31 March 2023
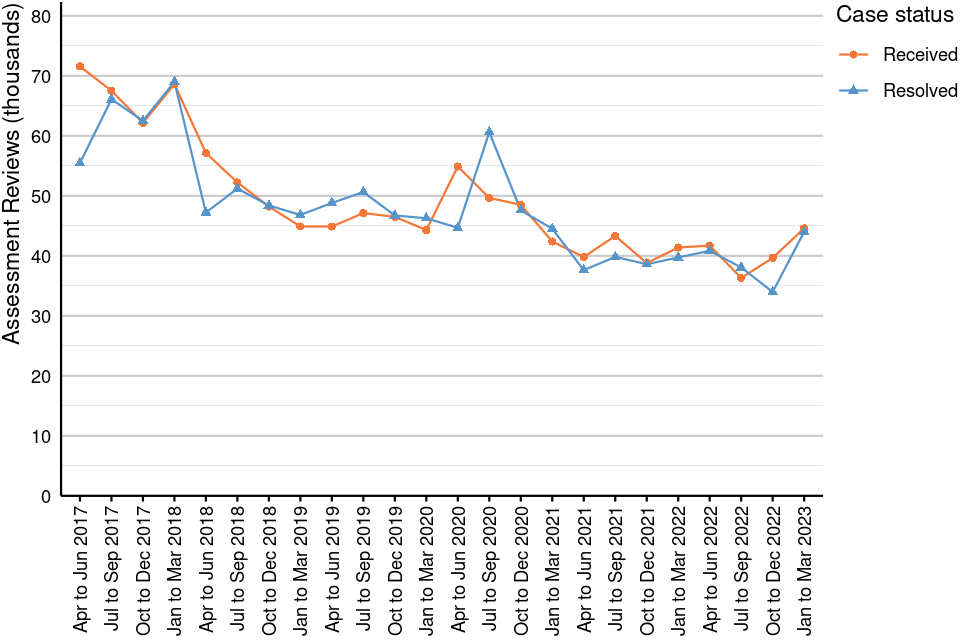
Source: Checks, Challenges and Changes against the 2017 local rating list, England (Tables 4.1 and 4.2)
Figure 9 shows that the number of assessment reviews received and resolved against the England 2017 list. In general, the trend shows that the number of assessment reviews has been decreasing since the start of the list; however, there was a brief spike in 2020, likely due to the Covid-19 pandemic.
3. Challenges and Changes against the Wales 2017 rating list
For Wales, a challenge is defined as a proposal by the ratepayer to alter the rating list, typically attributable to a challenge to the assessed rateable value or a change of circumstance of the property as well as physical changes in the locality.
Figure 10: Challenges against the Wales 2017 NDR list by case status and quarter, 1 April 2017 to 31 March 2023
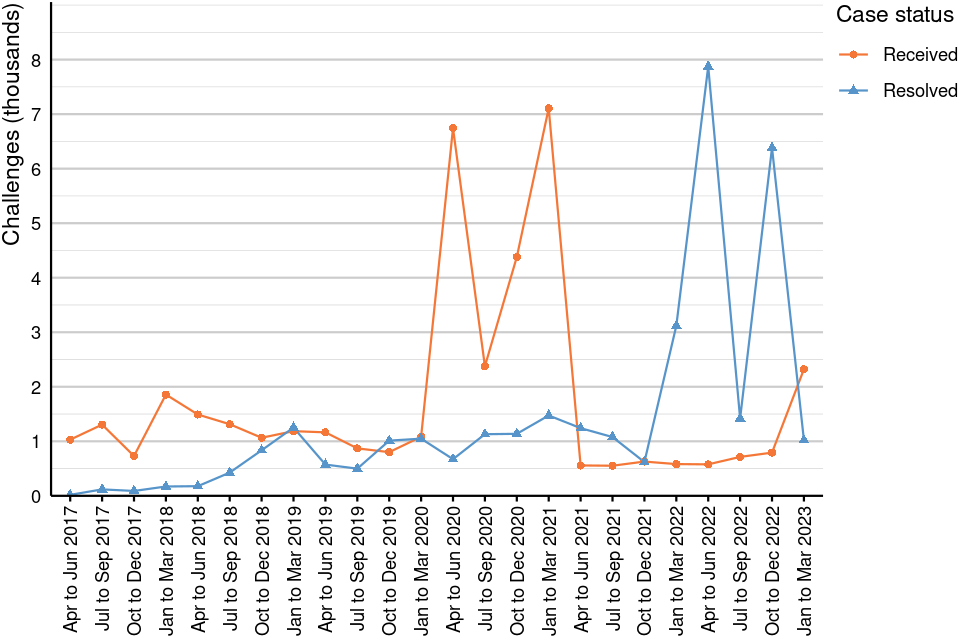
Source: Challenges and Changes against the 2017 local rating list, Wales (Tables 1.1 and 1.2)
Figure 10 shows the number of challenges received against the Wales 2017 list. The number of challenges received remained low following the rise in challenges received due to the Covid-19 pandemic but has seen an increase from January to March 2023. The number of challenges resolved was at its highest in the quarter to June 2022, with a second spike in challenges resolved seen in the quarter to December 2022. These increases are the result of Covid-19 related cases being withdrawn.
In Wales, 27,710 challenges were received between 1 March 2020 and 31 March 2023, approximately 16,560 of which were related to Covid-19 restrictions. The Rating (Coronavirus) and Directors Disqualification (Dissolved Companies) Act 2021 states that measures brought in as a result of coronavirus will not be considered a Material Change of Circumstances (MCC). This means that Challenges in England and Wales based on the effect of these measures will not see a change in rateable value. The VOA have been contacting ratepayers in Wales asking them to withdraw their cases, which results in no change to rateable value. At 31 March 2023, 16,330 of these challenges had been withdrawn.
Figure 11: Assessment Reviews against the Wales 2017 NDR list by case status and quarter, 1 April 2017 to 31 March 2023
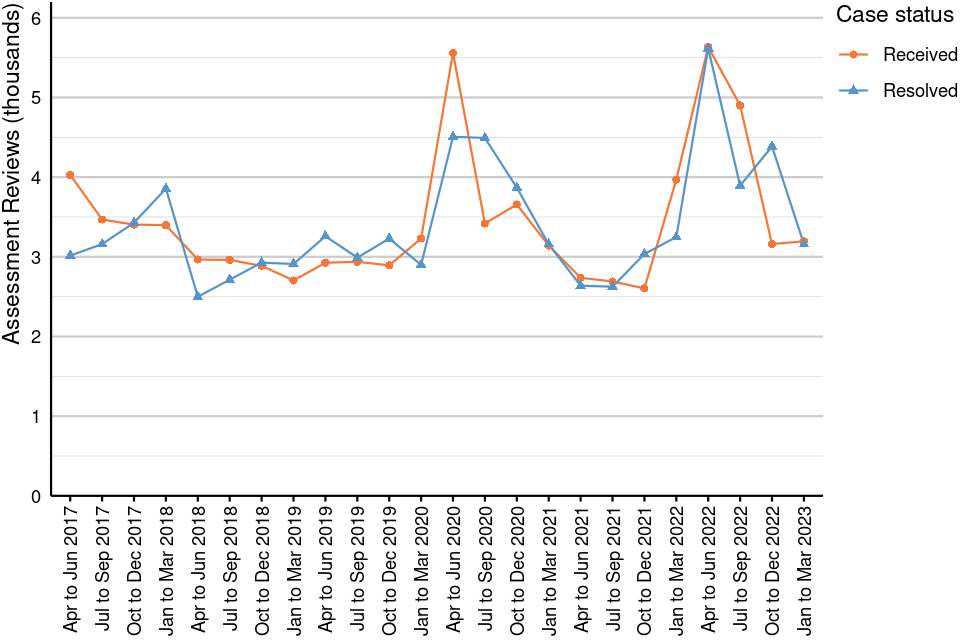
Source: Challenges and Changes against the 2017 local rating list, Wales (Tables 3.1 and 3.2)
Figure 11 shows the number of assessment reviews received and resolved against the Wales 2017 list. Assessment reviews received and resolved were at their highest in the quarter to June 2022. This increase is the result of a review of self-catering properties in Wales for the purpose of Revaluation 2023. The issuing of the forms of return commenced in April 2021 with the review undertaken between January and April 2022. A report is raised for each property to be reviewed; if it is found that the property does not meet the criteria to be classed as self-catering a further report is raised to move it out of Rating and into the Council Tax list.
Further to the aforementioned review for the purpose of supporting Revaluation 2023, the VOA has from April 2022 commenced a two-yearly rolling review of self-catering properties in Wales.
4. Further Information
More information about this release can be found in the Background Information document.
More detailed information on the 2017 local rating list is available at gov.uk/find-business-rates.
Further information on the area codes used in this can be found on the ONS website.
More information on statistics at the VOA can be found on the Agency’s website: About VOA statistics.
Timings of future releases are regularly placed on the VOA research and statistics calendar.
We will keep the format of this document under review to continue improving the presentation of our statistics, and welcome feedback from users on the value of the information provided in this commentary – please forward any comments to the Statistics Inbox.