Nationality at point of National Insurance number registration of DWP working age benefit recipients: data to November 2020
Published 26 August 2021

© Crown copyright 2021
This publication is licensed under the terms of the Open Government Licence v3.0 except where otherwise stated. To view this licence, visit nationalarchives.gov.uk/doc/open-government-licence/version/3 or write to the Information Policy Team, The National Archives, Kew, London TW9 4DU, or email: psi@nationalarchives.gov.uk.
Where we have identified any third party copyright information you will need to obtain permission from the copyright holders concerned.
This publication is available at https://www.gov.uk/government/statistics/nationality-at-point-of-national-insurance-number-registration-of-dwp-working-age-benefit-recipients-data-to-november-2020/nationality-at-point-of-national-insurance-number-registration-of-dwp-working-age-benefit-recipients-data-to-november-2020
This annual statistical summary provides a count of claimants receiving one or more Department for Work and Pensions (DWP) Working Age (WA) benefits broken down by nationality.
These statistics are sourced by combining the WA benefit combination and National Insurance number (NINo) Registrations to Adult Overseas Nationals datasets. These statistics provide a point-in-time count of all DWP WA benefit claimants at November each year from 2013 to 2020. These statistics do not include any information regarding benefit claimants of state pension age. HMRC administered benefits such as Tax Credits and Child Benefit are not included in the statistics.
UK nationals in these statistics are those in receipt of WA benefits who do not appear in the NINo dataset. The NINo registration dataset covers all Non-UK nationals who were allocated a NINo in the period January 1975 to June 2021, however this publication only includes data until November 2020. The nationality stated in these statistics is as recorded at the point of NINo registration.
The nationality for Non-UK nationals is recorded at the point of NINo registration and cannot be used as a proxy for current nationality or nationality at birth. Please see nationality section for further information.
This publication covers the period to November 2020, and therefore contains data relating to periods both prior to and during the coronavirus (COVID-19) pandemic.
1. Main stories
There were 9.9 million people that claimed at least one DWP-administered WA benefit in November 2020, 38% (2.7 million) more than in November 2019, the largest increase between reference dates in the number of people claiming WA benefits since the time series began in November 2013.
From November 2019 to November 2020, the number of UK nationals claiming WA benefits increased by 34% to 8.3 million, while the number of claimants from Non-UK nationalities increased by 61% to 1.6 million. For both groups this was the largest year on year increase since November 2013. The increase in the total number of UK and Non-UK nationals claiming at least one DWP WA benefit is likely to be a reflection of the economic disruption caused by the COVID-19 pandemic.
Amongst Non-UK nationals, EU nationals claiming WA benefits increased by 104% to 780,000. While the number of Non-EU nationals increased by 34% to 820,000. All world sub-groups saw an increase in the number of WA benefit claimants from November 2019 to November 2020.
In November 2020, 42% of Non-UK WA benefit claimants lived in London, this is a decrease of 5 percentage points from 47% in November 2013.
There is a similar pattern of UK WA benefit claimants across GB regions claiming Housing benefit (HB) or Universal Credit (UC), whereas for Non-UK claimants there is slightly more variation across those regions.
London has a much higher proportion of UK and Non-UK WA benefit claimants claiming HB, and the lowest proportion claiming combinations excluding HB or UC.
The most common benefit combination is UC with the benefit recipient being Out-of-Work (UC(OOW)). Of all WA benefit claimants, 2.3 million (23%) claimed UC(OOW) only. Similarly, 22% of UK WA benefit claimants claimed UC(OOW) only, and 26% of Non-UK WA benefit claimants claimed UC (OOW) only.
The increase in the total number of UK and Non-UK nationals claiming at least one DWP WA benefit is likely to be a reflection of the economic disruption caused by the COVID-19 pandemic. Some of the increase in total WA benefit claimants may also reflect the transfer from Tax Credits to UC, as there is no method to differentiate new UC claims from those moving from legacy benefits to UC.
2. What you need to know
This summary contains statistics on the nationality of claims to DWP administered WA benefits, covering the period November 2013 to November 2020. These statistics are designated as Experimental Statistics.
What can you use these figures for?
The statistics provide:
- the world group area and nationality of a count of individual benefit claimants at a point in time
- the combinations of benefits that are claimed, by world group area and individual nationality at the point of NINo registration
What you cannot use these figures for
The statistics do not give detailed information about:
- the characteristics of overall benefit claimants – for this please see the Quarterly Benefits Statistics Release that covers information on Benefit Combination statistics
- the nationality related to individual benefits
- the nationality of claimants that are in the same household but not part of the same benefit claim
- the current nationality of Non-UK benefit claimants. Nationality is derived from nationality at the point of registration. Some people classified as Non-UK benefit claimants may now be UK citizens. Published statistics do not reflect any subsequent nationality changes and therefore must be interpreted with caution
- a measure of migration
For official statistics on each individual benefit please see the statistics published by DWP grouped by type of benefit.
Methodology
The data presented in this statistical summary represent a point-in-time count of DWP benefit claimants by benefit combination at November each year from 2013 to 2020. Between each time point there could be changes which are not captured by these statistics.
There are methodological differences between individual benefit series in other publications and the benefit combination series published here, which in some cases give rise to differences in the figures themselves. Data is consistent with the benefit combinations data published on Stat-Xplore. The official figures for individual benefits should always be used to find out the number of claimants receiving a particular benefit. Further information on methodology, and detail on uses and limitations of the series can be found in background information.
EU groupings used within migration statistics
The following EU groupings are used in the statistics:
- EU15 (these are the original EU members: Austria, Belgium, Denmark, Finland, France, Germany, Greece, Ireland, Italy, Luxembourg, Netherlands, Portugal, Spain and Sweden)
- EU8 (these joined the EU in 2004: Czech Republic, Estonia, Hungary, Latvia, Lithuania, Poland, Slovakia and Slovenia)
- EU2 (these joined the EU in 2007: Romania & Bulgaria)
- EU Other (Croatia, Cyprus and Malta)
For reporting purposes, countries have been grouped into ‘World Areas’ based primarily on geographical location.
Perturbation and Rounding policy
Data provided in the supporting tables published alongside this statistical summary has been randomly adjusted to avoid the release of confidential data. This perturbation is in line with the perturbation methodology used by Stat-Xplore. The figures within this summary have been rounded in accordance to the rounding policy as per the table below. All calculations are done prior to rounding. There may be differences when recalculating the figures from data provided in the supporting data tables and within this summary.
| From | To | Rounded to nearest |
|---|---|---|
| 0 | 1,000 | 10 |
| 1,001 | 10,000 | 100 |
| 10,001 | 100,000 | 1,000 |
| 100,001 | 1,000,000 | 10,000 |
| 1,000,001 | 10,000,000 | 100,000 |
| 10,000,001 | 100,000,000 | 1,000,000 |
Percentages are rounded to the nearest whole number.
Nationality
The nationality for Non-UK nationals is recorded at the point of NINo registration and cannot be used as a proxy for current nationality or nationality at birth. Nationality is not updated, therefore these statistics reflect nationality only at the time of NINo allocation and include data on Non-UK individuals allocated a NINo from 1975 onwards. Over this time period, many people will have changed nationality, however the data we currently hold is not able to quantify this.
This statistical release has always from the outset had a strong caveat about the use of these figures. However, we are now aware that the scale of difference between nationality at the point of NINo allocation and nationality or citizenship status at the point of receiving benefits is likely to be very substantial.
At present this difference cannot be quantified. Looking at migration and naturalisation[footnote 1] in general, the Migration Observatory briefing on Citizenship and naturalisation for migrants in the UK reported that in 2019, 54% of Non-EU nationals who were born abroad had gained UK Citizenship.
This proportion rose to 65% at 10 years (by the end of 2016 for Non-EU nationals who had an entry visa in 2006) and 75% at 13 years (end of 2019) (see figure 4 in the Migration Observatory briefing on Citizenship and naturalisation for migrants in the UK).
Whilst the overall proportion of EU nationals who were born abroad and have gained UK Citizenship was substantially lower at the time of conducting research (at 16%), it is important to note that since the EU referendum there has been a sharp increase in the number of EU nationals gaining UK citizenship, with EU nationals accounting for 30% (approximately 48,500) of successful applications in the year ending 2019 (see figure 3 in the Migration Observatory briefing on Citizenship and naturalisation for migrants in the UK). None of these changes to citizenship are reflected within this statistics bulletin.
Whilst it is not currently possible to know the extent of the impact of this with regards to benefit claimants from available data, this should illustrate that these statistics cannot be used as a meaningful proxy for the nationality or citizenship of benefit claimants at the point of claiming benefits.
Individuals who migrate to the UK and register as UK citizens as children or as adults before being allocated a NINo would be recorded within the UK category of this publication. Accordingly, these statistics can not be used as a proxy for nationality at birth and cannot be used to assess past migration status of benefit claimants.
Read more about the Migration Observatory.
We would like to have feedback from the users of this statistical bulletin about how these statistics are currently used. Read more information about this, including how to send your comments to us.
Location
These statistics present geographies based on claimant address at the point of receiving a WA benefit. For Non-UK claimants the address at the point of receiving a WA benefit could differ from their address at the point of NINo registration.
Working Age Benefit Combinations
The benefit combinations covered in this publication are in line with those covered in the benefit combinations statistics and Stat-Xplore, as shown in the following table.
| Administered by DWP | Universal Credit (UC) | UC(NWR) | Universal Credit with no work requirements | |
| Administered by DWP | UC(OOW) | Universal Credit while out of work | ||
| Administered by DWP | UC(UNK) | Universal Credit with unknown requirements | ||
| Administered by DWP | UC(WRK) | Universal Credit while working | ||
| Administered by DWP | DLA | Disability Living Allowance | ||
| Administered by DWP | PIP | Personal Independence Payment | ||
| Administered by DWP | CA | Carer’s Allowance | ||
| Administered by DWP | Incapacity Benefits (INCAP) | ESA | Employment and Support Allowance | |
| Administered by DWP | IB | Incapacity Benefit | ||
| Administered by DWP | IS | Income Support if also claiming IB | ||
| Administered by DWP | SDA | Severe Disablement Allowance | ||
| Administered by DWP | Other DWP Benefits | IS | Income Support except for those also claiming IB | |
| Administered by DWP | JSA | Jobseeker’s Allowance | ||
| Administered by DWP | PC | Pension Credit | ||
| Administered by DWP | WB/BB | BB | Bereavement Benefit | |
| Administered by DWP | WB | Widow’s Benefit | ||
| Administered by Local Authorities on behalf of DWP | HB | Housing Benefit |
For household level benefits (UC and HB), both the main claimant and partner (if applicable) are included in the statistics as separate individuals. This differs from other HB statistical publications, where figures show number of claims regardless of whether for a single person or a couple. An individual is not counted as a benefit claimant if they are a beneficiary of another person’s benefit claim but are not claiming any benefit in their own right. These statistics do not include any information regarding benefit claimants of state pension age. HMRC administered benefits such as Tax Credits and Child Benefit are not included in the statistics.
COVID-19
The economic disruption caused by the COVID-19 pandemic has caused an additional increase in UC claims and JSA claims from March 2020 onwards.
On 1 April 2020, executive competence for the following benefits was transferred to the Scottish Government:
- Disability Living Allowance
- Personal Independence Payments
- Attendance Allowance
- Industrial Injuries Disablement Benefit
- Severe Disablement Allowance
At this time the Scottish Government’s Cabinet Secretary for Social Security and Older People announced that the introduction of the new Scottish disability and carer benefits would be paused given the impact of the COVID-19 pandemic. Until these benefits are introduced, and while Social Security Scotland continues to build its capacity to deliver them, DWP Ministers have agreed that the DWP will continue delivering the existing benefits on behalf of the Scottish Government under Agency Agreements as they are delivered in England and Wales.
Universal Credit Rollout
Over the period from 2013 to 2018, there have been major changes to the benefits which WA people can claim. UC was introduced in April 2013 and roll out was complete in December 2018. Transfer on to UC for existing claimants of other benefits is ongoing.
The following benefits are replaced by UC:
- Income-based JSA
- Income Support (IS)
- Working Tax Credit
- Income-related ESA
- Housing Benefit (HB)
- Child Tax Credit
Due to the nature of UC, some of those now claiming UC were previously only claiming Tax Credits, and so were previously not counted as claiming WA benefits. Some of the increase in total WA benefit claimants may reflect the transfer from Tax Credits to UC, as there is no method to differentiate new UC claims from those moving from legacy benefits to UC.
Changes to Benefit Combinations in this release
From February 2021, Industrial Injuries Disablement Benefit (IIDB) was added to the Benefit Combinations statistics for the first time. This includes those who claim Industrial Injuries Disablement Benefit only, Reduced Allowance or Retirement Allowance only, or Industrial Injuries Disablement Benefit with either Reduced Allowance or Retirement Allowance.
The methodology used to include IIDB differs from that in the IIDB quarterly statistics collection in order to align the caseload dates to a common time point (the Benefit Combinations statistics reference date). The IIDB caseload within Benefit Combinations is an estimate based on the published IIDB caseload from five months prior to the reference date, with known deaths occurring within the intervening five-month period removed. For example, IIDB caseload at August 2020 was estimated using the published IIDB caseload as at March 2020 minus all individuals known to have died between March and August.
When adding IIDB to Benefit Combinations, the whole back series was updated and so this did not introduce any discontinuity.
Other methodological changes in February 2021 include:
- adjustment of cleaning rules to correctly allow concurrent UC and HB claims under some circumstances
- removal of suspended SP claims
- inclusion of Child DLA claims
- addition of new variable to show the number of benefits that an individual is claiming concurrently
- regrouping “Out of Work” claims to include those who are on UC and have no work requirements
The Benefit Combination background methodology note gives detail and impact for each of these changes.
3. How many people are claiming benefits?
The total number of WA benefit claimants is increasing
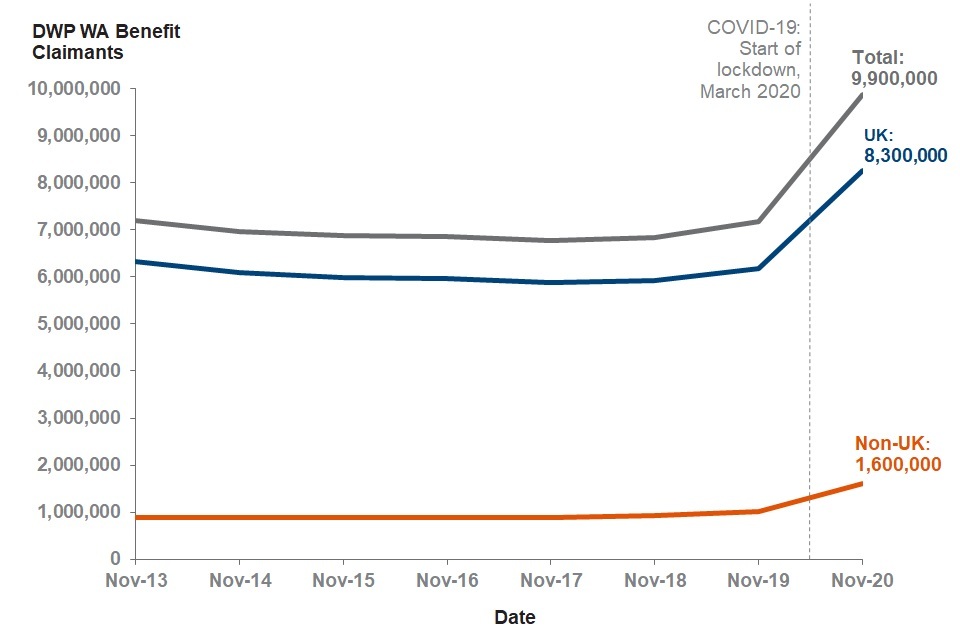
Source: NINo Benefit Combination Statistics data tables
There were 9.9 million people that claimed at least one DWP administered WA benefit in November 2020, a 38% (2.7 million) increase from November 2019, the largest increase in the number of people claiming WA benefits since the time series began in 2013.
DWP administered WA benefit claimants in November 2020, change from previous year and annual percentage change
| World Area | Nov 2019 | Nov 2020 | Change from Nov 2019 | Annual Percentage Change |
|---|---|---|---|---|
| UK | 6,200,000 | 8,300,000 | +2,100,000 | +34% |
| Non-UK | 1,000,000 | 1,600,000 | +610,000 | +61% |
| Total | 7,200,000 | 9,900,000 | +2,700,000 | +38% |
The number of UK and Non-UK DWP administered WA benefit claimants increased between November 2019 and November 2020, the third time there has been a consecutive increase for both UK and Non-UK nationals since the time series began. The increase in the total number of UK and Non-UK nationals between November 2019 and November 2020 claiming at least one DWP WA benefit is likely to be a reflection of the economic disruption caused by the COVID-19 pandemic.
From November 2019 to November 2020, the number of UK nationals claiming WA benefits increased by 34% to 8.3 million, while the number of Non-UK nationals claiming WA benefits increased by 61% to 1.6 million. For both groups, this was the largest year on year increase since November 2013.
Non-UK claimants account for 16% of all DWP administered WA benefit claimants in November 2020. This is the largest share they have accounted for since the beginning of the time series in November 2013, and an increase of two percentage points since November 2019.
There were 8.3 million UK nationals that claimed at least one WA benefit in November 2020. This is 34% more than the 6.2 million that claimed in November 2019 and is the largest number of UK nationals claiming at least one WA benefit in any twelve months ending November, since the time series began in November 2013.
There were 1.6 million Non-UK nationals that claimed at least one WA benefit in November 2020. This is 61% more than the 1 million that claimed in November 2019 and is the largest number of Non-UK nationals claiming at least one WA benefit in any twelve months ending November, since the times series began in November 2013.
The increase in the total number of UK and Non-UK nationals claiming at least one DWP WA benefit is likely to be a reflection of the economic disruption caused by the COVID-19 pandemic.
4. Where in the world are Non-UK benefit claimants from?
The number of Non-UK benefit claimants is increasing
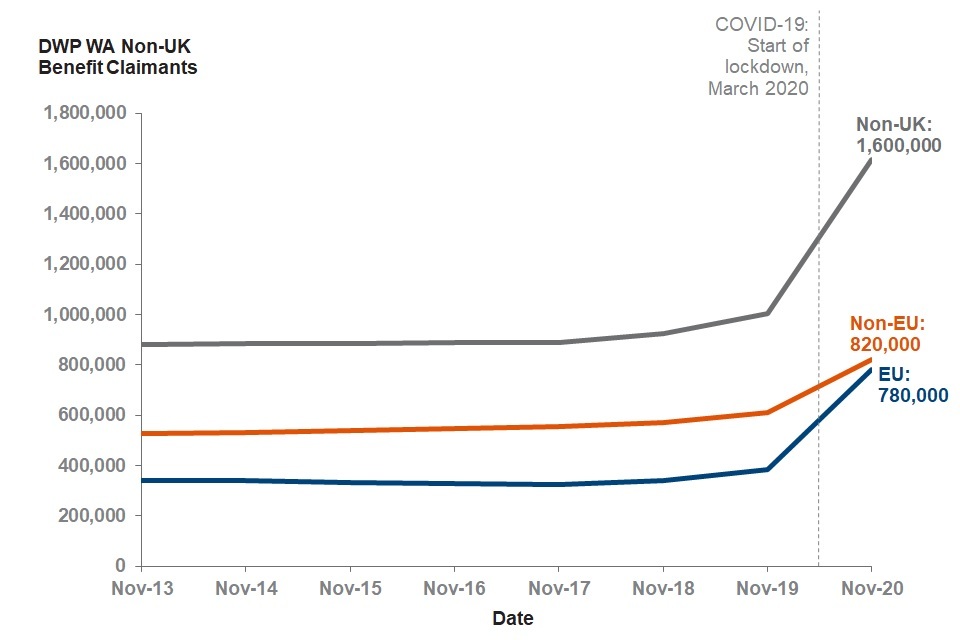
Source: NINo Benefit Combination Statistics data tables
Non-UK DWP administered WA benefit claimants in November 2020, change from previous year and annual percentage change
| World Area | Nov 2019 | Nov 2020 | Change from Nov 2019 | Annual Percentage Change |
|---|---|---|---|---|
| EU | 380,000 | 780,000 | +400,000 | +104% |
| Non-EU | 610,000 | 820,000 | +210,000 | +34% |
| Total Non-UK | 1,000,000 | 1,600,000 | +610,000 | +61% |
The number of EU and Non-EU claimants increased from November 2019 to November 2020. Non-EU claimants remain the majority of Non-UK claimants, accounting for 51% in November 2020. This is 10 percentage points lower than in November 2019, and is the lowest proportion of Non-EU WA benefit claimants since the time series began in November 2013.
4.1. Long term trends and changes in EU WA benefit Claimants
The number of EU WA benefit claimants is increasing
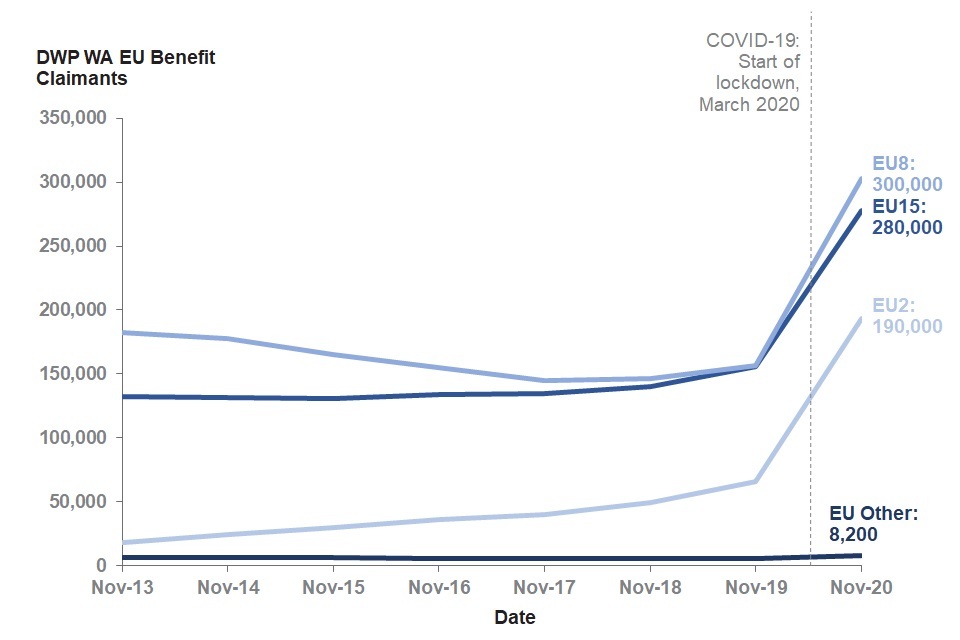
Source: NINo Benefit Combination Statistics data tables
The number of EU15 claimants declined slightly from November 2013 to November 2015, and has since increased, with the largest increase since the beginning of the time series occurring between November 2019 and November 2020.
The number of EU8 claimants declined from November 2013 to November 2017, with the largest decline occurring between November 2014 and November 2015. The number of claimants began to increase from November 2017 and has continued to increase, with the largest increase since the beginning of the time series occurring between November 2019 and November 2020.
The number of EU2 claimants has continued to steadily increase since November 2013. A higher increase was observed between November 2017 and November 2019, and the largest increase since the beginning of the time series occurred between November 2019 and November 2020.
DWP administered WA benefit claimants by EU sub-group in November 2020, change from previous year and annual percentage change
| EU sub-group | Nov 2019 | Nov 2020 | Change from Nov 2019 | Annual Percentage Change |
|---|---|---|---|---|
| EU15 | 160,000 | 280,000 | +120,000 | +79% |
| EU8 | 160,000 | 300,000 | +150,000 | +94% |
| EU2 | 66,000 | 190,000 | +130,000 | +195% |
| EU Other | 5,800 | 8,200 | +2,400 | +41% |
| Total EU | 380,000 | 780,000 | +400,000 | +104% |
In November 2020, there were 780,000 EU nationals claiming WA benefits. Of which:
- 280,000 claimants were EU15 nationals, an increase of 79% since November 2019. EU15 claimants account for 36% of all EU claimants, compared to 41% in November 2019
- 300,000 claimants were EU8 nationals, an increase of 94% since November 2019. EU8 claimants now account for 39% of all EU claimants, compared to 41% in November 2019
- 190,000 claimants were EU2 nationals, an increase of 195% since November 2019. EU2 claimants now account for 25% of all EU claimants, compared to 17% in November 2019
- 8,200 claimants were EU Other nationals, an increase of 41% since November 2019. EU Other claimants account for 1% of all EU claimants, compared to 2% in November 2019
There were 780,000 EU nationals that claimed at least one DWP administered WA benefit in November 2020. This represents an increase of 104% from November 2019 and an increase of 130% from November 2013. The increase in EU benefit claimants from November 2019 to November 2020 was driven mostly by the increase in EU8, EU2 and EU15 claimants.
The increase in the total number of EU nationals claiming at least one DWP WA benefit is likely to be a reflection of the economic disruption caused by the COVID-19 pandemic.
4.2. Long term trends and changes in Non-EU WA benefit Claimants
The number of Non-EU WA benefit claimants is increasing
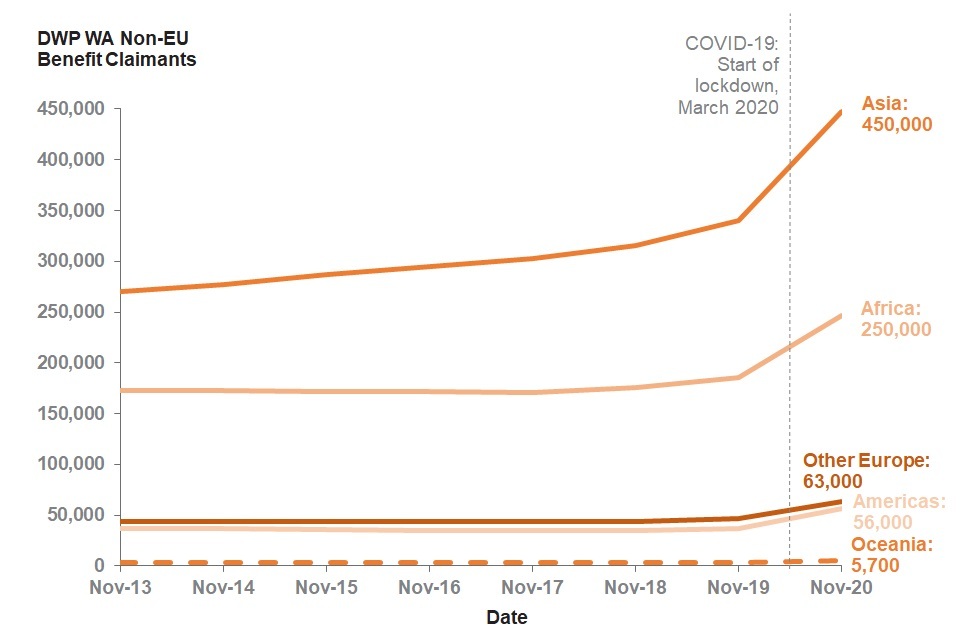
Source: NINo Benefit Combination Statistics data tables
The number of benefit claimants from European countries not a part of the EU (Other Europe) mostly declined from November 2013 to November 2016, and has since increased, with the largest increase since the beginning of the time series occurring between November 2019 and November 2020.
The number of claimants from Asia has continued to steadily increase since November 2013. A higher increase was observed between November 2018 and November 2019. The largest increase since the beginning of the time series occurred between November 2019 and November 2020.
The number of benefit claimants from Africa and the Americas declined from November 2013 to November 2017, and has since increased. The largest increase since the beginning of the time series occurred between November 2019 and November 2020.
The number of benefit claimants from Oceania declined from November 2013 to November 2018, and has since increased. The largest increase since the beginning of the time series occurred between November 2019 and November 2020.
DWP administered WA benefit claimants by Non-EU world area in November 2020, change from previous year and annual percentage change
| Non-EU world area | Nov 2019 | Nov 2020 | Change from Nov 2019 | Annual Percentage Change |
|---|---|---|---|---|
| Other Europe | 46,000 | 63,000 | +16,000 | +35% |
| Asia | 340,000 | 450,000 | +110,000 | +32% |
| Africa | 190,000 | 250,000 | +61,000 | +33% |
| Americas | 37,000 | 56,000 | +20,000 | +54% |
| Oceania | 2,900 | 5,700 | +2,700 | +93% |
| Total Non-EU | 610,000 | 820,000 | +210,000 | +34% |
DWP administered WA benefit claimants by Non-EU sub-group in November 2020, change from previous year and annual percentage change
| Non-EU sub-group | Nov 2019 | Nov 2020 | Change from Nov 2019 | Annual Percentage Change |
|---|---|---|---|---|
| Other Europe | 46,000 | 63,000 | +16,000 | +35% |
| Middle East and Central Asia | 110,000 | 140,000 | +23,000 | +20% |
| East Asia | 9,400 | 13,000 | +3,500 | +38% |
| South Asia | 200,000 | 270,000 | +73,000 | +36% |
| South East Asia | 17,000 | 27,000 | +9,100 | +52% |
| Sub-Saharan Africa | 150,000 | 200,000 | +50,000 | +34% |
| North Africa | 40,000 | 51,000 | +11,000 | +28% |
| North America | 5,700 | 8,500 | +2,800 | +49% |
| Central and South America | 31,000 | 48,000 | +17,000 | +55% |
| Oceania | 2,900 | 5,700 | +2,700 | +93% |
| Total Non-EU | 610,000 | 820,000 | +210,000 | +34% |
In November 2020, there were 820,000 Non-EU WA benefit claimants. Of which:
- 63,000 claimants were Other European nationals, an increase of 35% since November 2019. Other European claimants now account for 8% of all Non-EU claimants, the same as in November 2019
- 450,000 claimants were Asian nationals, an increase of 32% since November 2019. Asian claimants now account for 55% of all Non-EU claimants, compared to 56% in November 2019
- 250,000 claimants were African nationals, an increase of 33% since November 2019. African claimants now account for 30% of all Non-EU claimants, the same as in November 2019
- 56,000 claimants were nationals from the Americas, an increase of 54% since November 2019. Claimants from the Americas account for 7% of all Non-EU claimants, compared to 6% in November 2019
- 5,700 claimants were Oceanian nationals, an increase of 93% since November 2019. Oceanian claimants now account for 1% of all Non-EU claimants, compared to less than 1% in November 2019
There were 820,000 Non-UK claimants from outside the EU that received at least one DWP administered WA benefit in November 2020. This represents an increase of 34% from November 2019 and a 55% increase from November 2013. The increase in Non-EU benefit claimants from November 2019 to November 2020 was driven mostly by the increase in claimants from Asia and Africa, particularly from South Asia and Sub-Saharan Africa, respectively.
The increase in the total number of Non-EU nationals claiming at least one DWP WA benefit is likely to be a reflection of the economic disruption caused by the COVID-19 pandemic.
5. What benefits do people claim?
5.1. Top 10 DWP-administered WA benefit combinations
Top 10 DWP administered WA benefit combinations for all claimants in November 2020, by nationality, and percentage of all benefit claimants
| Benefit Combination | All | UK | Non-UK | |||
|---|---|---|---|---|---|---|
| Number of Claimants | % of all WA benefit Claimants | Number of Claimants | % of UK WA benefit Claimants | Number of Claimants | % of Non-UK WA benefit Claimants | |
| UC(OOW) | 2,300,000 | 23% | 1,900,000 | 22% | 430,000 | 26% |
| UC(WRK) | 2,100,000 | 21% | 1,500,000 | 19% | 520,000 | 32% |
| HB,PIP/DLA,INCAP | 720,000 | 7% | 670,000 | 8% | 48,000 | 3% |
| HB | 570,000 | 6% | 330,000 | 4% | 230,000 | 14% |
| PIP/DLA,INCAP | 530,000 | 5% | 510,000 | 6% | 17,000 | 1% |
| PIP/DLA | 530,000 | 5% | 500,000 | 6% | 22,000 | 1% |
| UC(NWR) | 490,000 | 5% | 420,000 | 5% | 72,000 | 4% |
| CA | 330,000 | 3% | 300,000 | 4% | 35,000 | 2% |
| INCAP | 250,000 | 3% | 230,000 | 3% | 18,000 | 1% |
| HB,INCAP | 240,000 | 2% | 220,000 | 3% | 17,000 | 1% |
| Total in Top 10 | 8,000,000 | 81% | 6,600,000 | 80% | 1,400,000 | 87% |
| Not in Top 10 | 1,900,000 | 19% | 1,700,000 | 20% | 210,000 | 13% |
| Total | 9,900,000 | 8,300,000 | 1,600,000 |
The proportions of the various benefit combinations claimed by UK claimants differs to those for Non-UK claimants. For example, when compared to UK claimants, Non-UK claimants claim HB at higher proportions than UK claimants, (14% for Non-UK and 4% for UK). Similarly, Non-UK claimants claim UC while Working (UC(WRK)) with no other benefits, at higher proportions than UK claimants, (32% for Non-UK and 19% for UK). Further detail for the most common combinations for UK and Non-UK (broken by EU and Non-EU world areas) claimants is provided below.
The most common benefit combinations claimed by people also vary by region of residence of the claimant. This detailed data can be found in Table 2 of the supporting tables accompanying this release This table provides the most common benefit combinations which include 95% of all benefit claimants, broken down by region and world sub-group.
5.2. What benefits do UK nationals claim?
Top 10 DWP administered WA benefit combinations for UK claimants in November 2020
| Benefit Combination | Claimants | % of Total UK Claimants |
|---|---|---|
| UC(OOW) | 1,900,000 | 22% |
| UC(WRK) | 1,500,000 | 19% |
| HB,PIP/DLA,INCAP | 670,000 | 8% |
| PIP/DLA,INCAP | 510,000 | 6% |
| PIP/DLA | 500,000 | 6% |
| UC(NWR) | 420,000 | 5% |
| HB | 330,000 | 4% |
| CA | 300,000 | 4% |
| INCAP | 230,000 | 3% |
| HB,INCAP | 220,000 | 3% |
| Total in Top 10 | 6,600,000 | 80% |
| Not in Top 10 | 1,700,000 | 20% |
| Total | 8,300,000 |
The majority of UK WA benefit claimants are claiming UC
Source: NINo Benefit Combination Statistics data tables
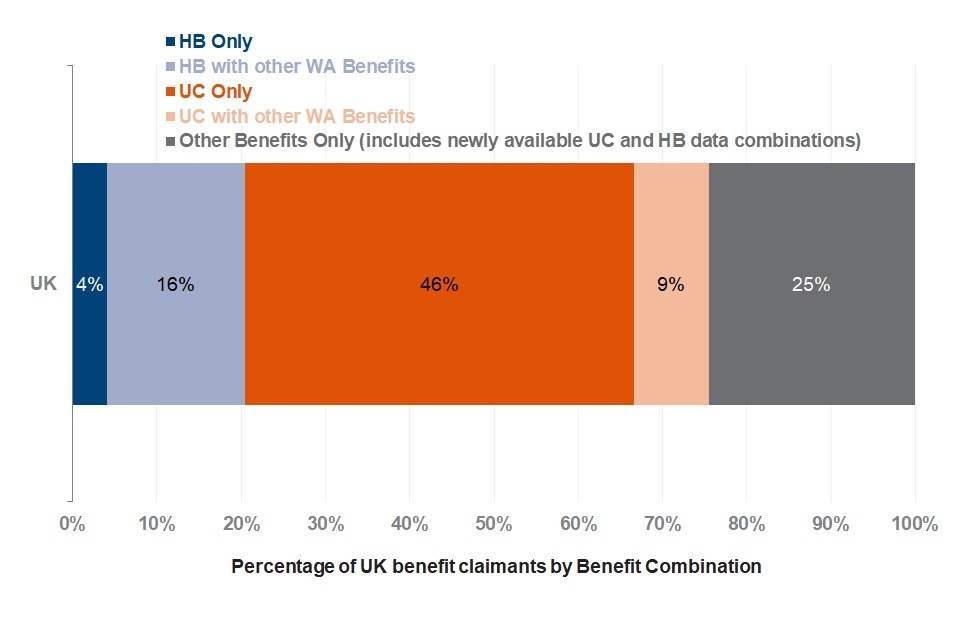
There is a wide range of DWP administered WA benefit combinations claimed by UK nationals. The largest group, with 1.9 million individuals in November 2020, claim UC(OOW) and no other benefits. There were 3.8 million UK nationals claiming UC only and a total of 4.6 million UK nationals claiming UC in November 2020. This represents 56% of all UK nationals claiming WA benefits. Some UC claimants may have partners who work or claim other benefits in their own right.
In total 1.8 million UK nationals claimed HB by itself or with other benefits, 22% of all UK WA benefit claimants. Some HB claimants may have partners who work or claim other benefits in their own right.
Number of UK claimants by DWP administered WA benefit combination claimed in November 2020
| Nationality | HB only | HB with other WA benefits (exc. UC) | UC only | UC with other WA benefits (exc. HB) | HB and UC only | HB and UC with other WA benefits | Other WA benefit combinations |
|---|---|---|---|---|---|---|---|
| UK | 330,000 | 1,400,000 | 3,800,000 | 730,000 | 82,000 | 25,000 | 1,900,000 |
5.3. What DWP administered WA benefits do EU nationals claim?
Top 10 DWP administered WA benefit combinations for EU claimants in November 2020
| Benefit Combination | Claimants | % of Total Claimants |
|---|---|---|
| UC(WRK) | 330,000 | 42% |
| UC(OOW) | 210,000 | 27% |
| HB | 89,000 | 11% |
| UC(NWR) | 32,000 | 4% |
| JSA | 14,000 | 2% |
| HB,PIP/DLA,INCAP | 13,000 | 2% |
| CA | 11,000 | 1% |
| PIP/DLA | 8,800 | 1% |
| INCAP | 8,800 | 1% |
| UC(NWR),CA | 6,300 | 1% |
| Total in Top 10 | 720,000 | 92% |
| Not in Top 10 | 61,000 | 8% |
| Total | 780,000 |
The proportion of EU WA benefit claimants by benefit combination varies across EU sub-groups
Source: NINo Benefit Combination Statistics data tables
As for UK nationals, there is a wide range of DWP administered WA benefit combinations claimed by EU nationals. The largest group, of 330,000 individuals in November 2020, claim UC while Working (UC(WRK)) with no other benefits. A total of 130 thousand EU nationals claimed HB, this represents 16% of all EU WA benefit claimants.
In November 2020, 570 thousand EU nationals claimed UC with no other WA benefits, out of a total of 610 thousand EU nationals claiming UC. EU nationals claiming UC represent 78% of EU WA benefit claimants.
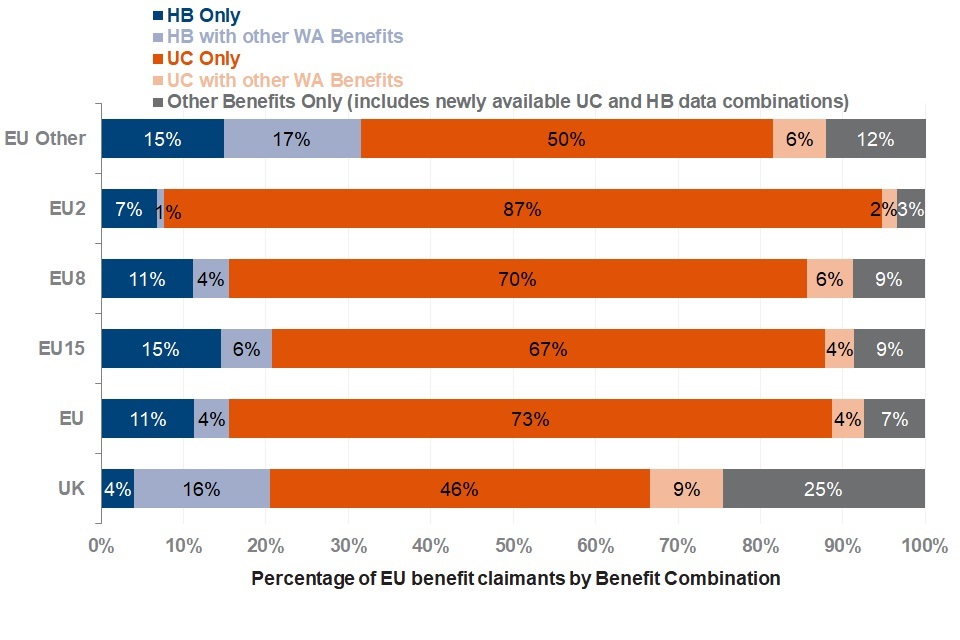
When compared to UK claimants, EU claimants claimed HB with no other benefits at higher proportions than UK claimants (11% for EU and 4% of UK). Similarly, EU claimants claimed UC with no other benefits at higher proportions than UK claimants (73% for EU and 46% for UK).
Of the EU subgroups, EU2 had the highest proportion of WA benefit claimants claiming UC with no other benefits, with 87% of EU2 WA claimants claiming only UC. EU2 had the lowest proportion of total HB claims, with 8%. EU15 and the UK had the same proportion of claimants who claimed HB (22%). EU15 had a higher proportion of claimants who claimed HB with no other benefits (15%) compared to the UK (4%).
Number of EU claimants by DWP administered WA benefit combination claimed in November 2020, by EU sub-group
| EU sub-group | HB only | HB with other WA benefits (exc. UC) | UC only | UC with other WA benefits (exc. HB) | HB and UC only | HB and UC with other WA benefits | Other WA benefit combinations |
|---|---|---|---|---|---|---|---|
| EU15 | 40,000 | 17,000 | 190,000 | 9,800 | 3,100 | 420 | 20,000 |
| EU8 | 34,000 | 13,000 | 210,000 | 17,000 | 2,300 | 420 | 24,000 |
| EU2 | 13,000 | 1,600 | 170,000 | 3,600 | 710 | 60 | 5,800 |
| EU Other | 1,200 | 1,400 | 4,100 | 530 | 60 | 20 | 910 |
| Total EU | 89,000 | 33,000 | 570,000 | 31,000 | 6,200 | 920 | 51,000 |
5.4. What DWP administered WA benefits do Non-EU nationals claim?
Top 10 DWP administered WA benefit combinations for Non-EU claimants in November 2020
| Benefit Combination | Claimants | % of Total Claimants |
|---|---|---|
| UC(OOW) | 210,000 | 26% |
| UC(WRK) | 190,000 | 23% |
| HB | 140,000 | 18% |
| UC(NWR) | 39,000 | 5% |
| HB,PIP/DLA,INCAP | 34,000 | 4% |
| CA | 23,000 | 3% |
| UC(OOW),HB | 14,000 | 2% |
| UC(NWR),CA | 13,000 | 2% |
| PIP/DLA | 12,000 | 2% |
| HB,INCAP | 12,000 | 1% |
| Total in Top 10 | 700,000 | 85% |
| Not in Top 10 | 120,000 | 15% |
| Total | 820,000 |
The proportion of Non-EU WA benefit claimants by benefit combination varies across Non-EU world areas
Source: NINo Benefit Combination Statistics data tables
There is a wide range of DWP administered WA benefit combinations claimed by Non-EU nationals. The largest group of 210,000 individuals in November 2020, claim UC while out of work, out of a total of 260,000 Non-EU nationals claiming HB. Non-EU nationals claiming HB represent 32% of all Non-EU WA benefit claimants.
In November 2020, 440,000 Non-EU nationals claimed UC with no other WA benefits, out of a total of 510,000 Non-EU nationals claiming UC. Non-EU nationals claiming UC represent 62% of Non-EU WA benefit claimants.
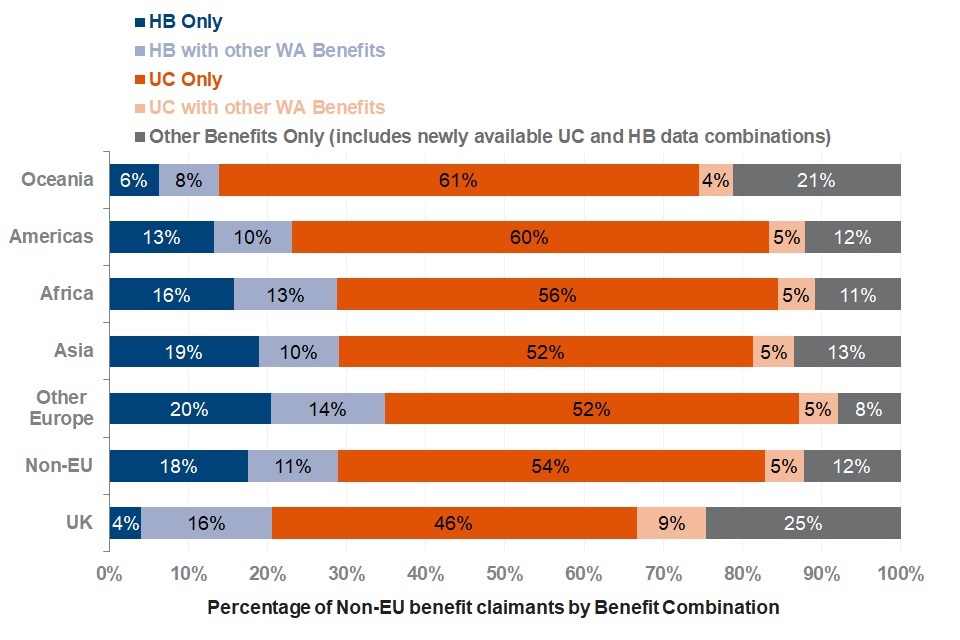
Non-EU claimants claimed HB with no other benefits at higher proportions than UK claimants (18% for Non-EU and 4% for UK). Non-EU claimants also claimed UC with no other benefits at higher proportions than UK claimants (54% for Non-EU and 46% for UK).
When comparing Non-EU world areas, claimants from Other Europe have the highest proportion of claimants claiming HB, with 36%, and the lowest proportion of UC claims, with 59%. Claimants from Africa have the lowest proportion of WA benefit claimants not claiming HB or UC, with 6%. Claimants from Oceania claim HB with no other benefits at the lowest rate, when compared to other Non-EU world areas, at 6%. Oceanian claimants also claim HB at the lowest rate, at 14% of all Oceanian WA benefit claimants.
Number of Non-EU claimants by DWP administered WA benefit combination claimed in November 2020, by Non-EU world areas
| Non-EU world areas | HB only | HB with other WA benefits (exc. UC) | UC only | UC with other WA benefits (exc. HB) | HB and UC only | HB and UC with other WA benefits | Other WA benefit combinations |
|---|---|---|---|---|---|---|---|
| Other Europe | 13,000 | 9,100 | 33,000 | 3,100 | 780 | 130 | 4,100 |
| Asia | 84,000 | 45,000 | 230,000 | 23,000 | 8,100 | 1,100 | 51,000 |
| Africa | 39,000 | 32,000 | 140,000 | 12,000 | 10,000 | 970 | 15,000 |
| Americas | 7,500 | 5,500 | 34,000 | 2,600 | 1,300 | 200 | 5,300 |
| Oceania | 360 | 430 | 3,500 | 240 | 30 | 10 | 1,200 |
| Total Non-EU | 140,000 | 93,000 | 440,000 | 41,000 | 21,000 | 2,400 | 77,000 |
6. Where do DWP administered WA benefits claimants live?
UK and Non-UK benefit claims in November 2020, by region
| Region | UK | Non-UK | Of which | |
|---|---|---|---|---|
| EU | Non-EU | |||
| London | 910,000 | 670,000 | 300,000 | 370,000 |
| North West | 1,100,000 | 140,000 | 60,000 | 81,000 |
| South East | 960,000 | 150,000 | 82,000 | 68,000 |
| West Midlands | 810,000 | 150,000 | 64,000 | 82,000 |
| Yorkshire and The Humber | 760,000 | 100,000 | 49,000 | 54,000 |
| Scotland | 790,000 | 69,000 | 40,000 | 28,000 |
| East of England | 690,000 | 110,000 | 68,000 | 44,000 |
| South West | 660,000 | 62,000 | 37,000 | 24,000 |
| East Midlands | 600,000 | 88,000 | 51,000 | 37,000 |
| Wales | 490,000 | 29,000 | 14,000 | 14,000 |
| North East | 450,000 | 28,000 | 11,000 | 16,000 |
Source: NINo Benefit Combination Statistics data tables
The regions where the most DWP-administered WA benefit claimants reside are London, the North West and the South East.
London has the highest number of Non-UK WA benefit claimants, with 670,000, representing 42% of all Non-UK benefit claimants. Despite an increase in the number of Non-UK WA benefit claimants, the proportion of Non-UK WA benefit claimants living in London has decreased, from 47% of Non-UK WA benefit claimants in November 2013.
UK WA benefit claimants are less concentrated in where they live across the country, with the region with the most UK WA benefit claimants being the North West, with 14% (1.1 million), and the least being the North East, with 6% (450,000). The distribution of UK WA benefit claimants across the country by region has remained stable since the time series began, with the exception of the South East. The twelve months leading up to November 2020 saw the South East’s proportion increase by one percentage point, to represent 12% of all UK WA benefit claimants.
Similarly, the distribution of all WA benefit claimants across the country by regions has remained stable since the time series began, with some slight fluctuation in both London and Wales (this data can be found in Table 1 of the supporting tables accompanying this release).
In every region UK WA benefit claimants make up the majority of WA benefit claimants. In November 2020, in London, 42% of all WA benefit claimants were Non-UK nationals.
In the East Midlands, East of England, South East, South West, and Scotland, EU WA benefit claimants outnumber Non-EU WA benefit claimants. For all other regions this is reversed, with Non-EU WA benefit claimants outnumbering EU WA benefit claimants.
Detailed figures at regional level for the number of individuals claiming specific combinations of benefits are available in the supporting tables accompanying this release.
7. Where do DWP administered WA benefit claimants live in GB?
Nationality and eligibility to claim benefits are two different things. DWP benefits are only available to those that live in Great Britain. From 1 April 2011, the Government Statistical Service (GSS) Regional and Geography Committee (RGC) agreed that the former Government offices for the regions (GORs) should simply be referred to as ‘regions’. Whilst Scotland and Wales were not subdivided into GORs, they are also listed as ‘regions’ in GB-wide statistical comparisons.
The proportion of UK WA benefit claimants by benefit combination is similar across most regions
Source: NINo Benefit Combination Statistics data tables
Number of UK claimants by DWP administered WA benefit combination claimed in November 2020, by region
| Region | HB only | HB with other WA benefits (exc. UC) | UC only | UC with other WA benefits (exc. HB) | HB and UC only | HB and UC with other WA benefits | Other WA benefit combinations |
|---|---|---|---|---|---|---|---|
| North East | 15,000 | 80,000 | 210,000 | 47,000 | 2,200 | 930 | 100,000 |
| North West | 32,000 | 190,000 | 520,000 | 110,000 | 6,300 | 2,900 | 270,000 |
| Yorkshire and The Humber | 25,000 | 130,000 | 350,000 | 67,000 | 5,700 | 1,600 | 190,000 |
| East Midlands | 20,000 | 94,000 | 270,000 | 51,000 | 4,300 | 1,300 | 160,000 |
| West Midlands | 30,000 | 130,000 | 380,000 | 69,000 | 14,000 | 3,100 | 190,000 |
| East of England | 31,000 | 100,000 | 330,000 | 59,000 | 7,200 | 2,100 | 160,000 |
| London | 65,000 | 150,000 | 440,000 | 67,000 | 17,000 | 4,500 | 160,000 |
| South East | 49,000 | 140,000 | 460,000 | 79,000 | 9,800 | 3,300 | 220,000 |
| South West | 28,000 | 100,000 | 320,000 | 60,000 | 5,400 | 2,200 | 150,000 |
| Scotland | 21,000 | 160,000 | 330,000 | 77,000 | 7,000 | 2,200 | 190,000 |
| Wales | 16,000 | 90,000 | 200,000 | 45,000 | 3,400 | 1,200 | 130,000 |
| Total UK | 330,000 | 1,400,000 | 3,800,000 | 730,000 | 82,000 | 25,000 | 1,900,000 |
The proportion of Non-UK WA benefit claimants by benefit combination varies slightly across regions
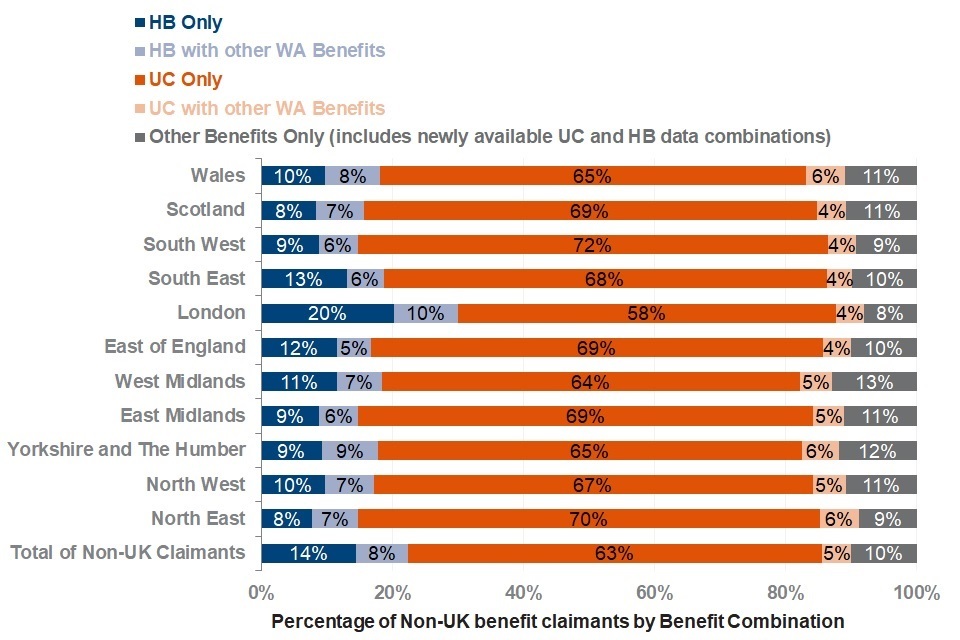
Source: NINo Benefit Combination Statistics data tables
Number of Non-UK claimants by DWP administered WA benefit combination claimed in November 2020, by region
| Region | HB only | HB with other WA benefits (exc. UC) | UC only | UC with other WA benefits (exc. HB) | HB and UC only | HB and UC with other WA benefits | Other WA benefit combinations |
|---|---|---|---|---|---|---|---|
| North East | 2,200 | 1,900 | 20,000 | 1,600 | 260 | 20 | 2,200 |
| North West | 14,000 | 11,000 | 96,000 | 7,200 | 2,100 | 170 | 13,000 |
| Yorkshire and The Humber | 9,600 | 9,000 | 67,000 | 5,800 | 1,100 | 100 | 11,000 |
| East Midlands | 7,800 | 5,300 | 61,000 | 4,100 | 830 | 60 | 8,900 |
| West Midlands | 17,000 | 10,000 | 94,000 | 7,200 | 4,400 | 310 | 14,000 |
| East of England | 13,000 | 5,700 | 78,000 | 4,700 | 1,500 | 160 | 9,700 |
| London | 140,000 | 66,000 | 390,000 | 29,000 | 12,000 | 2,000 | 40,000 |
| South East | 20,000 | 8,400 | 100,000 | 5,900 | 1,600 | 230 | 13,000 |
| South West | 5,400 | 3,700 | 44,000 | 2,700 | 780 | 90 | 4,900 |
| Scotland | 5,800 | 5,100 | 48,000 | 3,100 | 1,600 | 150 | 5,700 |
| Wales | 2,800 | 2,400 | 19,000 | 1,700 | 330 | 50 | 2,800 |
| Total Non-UK | 230,000 | 130,000 | 1,000,000 | 73,000 | 27,000 | 3,300 | 130,000 |
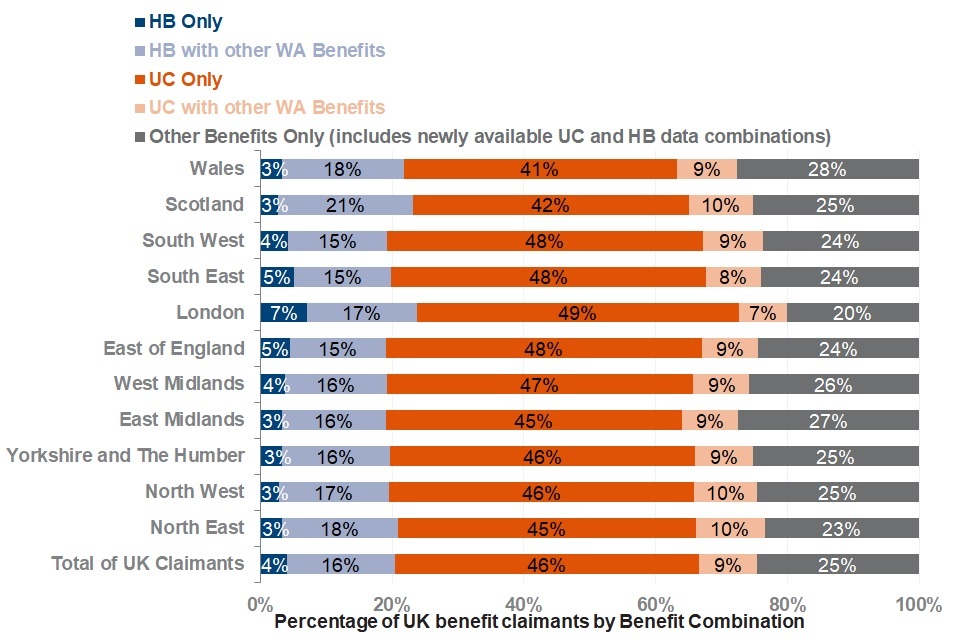
Across the regions, UK WA benefit claimants claimed HB, UC and Other benefits at similar rates, with a HB rate between 20% and 26%, a UC rate between 52% and 59%, and other benefits with a rate between 18% and 27%. London has the highest proportion of HB claimants, with 26% of UK London claimants claiming HB. London also has the highest proportion of UC claimants, with 59%.
The regions with the lowest proportion of HB claimants were the North West, East Midlands, East of England, and South West, all with 20%. The region with the lowest proportion of UC claimants was Wales, with 52%. East Midlands and Wales have the highest rate of UK claimants not claiming UC or HB with 27%.
For Non-UK WA benefit claimants, across the regions, HB was claimed at a rate between 16% and 32%. Similar to UK claimants, London had the highest proportion of HB claimants, with 32% of Non-UK London claimants claiming HB. The regions with the lowest proportion of HB claimants were the South West, East Midlands, and North East, with 16%.
For Non-UK WA benefit claimants, UC was claimed at a rate between 64% and 77%. The South West and North East had the highest proportion of UC claimants, with 77%. The region with the lowest proportion of UC claimants was London, with 64%. For Non-UK WA benefit claimants, Other benefits were claimed at a rate between 6% and 11% across regions. The region with the highest proportion of benefit claims other than UC and HB was Yorkshire and the Humber, with 11%. London had the lowest proportion of Non-UK claimants not claiming UC or HB, with 6%.
8. About these statistics
Status: Experimental Statistics
Users of these statistics are asked to note that the benefit combination statistics are currently an experimental statistical series, which means that they are in the development phase.
National, Official and Experimental Statistics are produced in accordance with Statistics and Registration Service Act 2007 and the Code of Practice for Statistics. National Statistics status means that official statistics meet the highest standards of:
- trustworthiness
- quality
- public value
Official and Experimental Statistics may be awarded National Statistics status following an assessment by the Office for Statistics Regulation, the regulatory arm of the UK Statistics Authority. Further information about National, Official and Experimental Statistics status can be found in the Code of Practice for Statistics website glossary.
World Areas
For reporting purposes, countries have been grouped into ‘world areas’ based primarily on geographical location. Countries are grouped according to current world area status for the entire back series.
| World Area | Sub-Group |
|---|---|
| European Union (EU) | European Union EU15 (original EU members), European Union EU8 (joined EU in 2004), European Union EU2 (joined EU in 2007), European Union Other |
| Non-European Union (Other Europe) | Other Europe |
| Asia | Middle East and Central Asia, East Asia, South Asia, South East Asia |
| Africa | Sub-Saharan Africa, North Africa |
| Americas | North America, Central and South America |
| Oceania | Oceania |
Where to find out more
Read previous releases of these statistics.
Read further information note for details on the NINo data and process of allocation.
Read further methodology note for details on the Benefit Combinations data.
Official Statistics for each of the individual benefits in this release can be found for WA benefits.
Read for information regarding benefits and pensions for EEA and Swiss citizens in the UK.
Read for information regarding migrant access to public funds, including social housing, homelessness assistance and social care.
Read for HMRC publication of the number of Tax Credit recipients.
9. User engagement
How are you using this statistical information?
Following the update of the caveat regarding changes to nationality after initial NINo allocation, we would like to further understand how these statistics are used.
Are ‘nationality breakdown at point of NINo allocation’ statistics useful to you without being used as a proxy for current nationality, or nationality at birth? If so, please provide further information on how you use this information.
We would also be grateful for views on the extent to which the information in the caveat impacts on and may limit the meaningfulness of your usage of the figures and accordingly the usefulness of this as an ongoing measure on this basis. Please send any responses and any further feedback by email to hbdr.nino.statisticsteam@dwp.gov.uk
Enquires and feedback
DWP would like to hear your views on our statistical publications. If you use any of our statistics publications, we would be interested in hearing what you use them for and how well they meet your requirements: Send your comments by email to: stats-consultation@dwp.gov.uk.
Press enquiries should be directed to the DWP Press Office, telephone: 0203 267 5144.
Enquiries about these statistics should be directed by email to:
Producer of this release: harry.phasey@dwp.gov.uk
Lead statistician: harry.phasey@dwp.gov.uk
ISBN: 978-1-78659-349-8
-
Naturalisation is the act of acquiring a new citizenship or nationality. Definition provided by The Migration Observatory. ↩