National flu and COVID-19 surveillance report: 2 July 2026 (week 27)
Updated 30 July 2026
Applies to England

© Crown copyright 2026
This publication is licensed under the terms of the Open Government Licence v3.0 except where otherwise stated. To view this licence, visit nationalarchives.gov.uk/doc/open-government-licence/version/3 or write to the Information Policy Team, The National Archives, Kew, London TW9 4DU, or email: psi@nationalarchives.gov.uk.
Where we have identified any third party copyright information you will need to obtain permission from the copyright holders concerned.
This publication is available at https://www.gov.uk/government/statistics/national-flu-and-covid-19-surveillance-reports-2025-to-2026-season/national-flu-and-covid-19-surveillance-report-2-july-2026-week-27
This report summarises the information from the surveillance systems which are used to monitor COVID-19 (caused by severe acute respiratory syndrome coronavirus 2 (SARS-CoV-2)), influenza, and diseases caused by seasonal respiratory viruses in England. The report is based on data up to week 26 of 2026 between 22 June and 28 June 2026.
Corrections
This report was corrected on 30 July 2026 to update the summary section. The corrections did not change the overall interpretation of data and points for each virus.
Main points
The main messages of this report are:
- influenza activity remained low and circulating at baseline levels
- COVID-19 activity remained low and circulating at baseline levels
- respiratory syncytial virus (RSV) activity remained low and circulating at baseline levels
Seasonal reports
Annual reports for the 2025 to 2026 season:
Summary of all respiratory virus activity
Influenza activity
Influenza activity remained low and is circulating at baseline levels. Emergency department (ED) attendances for influenza-like-illness (ILI) remained low. Reporting of weekly influenza hospital admissions for the 2025 to 2026 season concluded in week 17.
| Indicator | Trend | Level [note 1] | Comments |
|---|---|---|---|
| Laboratory surveillance | Increasing | Baseline | Influenza positivity increased with a positivity rate of 0.6% on the most recent Sunday compared with 0.4% on the previous Sunday |
| GP swabbing positivity | Decreasing | Baseline | In week 25, among all tested samples, 0.0% were positive for influenza, compared with 0.7% in the previous week |
COVID-19 activity
COVID-19 activity remained low and is circulating at baseline levels. ED attendances for COVID-19-like illness remained low.
| Indicator | Trend | Level [note 1] | Comments |
|---|---|---|---|
| Laboratory surveillance | Stable | Baseline | COVID-19 PCR (polymerase chain reaction) positivity in hospital settings remained stable with a positivity rate of 0.6% on the most recent Sunday compared with 0.6% on the previous Sunday |
| GP swabbing positivity | Decreasing | Baseline | In week 25, among all tested samples, 0.0% were positive for SARS-CoV-2, compared with 0.7% in the previous week |
| Hospital admissions | Remained low | Baseline | The overall weekly hospital admission rate for COVID-19 slightly increased to 0.16 per 100,000 compared with 0.15 per 100,000 in the previous week |
Respiratory syncytial virus activity
RSV activity remained low and is circulating at baseline levels. ED attendances for acute bronchiolitis remained low. Reporting of weekly RSV hospital admissions for the 2025 to 2026 season concluded in week 14.
| Indicator | Trend | Level [note 1] | Comments |
|---|---|---|---|
| Laboratory surveillance | Stable | Baseline | RSV positivity remained stable at 0.2% compared with 0.2% in the previous week. |
| GP swabbing positivity | Stable | Baseline | In week 25, among all tested samples, 0.0% were positive for RSV compared with 0.0% in the previous week |
Other viruses
| Indicator | Trend | Level [note 1] | Comments |
|---|---|---|---|
| Adenovirus | Decreasing | Baseline | Adenovirus positivity (laboratory surveillance) decreased to 2.3% compared with 3.3% in the previous week |
| Human metapneumovirus (hMPV) | Increasing slightly | Baseline | hMPV positivity (laboratory surveillance) increased slightly to 1.0% compared with 0.9% in the previous week |
| Parainfluenza | Decreasing | Baseline | Parainfluenza positivity (laboratory surveillance) decreased to 1.9% compared with 2.7% in the previous week |
| Rhinovirus | Stable | Baseline | Rhinovirus positivity (laboratory surveillance) remained stable at 10.4% compared with 10.1% in the previous week |
Note 1: these indicators use the moving epidemic method (MEM) and the mean standard deviation method (MSD) to define thresholds to determine their respective levels of activity. Further information on these methods can be found in Influenza surveillance in Europe: establishing epidemic thresholds by the Moving Epidemic Method and Setting thresholds to determine COVID-19 activity levels using the mean standard deviation (MSD) method, England, 2022 to 2024. The MEM approach is well-established for some influenza surveillance indicators, however, for other indicators both the MEM and MSD are experimental and may be subject to future revision. Influenza laboratory surveillance and GP swabbing positivity have transitioned from using MEM to using MSD. These approaches will be considered alongside expert opinion and triangulation of other data sources.
Laboratory surveillance
Laboratory-confirmed cases
The Second Generation Surveillance System (SGSS) captures test result information for notifiable infectious diseases, including COVID-19 and influenza, from laboratories in England. The unified sample dataset (USD) stores all SARS-CoV-2 test results reported to SGSS, Respiratory DataMart and UKHSA laboratories, and is used to calculate the percentage of tests positive for SARS-CoV-2 among all SARS-CoV-2 tests conducted.
SARS-CoV-2 (COVID-19) PCR positivity in hospital settings remained stable in week 26, with a rolling 7-day positivity rate of 0.6% up to Sunday 28 June 2026. This is compared with 0.6% on the previous Sunday.
Influenza positivity in week 26 increased, with a rolling 7-day positivity rate of 0.6% up to Sunday 28 June 2026, compared with 0.4% on the previous Sunday.
Historical positivity for influenza this week may be slightly lower than compared to previous weeks due to an ongoing data quality issue which resulted in more tests than usual being removed for this week.
Figure 1. Rolling 7-day positivity of tests positive for SARS-CoV-2 among all reported SARS-CoV-2 tests, England 2022 to present [note 2] [note 3]
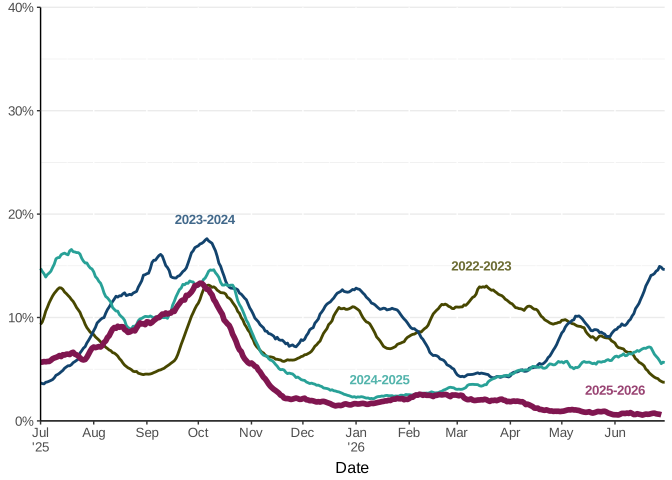
Note 2: data from previous seasons is aligned by day.
Note 3: testing policy and practice may change over time which can impact positivity rates, therefore comparisons over time should be interpreted with caution. Notable changes in testing policy occurred during 2022 to 2023, which are outlined in the data quality report.
Figure 2. Rolling 7-day positivity of tests positive for influenza among all reported influenza tests, England 2022 to present [note 2]
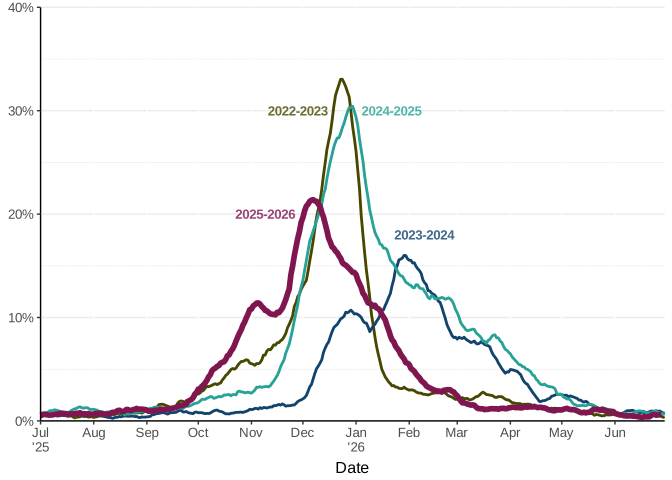
Note 2: data from previous seasons is aligned by day.
Respiratory DataMart System
Respiratory DataMart is a sentinel laboratory-based surveillance system where participating laboratories report positive and negative test results for a number of respiratory viruses from samples primarily taken in hospital. A small proportion of primary care samples are also included in this reporting.
In week 26, data is based on reporting from 7 out of the 14 sentinel laboratories.
In week 26, 2,720 respiratory specimens reported through the Respiratory DataMart System were tested for influenza. There were 8 positive samples for influenza: 6 influenza A (not subtyped), 0 influenza A (H3N2), 1 influenza A (H1N1)pdm09, and 1 influenza B. Overall, influenza positivity decreased to 0.3% in week 26 compared with 0.4% in the previous week.
In week 26, 3,385 respiratory specimens reported through the Respiratory DataMart System were tested for SARS-CoV-2. There were 18 positive samples for SARS-CoV-2. SARS-CoV-2 positivity decreased slightly to 0.5% compared with 0.6% in the previous week, with the highest positivity in those aged between 45 and 64 years at 0.9%.
RSV positivity remained stable at 0.2%, with the highest positivity in those aged under 5 years at 0.8%.
Adenovirus positivity decreased to 2.3%, with the highest positivity in those aged between 5 and 14 years at 9.0%.
Human metapneumovirus (hMPV) positivity increased slightly to 1.0%, with the highest positivity in those aged between 5 and 14 years at 1.9%.
Parainfluenza positivity decreased to 1.9%, with the highest positivity in those aged under 5 years at 3.2%.
Rhinovirus positivity remained stable at 10.4%, with the highest positivity in those aged under 5 years at 27.3%.
DataMart data is provisional and subject to retrospective updates.
Figure 3a. Respiratory DataMart weekly percentage of tests positive for influenza, SARS-CoV-2, RSV and rhinovirus, England [note 4]
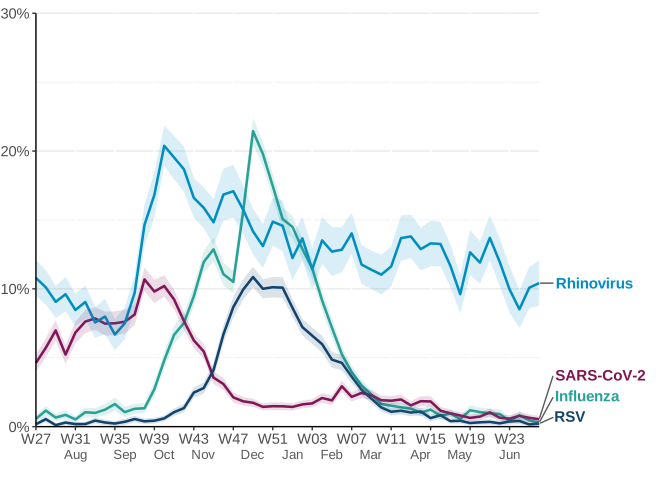
Note 4: shading represents 95% confidence intervals.
Figure 3b. Respiratory DataMart weekly percentage of tests positive for adenovirus, hMPV and parainfluenza, England [note 4]
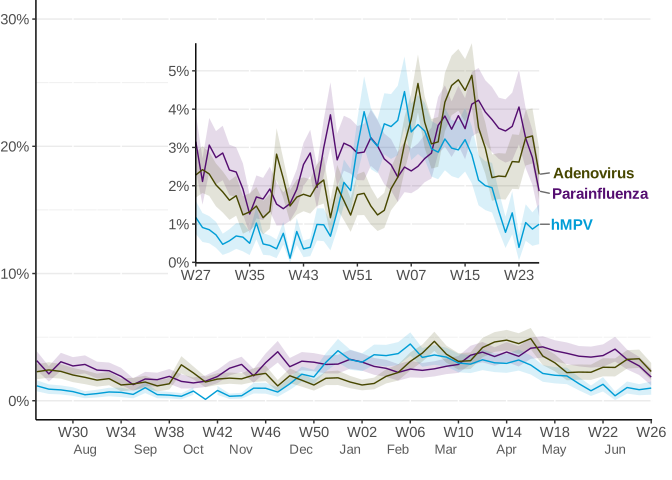
Note 4: shading represents 95% confidence intervals.
SARS-CoV-2 lineages
UKHSA conducts genomic surveillance of SARS-CoV-2 lineages.
This section provides an overview of circulating lineages in England, derived from data on sequenced PCR-positive SARS-CoV-2 samples in SGSS.
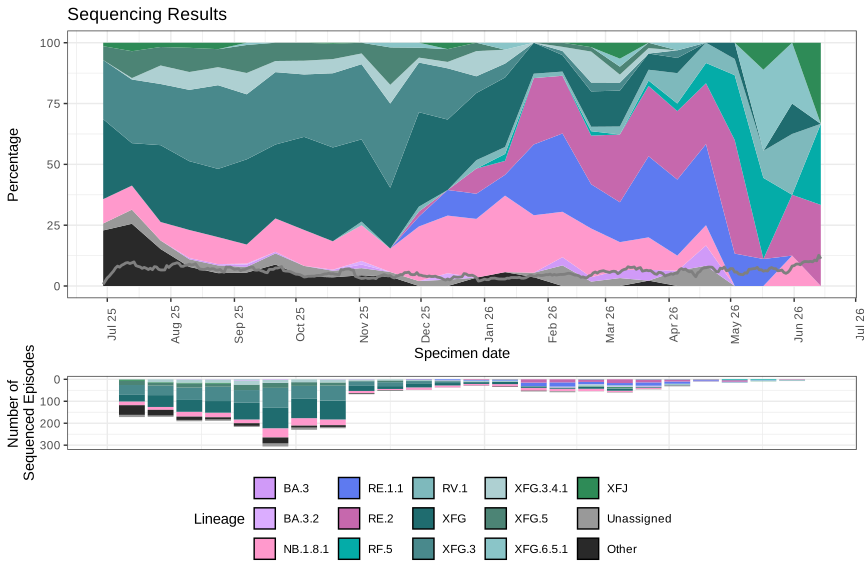
The prevalence of UKHSA-designated lineages among sequenced cases is presented in Figure 4.
To account for reporting delays, we report the proportion of lineages within COVID-19 cases that have had a sequenced positive sample between 25 May 2026 and 7 June 2026.
Of those sequenced in this period:
- 25 % was classified as XFG.6.5.1
- 25 % was classified as RV.1
- 25 % was classified as RE.2
- 12.5 % was classified as NB.1.8.1
- 12.5 % was classified as XFG
Note that low sequencing numbers, especially within the latest reporting period, will impact the accuracy of the prevalence estimates. These most recent figures should therefore be interpreted with caution.
Note that lineages will be grouped independently from their parent lineage once they reach sufficient prevalence, and may be re-grouped into their parent lineage if their prevalence subsequently falls. The data quality report contains more information on lineage groupings.
Figure 4. Prevalence of SARS-CoV-2 lineages amongst available sequenced cases for England from 23 June 2025 to 14 June 2026
Community surveillance
Syndromic surveillance
Syndromic surveillance collects data from various healthcare sources where presentations are classified by patterns of symptoms compatible with specific infections. In some settings, the syndromic diagnosis can be supplemented by (rapid) testing. In this report, ED attendances are displayed. Further details and data from other syndromic surveillance systems can be found in the syndromic surveillance weekly summaries.
During the week ending on 28 June 2026, ED attendances for acute respiratory infections & influenza-like illness remained low and similar to seasonally expected levels. ED attendances for COVID-19-like illness remained low. ED attendances for acute bronchiolitis (a syndrome related to RSV infection) remained low and were below seasonally expected levels.
Daily NHS 111 acute respiratory infection triaged calls were stable and below seasonally expected levels. GP in-hours consultation rates for influenza-like illness decreased and were similar to seasonally expected levels. GP out-of-hours daily contacts for acute respiratory infection and influenza-like illness both decreased and were similar to seasonally expected levels.
Figure 5. Daily emergency department attendances for acute respiratory infection nationally, England [note 5]
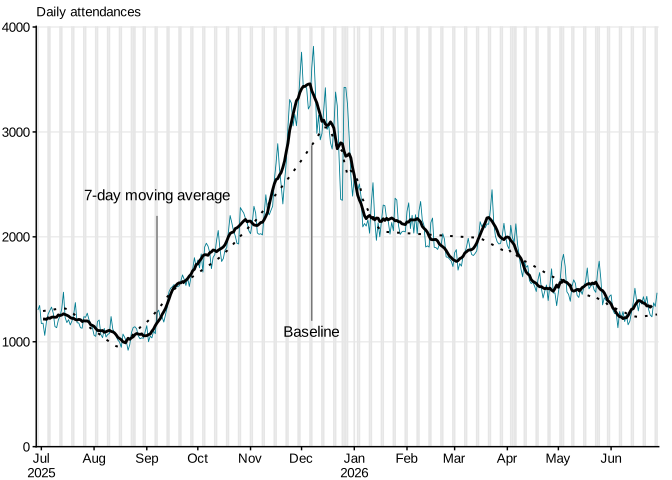
Note 5: 7-day moving average is adjusted for bank holidays. Grey columns show weekends and bank holidays.
Primary care surveillance
Primary care surveillance is undertaken in collaboration with the Royal College of General Practitioners (RCGP) Research and Surveillance Centre (RSC), using a national sentinel surveillance system of around 2,000 GP practices covering over 20 million registered patients of all ages across England. More information on the methodology can be found in the data quality report.
RCGP sentinel swabbing scheme in England
There were fewer than 50 samples with a result for week 26.
From week 40 2025, the RCGP sentinel swabbing scheme testing capability has been expanded to the UKHSA Bristol laboratory in addition to the UKHSA Colindale laboratory. Samples sent to Colindale are tested for influenza A and B, RSV A and B, SARS-CoV-2, hMPV, adenovirus, seasonal coronavirus and enterovirus/rhinovirus while samples sent to Bristol are tested for influenza A and B, RSV and SARS-CoV-2.
115 samples were taken in week 25 2026 through the GP sentinel swabbing, 106 were tested and 12 tested positive (Figure 6). As of week 4 2024, contemporaneous enterovirus differentiation has stopped. Starting from week 40 2025, samples with more than 7 days between the sample collection date and the symptom onset date have been excluded.
In week 25 2026, influenza positivity was 0.0%, SARS-CoV-2 positivity was 0.0%, and RSV positivity was 0.0%. 34 samples were tested in Bristol and 72 samples were tested in Colindale. In Bristol, 41.2% of the samples tested were from the South West.
In week 24 2026, influenza positivity was 0.7%, SARS-CoV-2 positivity was 0.7%, RSV positivity was 0.0%, adenovirus positivity was 2.4%, hMPV positivity was 2.4%, seasonal coronavirus positivity was 3.6%, and enterovirus/rhinovirus positivity was 20.2%. 52 samples were tested in Bristol and 84 samples were tested in Colindale.
Due to the number of samples which have not yet been categorised, data should be interpreted with caution when compared with previous weeks. The weekly positivity is not calculated when the number of samples with a result is fewer than 50.
Figure 6. Number of samples tested for respiratory viruses in England by week, GP sentinel swabbing scheme [note 6]
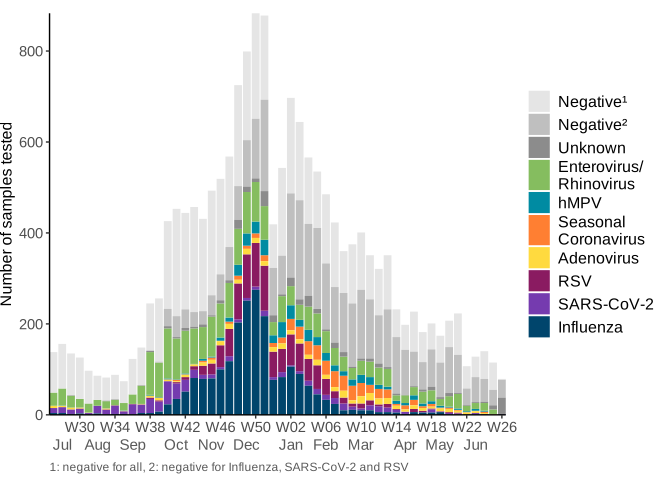
Note 6: unknown category corresponds to samples with no result yet.
Secondary care surveillance
COVID-19 hospital admissions
Surveillance of COVID-19 hospitalisations to all levels of care is mandatory, with data required from all acute NHS trusts in England.
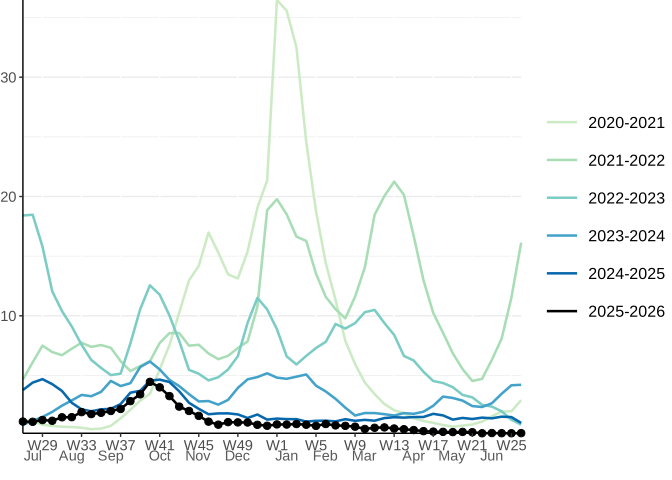
SARI Watch data is provisional and subject to retrospective updates. Rates are presented per 100,000 trust catchment population.
COVID-19 hospitalisations for all levels of care in week 26 2026 based on 89 NHS trusts in England were as follows:
-
the overall weekly hospital admission rate for COVID-19 slightly increased to 0.16 (compared with 0.15 per 100,000 in the previous week)
-
hospital admission rates for COVID-19 were highest in the South West region (increasing to 0.41 per 100,000 compared with 0.26 in the previous week)
-
the highest hospital admission rate for COVID-19 was in those aged 85 years and over (slightly decreasing to 1.49 per 100,000 compared with 1.65 in the previous week)
COVID-19 ICU-HDU admissions in week 26 2026 based on 84 NHS trusts in England were as follows:
-
the overall ICU or HDU rate for COVID-19 remained low at 0.00 per 100,000 (compared with 0.00 per 100,000 in the previous week). Note that with low rates in critical care, small random fluctuations may occur
-
ICU or HDU admission rates for COVID-19 were highest in the East Midlands, East of England, London, North East, North West, South East, South West, West Midlands, Yorkshire and Humber region
-
the highest ICU or HDU admission rate for COVID-19 was in those aged between 0 and 4 years, between 5 and 14 years, between 15 and 24 years, between 25 and 44 years, between 45 and 54 years, between 55 and 64 years, between 65 and 74 years, between 75 and 84 years, 85 years and over
Figure 7. Weekly overall COVID-19 hospital admission rates per 100,000 trust catchment population reported through SARI Watch mandatory surveillance, England
ECMO admissions
Surveillance of extra corporeal membrane oxygenation (ECMO) admissions is based on data from severe respiratory failure (SRF) centres in the UK. Refer to the data quality report for additional information.
SARI Watch data is provisional and subject to retrospective updates.
There were 3 new ECMO admissions reported in week 26 2026 in adults:
-
1 was due to an ARI (other viral, bacterial or fungal)
- 1 was due to sepsis (non-respiratory origin)
- 1 was due to a non-infectious cause
Figure 8. Laboratory confirmed ECMO admissions in adults (COVID-19, influenza and non-COVID-19 confirmed) to severe respiratory failure centres in the UK [note 7]
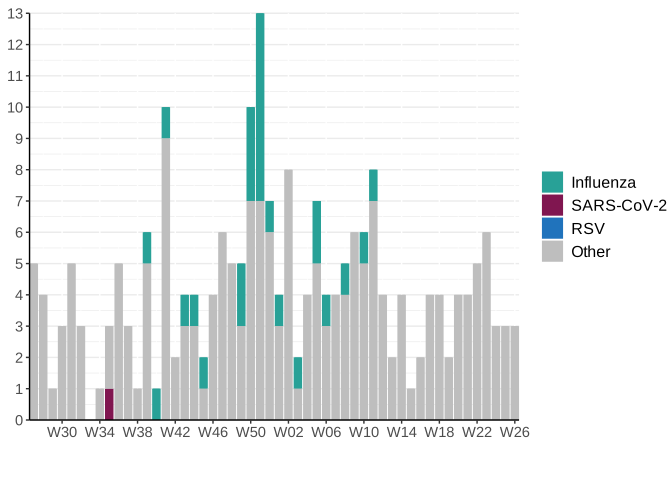
Note 7: The other group includes other viral, bacterial or fungal ARI, suspected ARI, non-infection (such as asthma, primary cardiac and trauma) and sepsis of non-respiratory origin.
Vaccine coverage
COVID-19 vaccine uptake in England
Cumulative data up to the end of week 26 2026 (Sunday 28 June 2026) was extracted from the Immunisation Information System (IIS). Data is extracted on the next working day following the end of reporting week (Monday 29 June 2026). Age is calculated as age on date of extraction.
Data is provisional and subject to change following further validation checks. Any changes to historic figures will be reflected in the most recent publication.
Spring 2026 campaign
The spring 2026 data reported below covers any dose administered from 13 April 2026 (ISO Week 16) provided there is at least 20 days from the previous dose. Eligible groups for the campaign are defined in Green Book chapter on COVID-19.
By the end of week 26 2026 (week ending 28 June 2026): - 56.5% (3,335,125 / 5,901,156) of all people aged 75 years and over and living and resident in England had been vaccinated with a spring 2026 dose since 13 April 2026 - 21.6% (323,389 / 1,497,469) of all people aged under 75 years with a weakened immune system and living and resident in England had been vaccinated with a spring 2026 dose since 13 April 2026 (Figure 9)
Figure 9. Cumulative weekly COVID-19 vaccine uptake by target group in England [note 8]
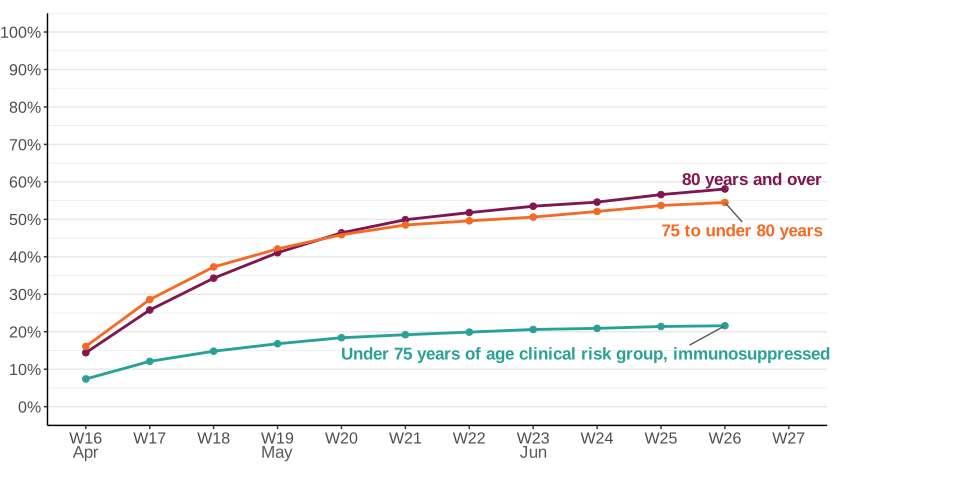
Note 8: the month is taken from the Monday of an international organisation for standardisation (ISO) week.
For data on the real-world effectiveness of the COVID-19 vaccines, please see the epidemiology of COVID-19 in England reports.
For COVID-19 management information on the number of COVID-19 vaccinations provided by the NHS in England, please see the COVID-19 vaccinations webpage.
For UK COVID-19 daily vaccination figures and definitions, please see the Vaccinations section of the UK COVID-19 dashboard.
Since the 19 December 2024, monthly data for frontline healthcare workers has been published. This covers vaccinations that were given between 1 September 2024 and 28 February 2025 and is available under the joint flu and COVID-19 vaccine uptake report.
International updates
For further information on the global respiratory virus situation see the World Health Organization (WHO) Global respiratory virus weekly updates.
For further information on respiratory viruses in Europe see the European Respiratory Virus Surveillance Summary (ERVISS).
For further information on respiratory viruses in the Americas see Pan American Health Organisation Influenza, SARS-CoV-2, RSV and other respiratory viruses. For further information on respiratory viruses in the United States of America see Centre for Disease Control respiratory virus activity levels. For further information on respiratory viruses in Canada see the Canadian respiratory virus surveillance report.
For further information on respiratory viruses in Australia see Australian Respiratory Surveillance Reports.
Other respiratory viruses
For further information on avian influenza see the latest WHO update on 29 May 2026.
For further information Middle East respiratory syndrome coronavirus (MERS-CoV) see the WHO MERS situation update.
Further information on the management and guidance of possible MERS cases.
Data sources and methodology
For additional information regarding data sources of this report refer to the sources of surveillance data for influenza, COVID-19 and other respiratory viruses.
Background information
Related links
National flu and COVID-19 surveillance reports: 2025 to 2026 season
Influenza in the UK, annual epidemiological reports
Epidemiology of COVID-19 in England
Weekly all-cause mortality surveillance: 2025 to 2026
Further information and contact details
Feedback and contact information
You are welcome to contact us directly by emailing respdsr.enquiries@ukhsa.gov.uk to provide feedback and for all queries relating to this document including any comments about how we meet these standards.
Alternatively, you can contact OSR by emailing regulation@statistics.gov.uk or via the OSR website.
Official statistics
Our statistical practice is regulated by the Office for Statistics Regulation (OSR). OSR sets the standards of trustworthiness, quality and value in the Code of Practice for Statistics that all producers of official statistics should adhere to.
UKHSA is committed to ensuring that these statistics comply with the Code of Practice for Statistics. This means users can have confidence in the people who produce UKHSA statistics because our statistics are robust, reliable and accurate. Our statistics are regularly reviewed to ensure they support the needs of society for information.