MHCLG enabled spend statistics, 2024-25: Technical notes
Published 28 May 2026

© Crown copyright 2026
This publication is licensed under the terms of the Open Government Licence v3.0 except where otherwise stated. To view this licence, visit nationalarchives.gov.uk/doc/open-government-licence/version/3 or write to the Information Policy Team, The National Archives, Kew, London TW9 4DU, or email: psi@nationalarchives.gov.uk.
Where we have identified any third party copyright information you will need to obtain permission from the copyright holders concerned.
This publication is available at https://www.gov.uk/government/statistics/mhclg-enabled-spend-statistics-2024-25/mhclg-enabled-spend-statistics-2024-25-technical-notes
1. General details
Title of output: Ministry of Housing, Communities and Local Government (MHCLG) and selected arm’s-length bodies (ALB) enabled spend statistics
Coverage: Spend enabled by the Ministry of Housing, Communities and Local Government, Homes England and Planning Inspectorate during the financial year 2024-25
Contact details: subnationalexpenditure@communities.gov.uk
2. Official statistics in development
The statistics presented in this publication are official statistics in development. These are new statistics providing estimates of spend enabled by MHCLG and its Arms Length Bodies (ALBs) Homes England and the Planning Inspectorate[footnote 1] at a granular level of geography (local authority districts).
Official statistics in development are official statistics that are undergoing development; they may be new or existing statistics, and will be tested with users, in line with the standards of trustworthiness, quality, and value in the Code of Practice for Statistics. Official statistics in development were previously called ‘experimental statistics.’
Our statistical practice is regulated by the Office for Statistics Regulation (OSR). OSR sets the standards of trustworthiness, quality and value in the Code of Practice for Statistics that all producers of official statistics should adhere to. You are welcome to contact us directly with any comments about how we meet these standards. Alternatively, you can contact OSR by emailing regulation@statistics.gov.uk or via the OSR website.
3. Summary
MHCLG enabled spend statistics is an annual publication that estimates MHCLG, Homes England and Planning Inspectorate spend by local authority district in the United Kingdom (UK). Data is sourced from MHCLG, Homes England and Planning Inspectorate financial systems and reported on a cash expenditure basis as per monthly transparency publications; as well as published local government finance data – see ‘Quality - suitable data sources’ section below. Outputs are presented using December 2025 geography boundaries, where these have not been available the latest available geographies have been used.
This document provides an overview of the statistics and the process by which the annual statistical bulletin and associated data tables are brought together.
The Code of Practice for Statistics was updated by the UK Statistics Authority in October 2025 to set standards for organisations in producing and publishing official statistics and ensure that statistics serve the public good.
The text below sets out a summary of how we have complied with the Code of Practice for Statistics, and further details are included in the sections below.
Trustworthiness
To show trustworthiness:
T1 Show integrity
Data is collected from government administrative systems and publications, and quality-assured by government analysts and programme leads. The statistics are published to serve the public good, inform public debate, and enhance policy transparency.
T2 Lead responsibly
Teams of skilled and trained professionals, collect, process, check, and present the statistics in accordance with the Code of Practice for Statistics, with outputs signed off by a Senior Civil Servant Analyst.
T3 Be transparent
MHCLG produces these annual statistics to enhance government spend reporting and transparency, with ongoing user consultation, timely releases, and transparent revisions. We pre-announce the publication date online. Pre-release access is provided to named individuals 24 hours before release and this information is available online.
T4 Manage data responsibly
Data is collected from existing government administrative systems and publications, including voluntary contributions. It is processed according to MHCLG standards and excludes personal or sensitive data.
Quality
To ensure the statistics are of suitable quality:
Q5 Prioritise quality
The data, statistics and methodology undergo a robust multi-layered quality assurance process including quality checks in collection, systematic review of the code pipeline, peer review, programme team sign off and sign off by a Senior Civil Servant Analyst. Several improvements have been implemented to continue to improve quality standards and methods.
Q6 Be rigorous
Suitable data sources including data from MHCLG and ALB finance systems and published data have been used in these statistics. This data is processed using a rules-based approach, developed and quality assured with MHCLG teams, to mitigate limitations and accurately reflect place-based spend.
Q7 Be open about quality
Each release includes guidance on the uses and limitations of the statistics and a list of things the users need to know. The data sources used, processing steps, impact of any data limitations or quality issues and the mitigations taken are explained within these technical notes.
Value
To ensure the statistics are valuable:
V8 Be relevant
These statistics aim to provide transparent information on place-based MHCLG and ALB spend at the local authority district level across the UK, informing public debate, policy, and accountability, with ongoing user feedback to drive improvement.
V9 Be clear
The statistics aim to be presented in a clear, unambiguous way with simple visualisations and guidance to support users including how data should and shouldn’t be interpreted.
V10 Be accessible
The statistics and data are publicly accessible and are available in charts, tables, and downloadable formats, adhering to government guidance.
4. Concepts and definitions
Central or non-geography specific spend: Direct MHCLG and ALB spend that benefits an organisation or programme in its entirety and/or that cannot be attributed to a specific geography. Examples of this include spend on core functions such as central administration, IT or research.
MHCLG enabled spend: The combination of direct in-year spend by MHCLG and two of its ALB recorded on a cash expenditure basis; and MHCLG funding delegated to local authorities.
Spend segment: Segments are used to record the specific programme or activity associated with the spend. Segments are closely related to MHCLG programmes, one or more segments will make up the scope for a programme within MHCLG.
5. How the data is processed
These statistics estimate the geographic distribution of spend enabled by MHCLG and selected arm’s length bodies (ALBs). The data is processed by combining multiple data sources and applying a set of rules to standardise spend to a local authority level.
The process involves four main steps:
1. Collecting data on spend
We use two primary data sources:
- Financial data from MHCLG, Homes England and the Planning Inspectorate, which records direct in-year expenditure on a cash basis.
- Published Core Spending Power data, which provides a measure of funding made available to local authorities through the local government finance system.
Together, these sources provide a comprehensive picture of MHCLG-enabled spend.
2. Deriving initial geographies
Where possible, we determine the geography of each spend record based on the expenditure recipient name.
- Where the expenditure recipient is a geography we use approximate string-matching scripts to match these expenditure recipient names to standard geography from the Office of National Statistics.
- Where the expenditure recipient cannot be matched in this way, for example for organisations or companies, the IDBR dataset was also used to match against standard geographies where the entity operates.
By using IDBR dataset we reduce the impact of the “headquartering effect”
3. Apportioning spend to local authority districts
As not all funding is initially allocated at local authority district level, where funding is allocated to wider or different geographies (for example, upper-tier authorities or programme-specific areas), we apportion it to a standardised geography of lower tier local authority level.
This is done using a rules-based approach, developed with programme teams. Depending on the programme, this may involve:
- Allocating spend using known values provided by programme teams
- Splitting funding in proportion to population or dwellings
- Using other indicators that better reflect how funding is intended to be distributed
These methods are designed to produce consistent and comparable estimates across all geographies and programmes.
4. Identifying non-geographic (central) spend
Some spend cannot be attributed to a specific location, such as administrative or national-level costs. This is identified and recorded as “central / non-geography specific” and is not assigned to local authority districts.
These steps result in a dataset where all possible spend is assigned to a local authority district, allowing for consistent comparison of MHCLG-enabled spend across the UK. Where necessary, assumptions are used, and these are described in more detail in the sections below.
6. Further detail on the Statistics Code of Practice
Trustworthiness
T1 Show integrity
The data has been collected from government administrative systems and existing government publications. All organisations concerned in the collection, processing, checking and presentation of the data/statistics comply with the Civil Service Code and the Seven Principles of Public Life. The publication of these statistics is intended to serve the public good and inform public debate and policy through greater transparency.
These data and statistics have been produced and checked by government analysts and programme leads through a robust quality assurance process – see ‘Quality’ section below.
T2 Lead responsibly
Teams involved in collecting, processing, checking and presenting the data/statistics include professional statisticians, data scientists, data analysts, finance professionals and data engineers. They are skilled, trained and supported in their own areas of expertise, applying the principles of the Code of Practice for Statistics and acting with integrity, honesty, objectivity and impartiality.
The outputs in this publication have been signed off by a Senior Civil Servant Analyst.
T3 Be transparent
These statistics are produced by MHCLG. This publication is a core output to help MHCLG deliver its commitment to improving how UK government spend is collated and reported. The development plan published alongside this document provides greater transparency on how users will be consulted to ensure these statistics remain valuable; and how these statistics will be improved.
This is the third publication of these data and statistics and will continue to be published on a timely basis and at intervals that meet the needs of users as far as practicable. These statistics have been published on an annual basis. We will continue to assess user needs to ensure this frequency is appropriate. The date of this publication is announced in advance in line with the Code of Practice for Statistics.
Pre-release access to these statistics is granted, in accordance with the relevant legislation, to a limited number of named individuals for a period of up to 24 hours before publication. Scheduled revisions or unscheduled corrections to the statistics and data will be released as soon as practicable and handled transparently in accordance with our revisions policy.
T4 Manage data responsibly
Data is collated from existing government administrative systems and existing government publications. All data processing has been carried out to MHCLG standards using reproducible and reviewed code, ensuring accuracy and review before release. No personal or sensitive data is included.
This publication draws on administrative data systems and openly published data sources. Where data has been collected from MHCLG and two of its ALBs, this has been done on a voluntary basis. All efforts have been made to reduce the data collection burden as much as possible.
Quality
Q5 Prioritise quality
These data and statistics have undergone a robust quality assurance process. This process can be broken down into multiple layers of quality assurance.
Quality checks in collection
Data extracted from MHCLG and ALB financial systems undergoes automated quality checks as they are submitted. These basic quality checks ensure the data follows a coherent schema and correct value types are provided. Where issues are flagged, this is communicated directly to the data provider and actions are taken to ensure the data is reviewed and correctly reflects the source system.
Systematic review of the code pipeline
The methodologies described under ‘sound methods’ are applied through a version-controlled pipeline. This code pipeline uses reproducible Python scripts to:
- Read the original enabled spend data.
- Remove any payments made to Other Government Departments that are not included in this analysis. 3. Apply geospatial data science techniques to produce necessary geography lookups. 4. Derive geographies from expenditure recipients using approximate string matching against both ONS geography tables and the IDBR database. 5. Apportion funding to local authority districts. 6. Filter the data to exclude any payments made to organisations based overseas. 7. Tag central spend.
- Generate a full improved dataset of MHCLG and ALB enabled spend. 9. Aggregate the data to produce the tables in the statistical tables file. 10. Produce the statistics and graphs that are including in the bulletin.
Any change to the code pipeline is reviewed by at least one analyst before it is made. This ensures that the entire code pipeline has been produced and reviewed by at least two analysts as it was developed.
Peer review of the code pipeline
The methodologies used and their operationalisation into code have been peer-reviewed by members of the wider team not directly involved with producing these statistics.
Programme team sign off
Specific methodologies related to those programmes which make up over 98% of MHCLG enabled spend were developed in collaboration with the relevant MHCLG programme teams. Programme-specific lookups go through a three-stage quality assurance process involving at least two analysts. Final methodologies and data distributions underwent a final review by programme leads to ensure they were consistent with the approach used for programme allocations.
Specific quality assurance checks on outputs
A list of final document quality assurance checks is provided below and these are signed off by a Senior Civil Servant Analyst:
The statistical bulletin
- All figures in the text can be replicated from the raw data
- All graphs can be replicated from the raw data
The statistical tables
- All tables can be correctly replicated from the raw data
- Any common figures between tables match each other
The improved dataset
- The total value of the full processed dataset matches the value of the original data (accounting for data excluded as overseas or direct MHCLG and ALB spend)
- Full processed dataset volume and value can be replicated from the raw data
- All data that has been enriched with external databases has been checked with data from the correct source
- All data that should be redacted has been redacted
- No personally identifiable information can be found in the data
Continuous improvement
These statistics are published as official statistics under development due in part to the experimental nature of the methodologies used. The data produced is the third iteration of the publication, demonstrating the location of MHCLG enabled spend at a standardised and granular level of geography. The previous publications DLUHC enabled spend statistics, 2021-22 and 2022-23 and MHCLG enabled spend statistics, 2023-24 are available for viewing online. They have been produced through the development of reproducible data science pipelines and the use of open-source coding tools such as Python. We will continue to look for opportunities to improve our products, including through the use of new tools and techniques.
Several improvements have been made during the development of the statistics for the 2024-25 publication:
- Improvements to the use of IDBR to increase accuracy of apportionment for business recipients.
- Updated and standardised codebase to follow best practice and allow ease of future repeatability, alongside increased logging outputs, enabling reduced downtime due to data pipeline issues.
- Updated the codebase to allow for more flexibility to account for LA Boundary Changes.
- Streamlined data transformation pipeline, including refactoring code and removing redundant code.
- Improved data pipeline scripting, building upon input lookups, enabling increased matched apportionment outputs.
Q6 Be rigorous
We aim to use suitable data sources and appropriate methods to produce reliable statistics, ensuring consistent and accurate processing.
Suitable data sources for MHCLG enabled spend
The first is data extracted directly from the finance systems of MHCLG and two of its ALBs: Homes England and the Planning Inspectorate. This finance system data has been collected through the MHCLG Finance Team; and is used to measure direct spend by MHCLG and the two ALBs named.
Spend data recorded on these systems provide the most accurate measure of in-year spend for these organisations. Data is provided on a cash expenditure basis. A financial year refers to when a payment is made, not when the funding is used to provide a service. It is also worth noting that we would not necessarily expect these measures of actual cash expenditure to match published programme allocations where payments may have been made in separate financial years.
The data excludes any overseas payments and excludes staff payroll. Payments from MHCLG to other government departments such as Cabinet Office have been excluded from direct MHCLG spend.
In addition, payments from MHCLG to the two ALBs (Homes England and Planning Inspectorate) have also been excluded from direct MHCLG spend to avoid double counting. The data is supplied in a consistent format following a common schema and quality checks are embedded within the data collection system. This ensures data submitted by different organisations is coherent from submission.
The second data source is published measures of Core Spending Power, identified as the best available proxy of funding and revenue raising ability delegated to local authorities. This includes council tax, locally retained business rates, and grant funding, and is referred to as ‘delegated’ spend throughout the publication, in recognition of the fact this funding is made available to Councils through MHCLG’s local government finance system. Capturing MHCLG funding delegated to local authorities is essential as it represents a large proportion of total MHCLG enabled spend (over 84% in 2024-25). While there are inherent differences between Core Spending Power and finance system data which limit the ability to make meaningful comparisons between the two, capturing funding delegated to local authorities provides a more complete picture of the geographic spread of MHCLG enabled spend across the UK.
Core Spending Power is not the only possible proxy of MHCLG funding delegated to local authorities. However, unlike other measures such as local authority Revenue Outturn, it differentiates MHCLG funding from wider central government funding. As we develop these statistics, we will continue to review whether Core Spending Power remains the most appropriate proxy.
Geographic comparability is a primary aim of this publication. Data quality has been strengthened (see below) to ensure MHCLG enabled spend can be compared at the level of the local authority district. Spend at different levels of geography has been apportioned for comparability. The methods to do so are experimental, and are, necessarily, in part assumption based - see ‘Sound methods’ section below. Coherence over time is ensured as common methodologies are used across the different time periods covered.
Many MHCLG functions in England are devolved in Scotland, Wales and Northern Ireland, therefore the devolved administrations will have received funding through the block grant (based on the Barnett formula) and allocated funding in line with their priorities. Consequently, MHCLG enabled spend per person is in addition to that already received via their block grants, and comparisons with spend in England are not meaningful.
As a result of how existing finance systems are set up, there are a few limitations of the direct MHCLG and ALB data to note. All efforts have been made to minimise the effects of these limitations through our methodology - see ‘Quality - sound methods’ below.
-
Headquartering effects: Original geographic locations of expenditure recipients relate to the location where an organisation receives payments. In many instances this is likely to be the organisation’s headquarters and not the location where services are provided.
-
Differing geographies of spend: Different programmes employ different methodologies to allocate funding; and allocate funding to different levels of local authorities. For example, some programmes allocate funding to towns (or ‘Built-Up Areas’) while others allocate funding to mayoral combined authorities (MCA).
-
Central or non-geography-specific spend: The data includes payments for central costs, the benefits of which cannot be attributed to any specific geography. This includes costs related to categories such as central administration and IT systems.
Other data sources used
For a full list of other data sources used see Annex 1 - Other data sources.
Geographic boundaries have been used extensively through our methodology. Where this is the case, we have consistently used boundaries as available on https://geoportal.statistics.gov.uk/. Where possible December 2025 boundaries have been used, the latest available in the lead-up to publication. Where December 2025 boundaries have not been available, we have used the latest available for boundaries and geography lookups to produce these statistics.
Drawing on high-quality estimates of resident population is key for this publication - as our methodology relies on apportioning funding based on population. The primary sources of resident population are:
-
the Office for National Statistics 2021 Census for England and Wales
-
National Records of Scotland Mid-2021 population estimates for Scotland
-
Northern Ireland Statistics and Research Agency 2021 Census for Northern Ireland
When presenting our statistics, we make use of the Area Cost Adjustment (ACA) (https://www.gov.uk/government/publications/area-cost-adjustment-values-table). The ACA is a tool used to measure the variation in costs of service delivery for local authorities in England and is a useful index for cost adjustment when making spend comparisons across local authorities.
The dataset includes many expenditure recipients as private companies. As outlined above, these recipients often suffer from the headquartering effect. To enrich the dataset with a more accurate representation of this spend, the Inter-Departmental Business Register (IDBR) produced by ONS has been used to enhance our apportionment methodology. The IDBR dataset enables the identification of trading locations of these recipients (rather than headquarters), thus improving the accuracy of spend distribution.
Programme-specific methodologies may draw on other data sources. These are detailed in Annex 1: Other data sources.
Sound methods
A rules-based approach was used to minimise the effect of the data limitations presented above and ensure our statistics most accurately reflect place-based spend enabled by MHCLG across each local authority district. This approach was developed in collaboration with - and quality assured by MHCLG teams leading on those programmes that make up the large majority (over 98%) of MHCLG enabled spend.
Deriving geographies from expenditure recipients
To address some of the headquartering effect limitation, and because an important share of MHCLG funding goes to local authorities (over 96% in 2024-25), we sought to derive local authority geographies from the names of expenditure recipients.
To do this, we developed approximate string-matching scripts to automatically match these expenditure recipient names to standard geography names from the Office for National Statistics.
The IDBR dataset was also used to match any remaining expenditure recipients not matched against a standard geography. Automatic matches were then reviewed and quality assured by at least two analysts.
Where we could not use the expenditure recipient name to derive the local authority geographies, we kept the original geographies which relates to the location where an organisation receives payments.
Due to this, there may be residual headquartering effects in the data. However, this is thought to affect only a small percentage (less than 0.4%) of total MHCLG enabled spend which could not be string matched or matched with the IDBR dataset.
Apportioning funding down to a standard local authority district level
A primary aim of our publication is to provide estimates of MHCLG enabled spend which most accurately represents the geography where MHCLG enabled services are located.
We apportion spend to the standard geography level of lower tier local authority district to provide consistency and enable comparison and analysis between geographies and MHCLG programmes.
To produce these estimates, we have used the following approach to apportion funding. This approach was developed with MHCLG programme leads to ensure our statistics best reflect the funding dynamics of each programme.
Important notes:
-
This apportionment approach is in part based on assumptions, made in collaboration with programme experts.
-
MHCLG enabled spend is not always allocated to local authority districts. In some cases, it is allocated at upper tier local authority or mayoral combined authority areas. In these cases, the way funding is subsequently distributed is often decided by these larger local authorities. Where we have apportioned spend to local authority district, it is an illustrative estimate.
A simplified version of the apportionment approach is visualised in the following diagram.
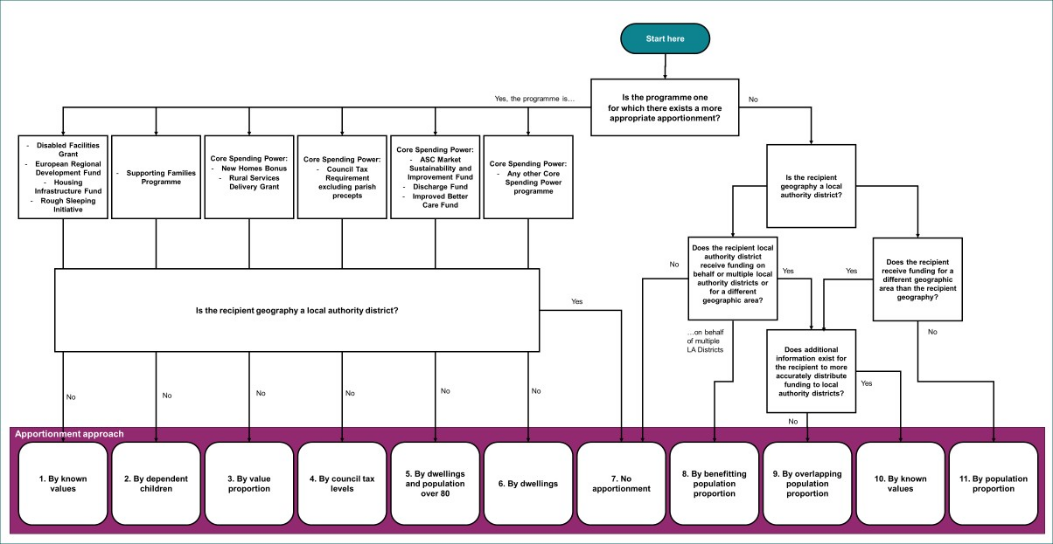
| Apportionment approach | Description | Example |
|---|---|---|
| 1. By known values | Split the funding across benefitting local authority districts, according to known values. | Lancashire County Council receives £100. It is known that £16 is for Burnley local authority district. Burnley is apportioned £16. The same is done for other component local authorities of Lancashire Council. |
| 2. By dependent children | Split the funding across all local authorities that overlap with the recipient geography, using the number of families with dependent children. | £100 funding for East Sussex County Council is split between its component local authority districts. As 17% of East Sussex households which have dependant children are in Eastbourne local authority district, £17 is apportioned to Eastbourne. The same is done for other local authorities Hastings, Lewes, Rother and Wealden. |
| 3. By value proportion | Split the funding across benefitting local authority districts, according to the proportions received directly at lower-tier local authority level. | Cambridgeshire County Council receives £100. Within this upper tier authority, several lower tiers receive separate direct amounts. Fenland district receives £30, Huntingdonshire receives £15 and South Cambridgeshire receives £5. Cambridge and East Cambridgeshire receive no direct amount. Fenland, Huntingdonshire and South Cambridgeshire will receive a proportional amount from that received by Cambridgeshire: 60%, 30% and 10%. |
| 4. By council tax levels | Split the funding across all overlapping local authority districts based on council tax levels within each of those districts. | Nottinghamshire County Council receives £100. The council tax levels for Mansfield are 11% of the overall tax levels within Nottinghamshire. £11 will therefore be apportioned to Mansfield. This will be repeated for the other local authorities within Nottinghamshire. |
| 5. By dwellings and population over 80 | Split the funding across all local authority districts that overlap with the recipient geography, by number of dwellings and resident population over the age of 80. | £100 funding for Norfolk Council is split between its component local authority districts based on each district’s share of dwellings and share of population aged 80 and over. Within Norfolk, Breckland accounts for 14% of dwellings and 16% of the population aged 80 and over. These shares are averaged to give 15% so £15 is apportioned to Breckland. The same is done for other local authorities Broadland, Great Yarmouth, King’s Lynn and West Norfolk, North Norfolk, Norwich and South Norfolk. |
| 6. By dwellings | Split the funding across all local authority districts that overlap with the recipient geography, by number of dwellings. | £100 funding for East Sussex County Council is split between its component local authority districts. As 19% of East Sussex dwellings are in Eastbourne local authority district, £19 is apportioned to Eastbourne. The same is done for other local authorities Hastings, Lewes, Rother and Wealden. |
| 7. No apportionment | Keep the funding at the geography of the recipient local authority district. | Cumberland Council receives £100 for use in the Cumberland local authority district area. £100 remains apportioned to Cumberland. |
| 8. By benefitting population proportion | Split the funding across all benefitting local authority districts, by resident population. | Glasgow City Council receives £100 on behalf of 8 local authority districts. Glasgow’s population represents 34% of the wider group’s population. Glasgow local authority district is apportioned £34. The remaining £66 are split among the other 7 local authority districts according to their population. |
| 9. By overlapping population proportion | Split the funding across all the local authority districts that overlap with this different geography, by resident population | Leicestershire County Council receives £100 for the East Midlands Freeport. 18% of the Freeport’s outer boundary population is estimated to live in Derby. Derby local authority district is apportioned £18. The same is done for other local authority districts that overlap with East Midlands Freeport. |
| 10. By known values | Split the funding across the local authority districts that benefit, using known values. | Bury Council receives £100. It is known for this recipient for a particular programme that £71 has been received on behalf of other local authorities and is to be distributed based on known values. Bury retains £29 and the other districts receive a proportion of £71 based on the weighting provided by the programme. Other bespoke apportionment methods exist for different programmes in this method. |
| 11. By population proportion | Split the funding across all local authority districts that overlap with the recipient geography, by resident population. | Suffolk County Council receives £100 for use in Suffolk County. 18% of Suffolk’s population is estimated to live in the Ipswich. £18 is apportioned to the Ipswich local authority district. The same is done for other local authority districts that overlap with Suffolk County. |
Default approach
Where the geography (derived from recipient names where possible; original otherwise) of the recipient is already at local authority district level, no apportionment has been made.
Where the geography of the recipient is at a level other than the local authority district level (such as payments made to a County Council in England like Suffolk County Council), spend has been apportioned to the local authority districts which overlap with this recipient geography (in the example of Suffolk County Council: Babergh, Ipswich, Mid Suffolk, East Suffolk and West Suffolk), proportionally to the estimated resident population in each area of overlap.
For example, if the recipient’s geography is the West of England Mayoral Combined Authority, approximately half of the spend would be attributed to the Bristol City Council’s geography, as Bristol City Council accounts for approximately half of the population of the West of England Mayoral Combined Authority. The remaining spend would be apportioned to the geographies covered by Bath and North East Somerset Council and South Gloucestershire Council, as these also form part of the West of England Mayoral Combined Authority.
For non-administrative geographies, such as Fire and Rescue Authority areas, spatial analysis was conducted to estimate the resident population living in the geographic overlap between each area and a local authority district.
Exceptions to the default approach
Going beyond the default approach, we worked with MHCLG programme teams leading on those programmes which make up over 98% of MHCLG enabled spend to ensure our apportionment methodology is appropriate. While the default approach was appropriate for most programmes, specific exceptions were made for some programmes. This was done to ensure our estimates are as close as possible to the true geographic spread of MHCLG enabled spend. These exceptions are presented below.
The New Homes Bonus and Rural Services Delivery Grant, which form part of Core Spending Power, are allocated by central government to a combination of Local Authorities and upper‑tier authorities (County Councils, and Fire and Rescue Authorities in the case of the Rural Services Delivery Grant). For the purposes of these statistics, funding allocated at upper‑tier level is apportioned to local authority districts. This is done using ratios based on the relative shares of funding allocated directly to Local Authorities.
For the Council Tax Requirement component of Core Spending Power (excluding parish precepts), amounts set at County Council, Fire and Rescue Authority and Combined Authority level are apportioned to local authority districts based on Council Tax levels set by local authorities in England (council tax base for council tax setting purposes).
For all other components of Core Spending Power, funding allocated at higher geographic levels was apportioned to local authority districts in proportion to the estimated number of dwellings in each district. This is to reflect that Core Spending Power has historically been expressed per dwelling.
For greater accuracy regarding the Adult Social Care (ASC) Market Sustainability and Improvement Fund, Discharge Fund and Improved Better Care Fund an additional metric is further added in the calculation. Estimated resident population over 80 years old is used in conjunction with the estimated number of dwellings to show the emphasis on adult social care for these three Core Spending Power programmes.
For the Supporting Families Programme, spend was apportioned based on the number of households with dependent children in each recipient local authority district, instead of the resident population. This provides better estimates for this programme as it more closely matches the programme’s funding allocation methodology.
Where a local authority receives funding on behalf of a wider group of local authorities, the spend was assumed to be split among all intended local authorities according to their relative resident populations. This is the case for the UK Shared Prosperity Fund where programme records identify the local authorities intended to benefit from each payment in Northern Ireland. For each payment, funding is then apportioned between these local authorities according to their relative resident populations.
Where a local authority receives funding on behalf of a wider or different geography, the spend is assumed to be split among all intended local authorities within with the wider or different geography, according to their relative resident populations. This is the case for:
- Freeports, where funding is paid to an accountable local authority on behalf of a Freeport area that spans multiple local authority districts
- Local Regeneration Fund – Towns Regeneration, where local authorities receive funding for a town (or ‘Built-Up Area’)
- Local Regeneration Fund where expenditure recipients are non-geographic bodies and the programme team has provided the benefitting geography
- Brownfield Housing Fund, where specific expenditure recipients are first mapped to known ONS geographies before the apportionment step is applied
In some cases, programme teams collect and hold more detailed information about spend location than is recorded in MHCLG financial systems. Where this is the case, we drew on their domain knowledge and existing documentation to ensure each payment is assigned to the correct local authority district. This is the case for:
- Disabled Facilities Grants
- Housing Infrastructure Fund
- Rough Sleeping Initiative
Similarly, for some programmes, programme teams provided additional information to support apportionment where expenditure recipients were not linked to a specific geography or where further detail was required. This applied to a small number of recipients in the following programmes; all other lines followed the standard apportionment approach:
- Affordable Homes Programme
- Homes England (formerly Homes and Communities Agency or HCA) - Land Assembly Fund
- Homes England (formerly Homes and Communities Agency or HCA) - Single Land Programme
- Housing Building Fund
- Building Safety Fund
- Social Cohesion
- Planning Inspectorate
Tagging central spend
Central spend is where there is non-geography-specific spend or spend on core functions such as administration, commercial, information technology or research.
Central spend was identified in two ways:
-
By segment: Following a review of direct MHCLG and ALB spend segments, we identified a list of segments which represent central, or non-geography-specific spend.
-
By expenditure recipient: For those programmes which represent over 98% of MHCLG enabled spend we have checked each expenditure recipient to determine whether they received payments for central costs. This was quality assured by the relevant MHCLG programme teams.
For all spend lines under these segments and expenditure recipients we have set the geography to “Central/ Non-geography specific”. This spend is therefore not assigned to any UK geography.
For the remaining 2% of payments which were not prioritised for additional scrutiny, we used the list of expenditure recipients identified in the above step to determine if any additional payments should be set to “Central/ Non-geography specific”.
Q7 Be open about quality
This technical note accompanies each statistical release and it explains our sources and processing, highlighting any potential issues in data quality and outlining what steps we take to mitigate them, for example how we address headquartering effects. Details on data sources can be found in the ‘Quality – Be rigorous’ section above.
Things you need to know about this release
Each release includes guidance on the uses and limitations of the statistics and a list of things the users need to know. This includes limitations of the data, information on the apportionment methodology and guidelines on meaningful comparisons. These include:
-
These are official statistics in development, designed to improve the collective understanding of how MHCLG spends money across the UK. They build on the previous publications starting from 2021, and assign individual items of spend to the local authorities that the spend is located in.
-
The methodology used is set out in these Technical Notes including assumptions used to apportion funding to local authorities where it has been allocated at different levels of geography. This methodology will continue to be refined for future publications, and the conclusions drawn may change as a result.
-
The figures in this publication should be treated as best estimates.
-
‘Central spend’ in this publication is where spend for a sub-segment, project or recipient relates solely to core functions such as administration, commercial, travel service provider, etc. or spend that doesn’t benefit a specific geographical location and facilitates the provision of nation-wide service e.g. telephone helplines. For all these types of spend lines we have set the geography to “Central / Non geography specific”. This spend is therefore not assigned to any local authority district.
-
Refinements in apportionment methodology have resulted in a more accurate reflection of local authority spend. Therefore, making comparisons year on year may not provide a true representation of spend over time.
-
Due to changes within spending segments and geography boundaries, year on year comparisons at a granular level i.e. by individual spending segments and local authorities will not be meaningful.
-
As a result of the methodology used – which is based on actual payments made – estimated programme-specific spend figures may differ from published allocations, which set out the maximum funding set aside for a programme to provide its services. This is especially the case where payments are made in one financial year to provide services in another.
-
We use Core Spending Power data as a measure of the ringfenced and non-ringfenced spending by local authorities, which MHCLG’s local government finance framework supports.
-
Many MHCLG functions in England are devolved in Scotland, Wales and Northern Ireland, and so are funded by the devolved administrations’ block grants. Consequently, MHCLG enabled spend per person for Scotland, Wales and Northern Ireland is in addition to that already received via their block grants, and direct comparison with spend in England will not be meaningful.
-
To aid meaningful comparison of spend across place and spending segment, we have derived and published levels of spend per person. This is not reflective of, nor a statement on, how funding is or should be allocated. Funding streams seek to deliver different outcomes, which informs the distribution methodologies for each funding stream. These methodologies may not necessarily consider spend per person. Spend per person is unlikely to be an appropriate method for determining how best to fund local authorities because it does not take account of the needs of the local population.
-
City of London and Isles of Scilly have atypically small populations and owing to their unique statuses as local authorities are often excluded from local authority comparisons.
Value
V8 Be relevant
The primary purpose of these statistics is to provide users with information on place-based MHCLG spend at local authority district level in the UK. This greater transparency helps inform public debate and policy and increase accountability to the taxpayer.
By providing estimates of enabled spend from MHCLG and two of its ALBs at the local authority district level, these statistics provide transparency on MHCLG spend at a local authority level. In producing these statistics, all efforts are made to ensure the location of spend most accurately represents the geography where MHCLG enabled services are located.
We offer users the ability to provide feedback on the publication. We will use any feedback received to inform future improvements to this publication.
V9 Be clear
We aim to present our statistics, data and explanatory material in a clear, unambiguous way that supports and promotes use by all users. Where possible, we have tried to provide clear descriptions of the key findings from our data and used appropriate and simple visualisations to aid interpretation. We have also aimed to provide short examples of how the data should and shouldn’t be interpreted given its limitations.
V10 Be accessible
The statistics and data are publicly accessible, with data presented in both charts and tables with dynamic alternative text for screen readers to suit different users. Data tables are available to download. Outputs follow Government Analysis Function guidance on data colours for data visualisation and releasing statistics in spreadsheets. We are always trying to improve the accessibility of our products and welcome any feedback or suggestions.
7. Revisions policy
This policy has been developed in accordance with the UK Statistics Authority’s Code of Practice for Statistics and the Ministry of Housing, Communities and Local Government Revisions Policy.
It covers two types of revisions that the policy covers, as follow:
Non-scheduled revisions
Where a substantial error has occurred as a result of the compilation, imputation or dissemination process, the statistical release, live tables and other accompanying releases will be updated with a correction notice as soon as is practical.
Scheduled revisions
There are no scheduled revision points for these statistics at this stage beyond the changes that may result from the development and improvement of these official statistics in future publications.
8. Other information
User engagement
Users are encouraged to provide feedback on how these statistics are used and how well they meet user needs. Comments on any issues relating to this statistical release are welcomed and encouraged. Responses should be addressed to subnationalexpenditure@communities.gov.uk.
Read the department’s engagement strategy to meet the needs of statistics users.
Annex 1: Other data sources used
| Type of information | Lowest geographic unit | Coverage | Source and URL (where available) | |
|---|---|---|---|---|
| Geographic Boundaries | Built Up Area | England, Wales and Scotland | ONS | |
| Geographic Boundaries | Fire and Rescue Authority | England and Wales | ONS | |
| Geographic Boundaries | Freeport | England | MHCLG | |
| Geographic Boundaries | Local Enterprise Partnership | England | ONS | |
| Geographic Boundaries | Police Force Area | England and Wales | ONS | |
| Geographic Boundaries | National Park | England, Wales and Scotland | ONS | |
| Geographic Boundaries | Mayoral Combined Authority | England | ONS | |
| Geographic Boundaries | County | England | ONS | |
| Households with Dependent Children | Local Authority District | United Kingdom | ONS | |
| Indices of Multiple Deprivation | Local Authority District | England | MHCLG | |
| Council tax levels | Local Authority District | England | MHCLG | |
| Company trading locations | Local Authority District | United Kingdom | ONS- IDBR |
-
Of the ALBs associated with MHCLG in 2024-25: some are self-funded and do not appear in the data and some received grant-in-aid from MHCLG and appear as recipients of central spend. There are two ALBs, Homes England and Planning Inspectorate, which have place based policy spend that is categorised as direct MHCLG and ALB spend that can be apportioned to granular geographies. ↩