3. Tax gaps: Excise (including alcohol, tobacco and oils)
Updated 23 June 2026

© Crown copyright 2026
This publication is licensed under the terms of the Open Government Licence v3.0 except where otherwise stated. To view this licence, visit nationalarchives.gov.uk/doc/open-government-licence/version/3 or write to the Information Policy Team, The National Archives, Kew, London TW9 4DU, or email: psi@nationalarchives.gov.uk.
Where we have identified any third party copyright information you will need to obtain permission from the copyright holders concerned.
This publication is available at https://www.gov.uk/government/statistics/measuring-tax-gaps/3-tax-gaps-excise-including-alcohol-tobacco-and-oils
Summary
The excise duties gap estimate is the sum of 5 components:
-
the beer duty gap, based on an established top-down and an established bottom-up methodology, using survey data and HMRC management information
-
the spirits duty gap, based on an established top-down methodology which uses survey data to estimate the total market size and takes away the amount actually cleared (the amount of duty received by HMRC)
-
the tobacco duty gap, which includes cigarettes and hand-rolling tobacco duty gaps, both based on a top-down methodology which estimates the total market size for each tobacco product and then takes away the amount actually cleared
-
the hydrocarbon oils (fuel duty) gap, based on an established top-down methodology using fuel consumption data between tax years 2005 to 2006 and 2015 to 2016, and an established bottom-up methodology using random enquiry programme data for the use of illicit diesel from 2016 to 2017 onwards
-
other excise duties, including betting and gaming, cider and perry, spirits-based ready-to-drinks and wine, based on an illustrative method using a weighted average from similar taxes
To evaluate the uncertainty of the excise duties gap, we assign an uncertainty rating for each component, ranging from ‘very low’ to ‘very high’.
- the beer, spirits and other excise duties gaps have ‘very high’ uncertainty
- the estimates for cigarette and hand-rolling tobacco duty gaps have ‘high’ uncertainty
- the hydrocarbon oils duty gap has ‘medium’ uncertainty
More information on the underlying tax gap methodologies and uncertainty ratings can be found in the ‘Methodological annex’.
Main findings
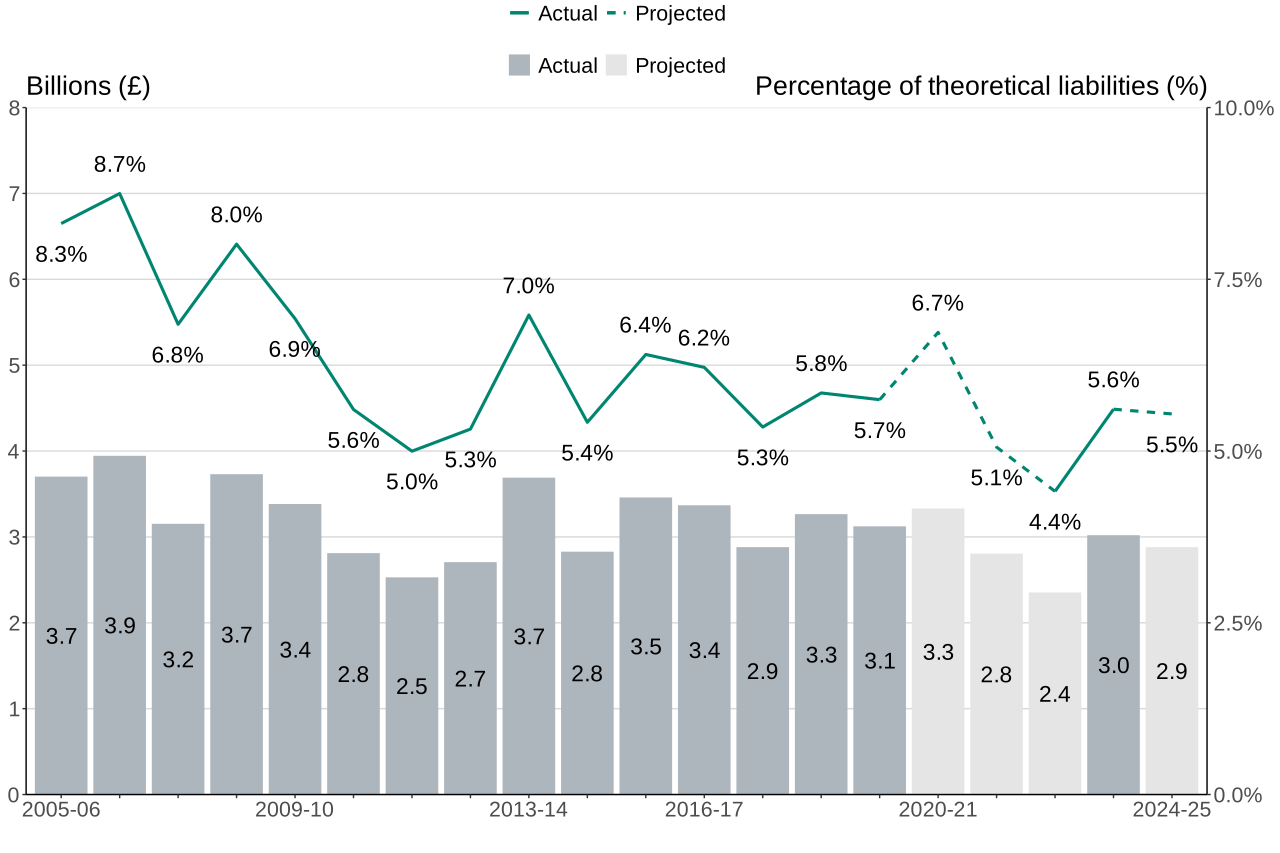
Figure 3.1 shows the excise duties gap time series in absolute terms and as a percentage of excise duties theoretical liabilities.
The excise duties gap is 5.5% of the overall excise duties theoretical duty liability, or £2.9 billion in absolute terms, in the 2024 to 2025 tax year.
There has been an overall downward trend in the excise duties gap from 8.3% in 2005 to 2006 to 5.5% in 2024 to 2025, though there is volatility between years reflecting the overall uncertainty and use of top-down methodologies in several of the individual excise duty gaps.
Figure 3.1: Excise duties gap by value and as a percentage of theoretical liabilities, 2005 to 2006 up to 2024 to 2025
Notes for Figure 3.1:
- The full data series can be seen in the online tables.
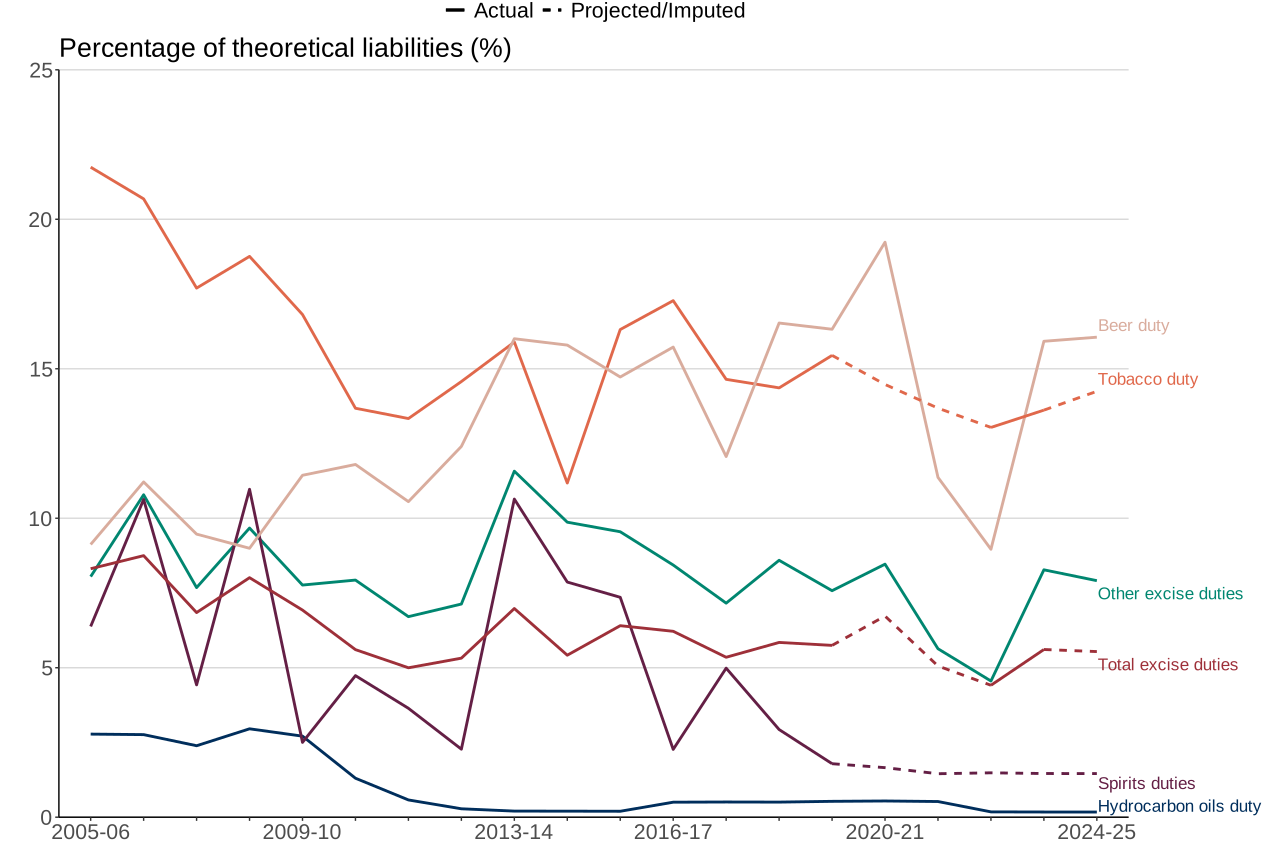
Figure 3.2 shows the time series for the excise duties gap components: beer, spirits, tobacco, hydrocarbon oils and other excise duties gaps. The trend in each duty gap is discussed in the relevant section below.
The overall excise duties gap is largely driven by the tobacco and beer duty gaps, which have been the biggest components throughout most of the time series. In 2024 to 2025, the tobacco duty gap is the largest in absolute terms, estimated at £1.3 billion or 14.2% of theoretical duty liability, while the beer duty gap is the largest in percentage terms, estimated at £0.7 billion or 16.1%.
The long-term trend in the excise duties gap reflects the sustained decline and volatility in the tobacco duty gap, alongside continued volatility in the beer duty gap.
The spirits and hydrocarbon oils duty gaps have a smaller impact on the overall level of the excise duties gap because they are lower in absolute value. However, they contribute to reducing the overall gap as a percentage of theoretical duty liability.
The other excise duties gap has a limited direct impact on the overall estimate. This is because it is calculated using an illustrative method that is derived from the tobacco, beer, spirits and hydrocarbon oils duty gaps.
Figure 3.2 Excise duties gap as a percentage of theoretical duty liabilities by component
Notes for Figure 3.2:
- The full data series can be seen in the online tables.
Figure 3.3 shows the proportion of the overall excise duties gap that comes from the beer, spirits, tobacco, hydrocarbon oils and other excise duty gaps since 2020 to 2021. Tobacco duty is the largest component in each year with a 46% share in 2024 to 2025, followed by other excise duties with a 27% share, beer duty with a 23% share, spirits duty with a 2% share and hydrocarbon oils duty with an 1% share.
Figure 3.3: Shares of excise duties gap by component
| Year | Tobacco duty | Other excise duties | Beer duty | Spirits duty | Hydrocarbon oils duty |
|---|---|---|---|---|---|
| 2020-21 | 51% | 22% | 22% | 2% | 3% |
| 2021-22 | 58% | 18% | 17% | 2% | 5% |
| 2022-23 | 64% | 16% | 15% | 3% | 2% |
| 2023-24 | 46% | 28% | 23% | 2% | 1% |
| 2024-25 | 46% | 27% | 23% | 2% | 1% |
Notes for Figure 3.3:
-
The full data series can be seen in the online tables.
-
Figures are rounded to the nearest 1%.
-
Figures may not sum due to rounding.
Beer
Main findings
The beer duty gap is estimated using both an established top-down and bottom-up methodology which generate upper and lower bound estimates. The implied central estimate is a simple average of these estimates and is intended to be an indicator of the long-term trend.
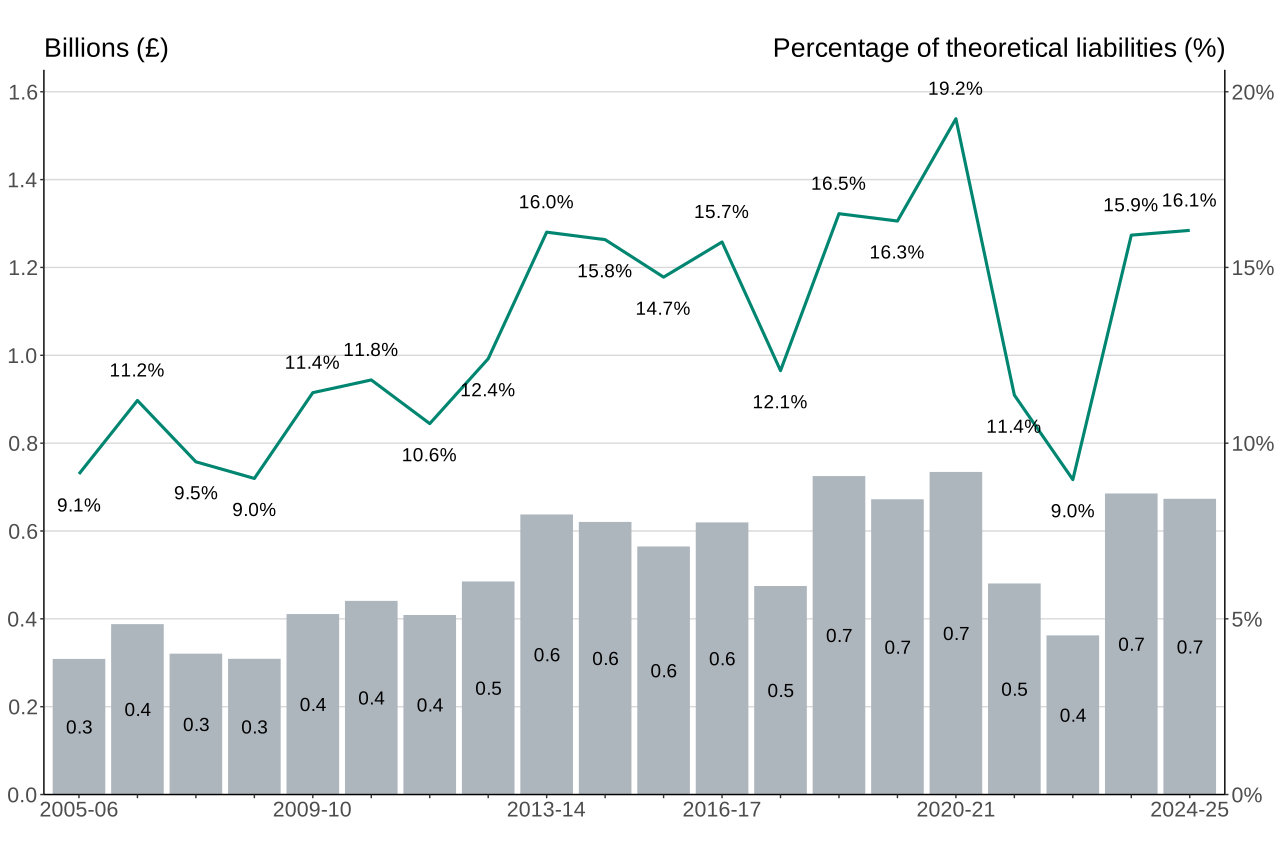
Figure 3.4 shows the beer duty gap time series in absolute terms and as a percentage of beer theoretical duty liabilities.
The beer duty gap is 16.1% of the theoretical beer duty liability, or £0.7 billion in absolute terms, in the 2024 to 2025 tax year.
The beer duty gap as a proportion of theoretical beer duty liability gradually increased from 9.1% in 2005 to 2006, reaching a high of 19.2% in 2020 to 2021, followed by a decline to 9.0% in 2022 to 2023 then increasing to 16.1% in 2024 to 2025.
Figure 3.4: Beer duty gap by value and as a percentage of theoretical duty liability, 2005 to 2006 up to 2024 to 2025
Notes for Figure 3.4:
- The full data series can be seen in the online tables.
Figure 3.5 shows the beer duty gap, liability, and the theoretical duty liability, which is the sum of the duty gap and liability, since 2020 to 2021.
The beer duty gap has varied between £0.4 billion and £0.7 billion in the last 5 years, whilst the beer duty liability varied between £3.1 billion and £3.7 billion over the last 5 years. The beer theoretical duty liability has marginally increased over the last 5 years from £3.8 billion in 2020 to 2021 to £4.2 billion in 2024 to 2025.
Figure 3.5: Beer duty gap, duty liability and theoretical duty liability, since 2020 to 2021 (£ billion)
| Year | Net duty gap | Duty liability | Theoretical duty liability |
|---|---|---|---|
| 2020-21 | 0.7 | 3.1 | 3.8 |
| 2021-22 | 0.5 | 3.7 | 4.2 |
| 2022-23 | 0.4 | 3.7 | 4.0 |
| 2023-24 | 0.7 | 3.6 | 4.3 |
| 2024-25 | 0.7 | 3.5 | 4.2 |
Notes for Figure 3.5:
-
The full data series can be seen in the online tables.
-
Figures are rounded to the nearest £0.1 billion.
-
Figures may not sum due to rounding.
-
Liability refers to the actual amount expected to be received by HMRC based on taxpayer declarations and HMRC’s compliance activity.
Additional to the beer duty gap is the beer VAT gap. The VAT gap arising from undeclared beer is captured within the overall VAT gap covered in chapter 2. Figure 3.6 shows the VAT gap arising from undeclared beer since 2020 to 2021.
The beer VAT gap has been broadly stable between £0.2 billion and £0.4 billion in the last 5 years.
Figure 3.6: VAT gap arising from undeclared beer since 2020 to 2021 (£ billion)
| Year | VAT gap |
|---|---|
| 2020-21 | 0.4 |
| 2021-22 | 0.3 |
| 2022-23 | 0.2 |
| 2023-24 | 0.3 |
| 2024-25 | 0.3 |
Notes for Figure 3.6:
-
The full data series can be seen in the online tables.
-
Figures are rounded to the nearest £0.1 billion.
-
Figures are included in the VAT gap estimate.
Revisions
There are very minor revisions due to updated data on on-license and off-license prices, which do not affect the published duty gap percentage. Beer price data is supplied by the Office for National Statistics and is used to convert the household expenditure figures to market size.
Spirits
Main findings
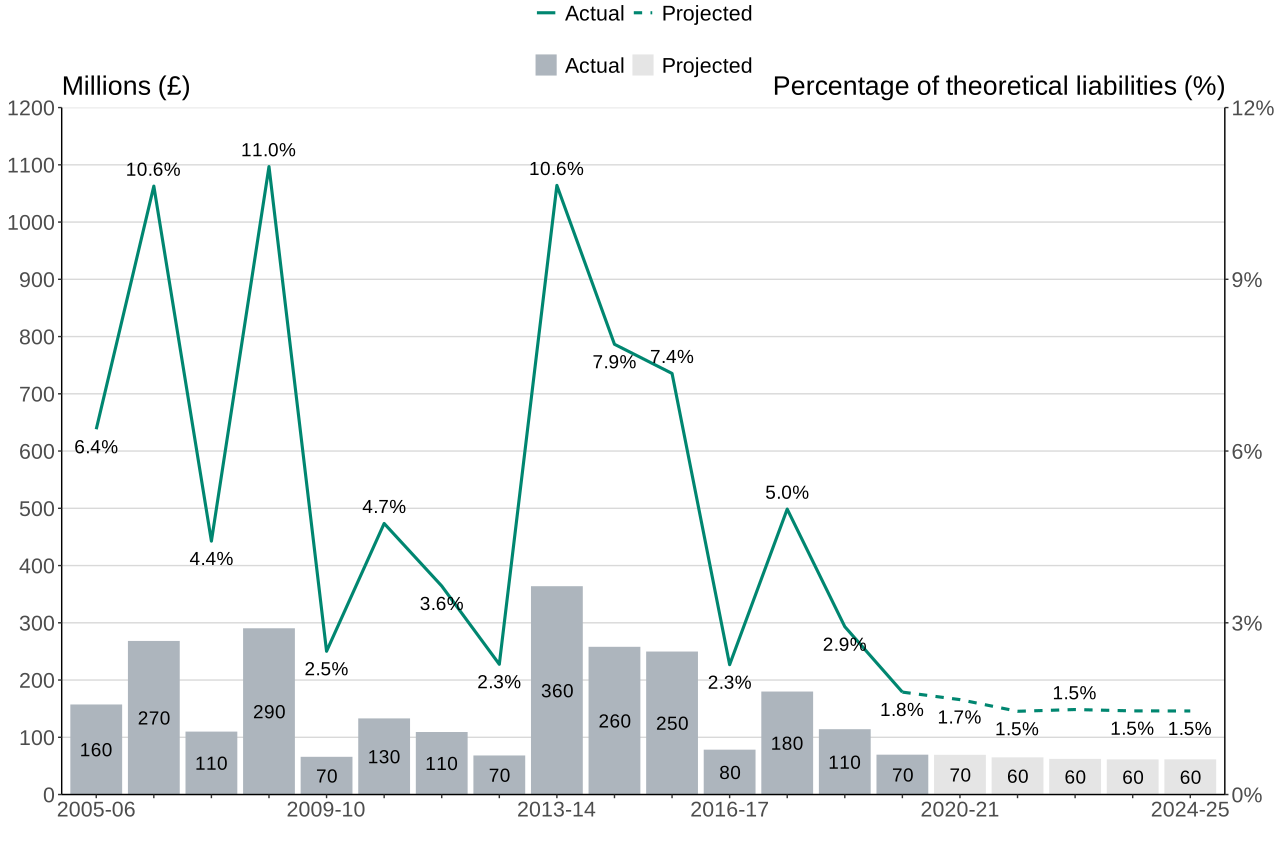
Figure 3.7 shows the spirits duty gap time series in absolute terms and as a percentage of spirits theoretical duty liability.
The spirits duty gap is 1.5% of the theoretical spirits duty liability, or £60 million in absolute terms, in the 2024 to 2025 tax year.
There is high year-on-year volatility in the estimated spirits duty gap, which is typical of top-down methodologies. The spirits duty gap estimate as a proportion of the spirits theoretical duty liabilities has decreased from 6.4% in 2005 to 2006 to 1.5% in 2024 to 2025.
The spirits duty gap estimate is projected from 2020 to 2021 based on assuming a constant illicit market percentage. This is due to a lack of reliable data on which to base the estimate in these years.
Figure 3.7 Spirits duty gap by value and as a percentage of theoretical duty liability, 2005 to 2006 up to 2024 to 2025
Notes for Figure 3.7:
- The full data series can be seen in the online tables.
Figure 3.8 shows the spirits duty gap, duty liability, and the theoretical duty liability, which is the sum of the duty gap and duty liability, since 2020 to 2021.
The spirits duty gap has decreased from £70 million to £60 million over the last 5 years. The spirits theoretical duty liabilities have remained broadly stable at £4.2 billion.
Figure 3.8: Spirits duty gap, duty liability and theoretical duty liability, since 2020 to 2021 (£ million)
| Year | Net duty gap | Duty liability | Theoretical duty liability |
|---|---|---|---|
| 2020-21 | 70 | 4,120 | 4,180 |
| 2021-22 | 60 | 4,400 | 4,470 |
| 2022-23 | 60 | 4,140 | 4,200 |
| 2023-24 | 60 | 4,140 | 4,200 |
| 2024-25 | 60 | 4,150 | 4,210 |
Notes for Figure 3.8:
-
The full data series can be seen in the online tables.
-
Figures are rounded to the nearest £10 million.
-
Figures may not sum due to rounding.
-
Liability refers to the actual amount expected to be received by HMRC based on taxpayer declarations and HMRC’s compliance activity.
Additional to the spirits duty gap is the spirits VAT gap. The VAT gap arising from undeclared spirits duty is captured within the overall VAT gap covered in chapter 2. Figure 3.9 shows the VAT gap arising from undeclared spirits since 2020 to 2021.
The spirits VAT gap has been broadly stable between £30 million and £40 million over the last 5 years.
Figure 3.9: VAT gap arising from undeclared spirits duty, since 2020 to 2021 (£ million)
| Year | VAT gap |
|---|---|
| 2020-21 | 30 |
| 2021-22 | 40 |
| 2022-23 | 40 |
| 2023-24 | 40 |
| 2024-25 | 40 |
Notes for Figure 3.9:
-
The full data series can be seen in the online tables.
-
Figures are rounded to the nearest £10 million.
-
Figures are included in the VAT gap estimate.
Revisions
There are very minor revisions to recent years due to updated data on spirits on-license and off-license prices, which do not affect the published duty gap percentage. Spirits price data is supplied by the Office for National Statistics and is used to convert the household expenditure figures to spirits market size figures.
Tobacco
Main findings
The tobacco duty gap is calculated by summing the duty gaps for cigarettes and hand-rolling tobacco.
Both the cigarettes and hand-rolling tobacco duty gaps are each estimated using an established top-down methodology to estimate upper and lower duty gaps estimates, which are then averaged to obtain a central estimate for each.
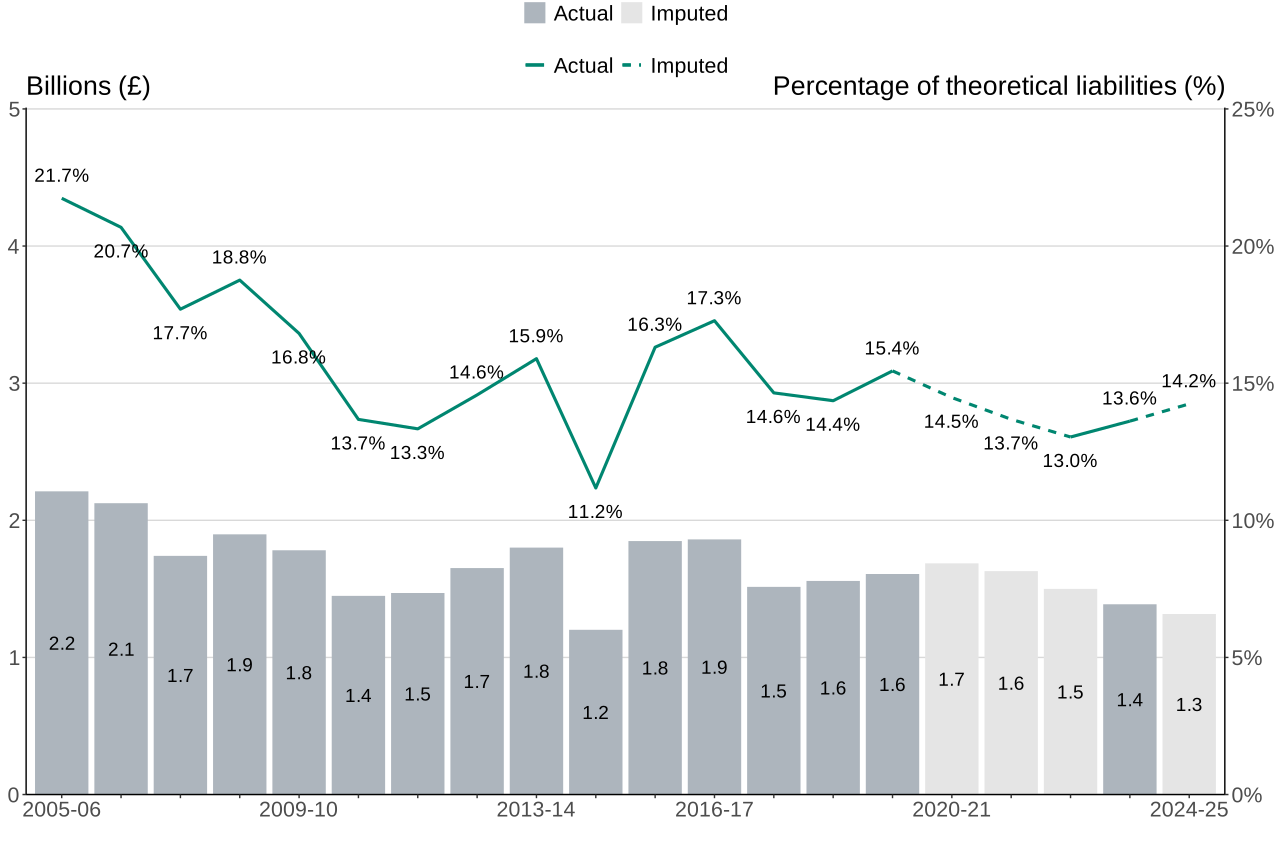
Figure 3.10 shows the tobacco duty gap time series in absolute terms and as a percentage of theoretical tobacco duty liability.
The duty gap for tobacco duty is 14.2% of the theoretical tobacco duty liability, or £1.3 billion in absolute terms, in the tax year 2024 to 2025.
There has been a reduction in the tobacco duty gap estimate as a proportion of theoretical tobacco duty liabilities, from 21.7% in 2005 to 2006 to 14.2% in 2024 to 2025.
Between 2005 to 2006 and 2014 to 2015, the tobacco duty gap declined, reaching a low of 11.2% in 2014 to 2015. Since 2017 to 2018 the tobacco duty gap series has broadly remained stable, in part driven by imputation of the trend between 2020 to 2021 and 2022 to 2023. This is due to a pause in data collection by the Office for National Statistics on tobacco consumption during these years. The tobacco gap is also projected for 2024 to 2025 based on the total consumption trends between 2022 to 2023 and 2023 to 2024 due to data availability and small sample sizes.
Both the cigarette and hand-rolling tobacco duty gap estimates from 2020 to 2021 up to 2022 to 2023 are imputed based on the 2019 to 2020 and 2023 to 2024 estimates of the illicit market share. This is due to the removal of tobacco consumption questions from the Office for National Statistics’ Opinions and Lifestyle Survey from 2020 to 2021 to 2022 to 2023. The 2024 to 2025 estimate is projected based on the total consumption trends between 2022 to 2023 and 2023 to 2024. More information on the survey can be found in the Opinions and Lifestyle Survey QMI webpages.
Figure 3.10: Tobacco duty gap by value and as a percentage of theoretical duty liability, 2005 to 2006 up to 2024 to 2025
Notes for Figure 3.10:
- The full data series can be seen in the online tables.
Figure 3.11 shows the tobacco duty gap, duty liability, and the theoretical tobacco duty liability, which is the sum of the duty gap and duty liability, since 2020 to 2021.
The tobacco duty gap has decreased from £1.7 billion to £1.3 billion in the last 5 years. The tobacco duty liability remained broadly stable between 2020 to 2021 and 2022 to 2023, followed by decrease to £7.9 billion in 2024 to 2025. The theoretical tobacco duty liability remained broadly stable between 2020 to 2021 and 2022 to 2023, followed by a decrease to £9.2 billion in 2024 to 2025.
Figure 3.11: Tobacco duty gap, duty liability and theoretical duty liability (£ billion), since 2020 to 2021
| Year | Net duty gap | Duty liability | Theoretical duty liability |
|---|---|---|---|
| 2020-21 | 1.7 | 10.0 | 11.7 |
| 2021-22 | 1.6 | 10.3 | 11.9 |
| 2022-23 | 1.5 | 10.0 | 11.5 |
| 2023-24 | 1.4 | 8.8 | 10.2 |
| 2024-25 | 1.3 | 7.9 | 9.2 |
Notes for Figure 3.11:
-
The full data series can be seen in the online tables.
-
Figures are rounded to the nearest £0.1 billion.
-
Figures may not sum due to rounding.
-
Liability refers to the actual amount expected to be received by HMRC based on taxpayer declarations and HMRC’s compliance activity.
Additional to the tobacco duty gap is the tobacco VAT gap. The VAT gap arising from undeclared tobacco duty is captured within the overall VAT gap covered in chapter 2. Figure 3.12 shows the VAT gap arising from undeclared tobacco since 2020 to 2021.
The tobacco VAT gap has been broadly stable between £0.4 billion and £0.5 billion in the last 5 years.
Figure 3.12: VAT gap arising from undeclared tobacco (£ billion), since 2020 to 2021
| Year | VAT gap |
|---|---|
| 2020-21 | 0.5 |
| 2021-22 | 0.5 |
| 2022-23 | 0.4 |
| 2023-24 | 0.4 |
| 2024-25 | 0.4 |
Notes for Figure 3.12:
-
The full data series can be seen in the online tables.
-
Figures are rounded to the nearest £0.1 billion.
-
Figures are included in the VAT gap estimate.
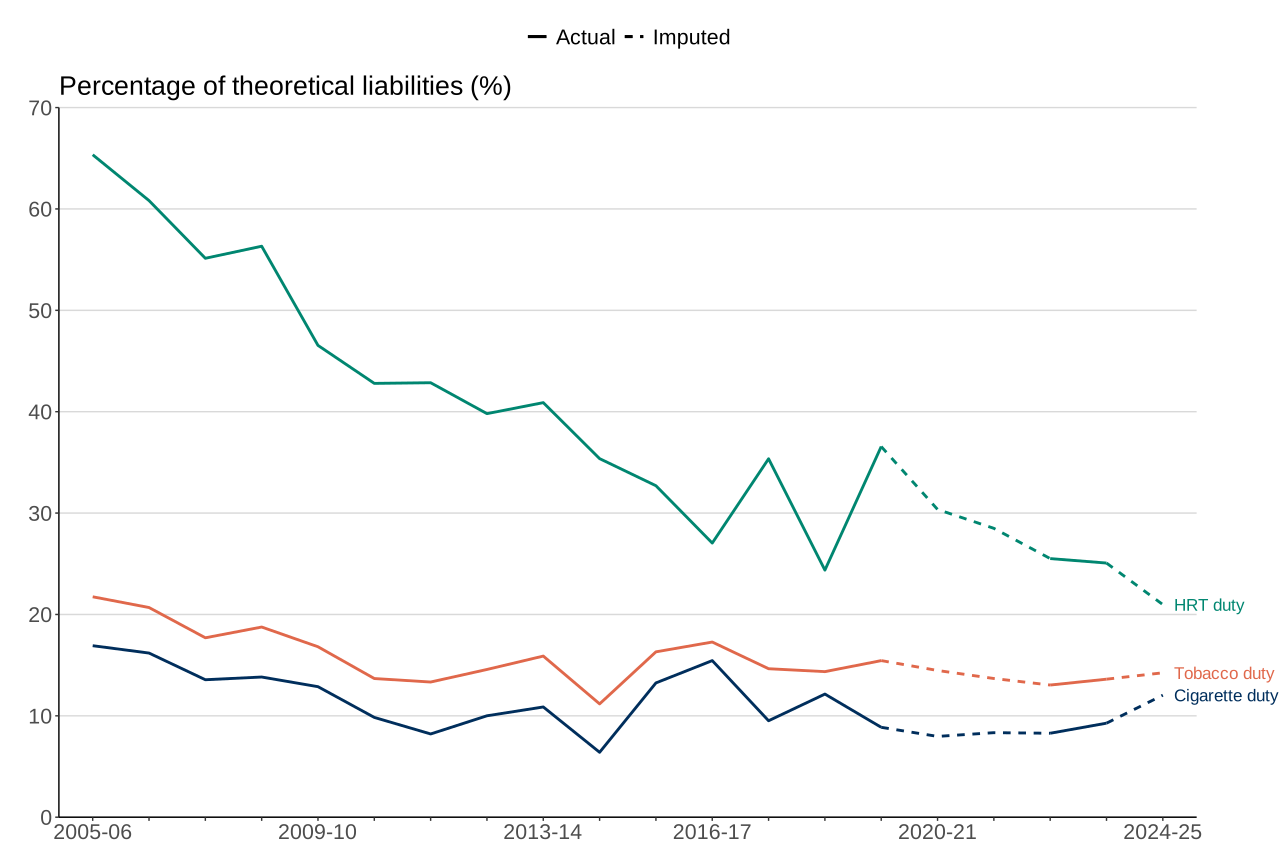
Figure 3.13 shows the time series for the tobacco duty gap and its 2 components as a percentage of theoretical duty liability.
The trend in the tobacco duty gap is largely driven by the trend in the cigarette duty gap, which makes up most of the tobacco consumption and duty receipts. Between 2005 to 2006 and 2014 to 2015, the cigarettes duty gap declined from 16.9% to 6.4%, before increasing to 15.4% in 2016 to 2017 and then fluctuating. The hand-rolling tobacco duty gap has decreased from 65.3% in 2005 to 2006 to 21.0% in 2024 to 2025 and is higher than the cigarettes duty gap across the time series.
Figure 3.13: Tobacco duty gap as a percentage of theoretical duty liability by component, 2005 to 2006 up to 2024 to 2025
Notes for Figure 3.13:
-
The full data series can be seen in the online tables.
-
HRT stands for ‘Hand-rolling tobacco’.
Revisions
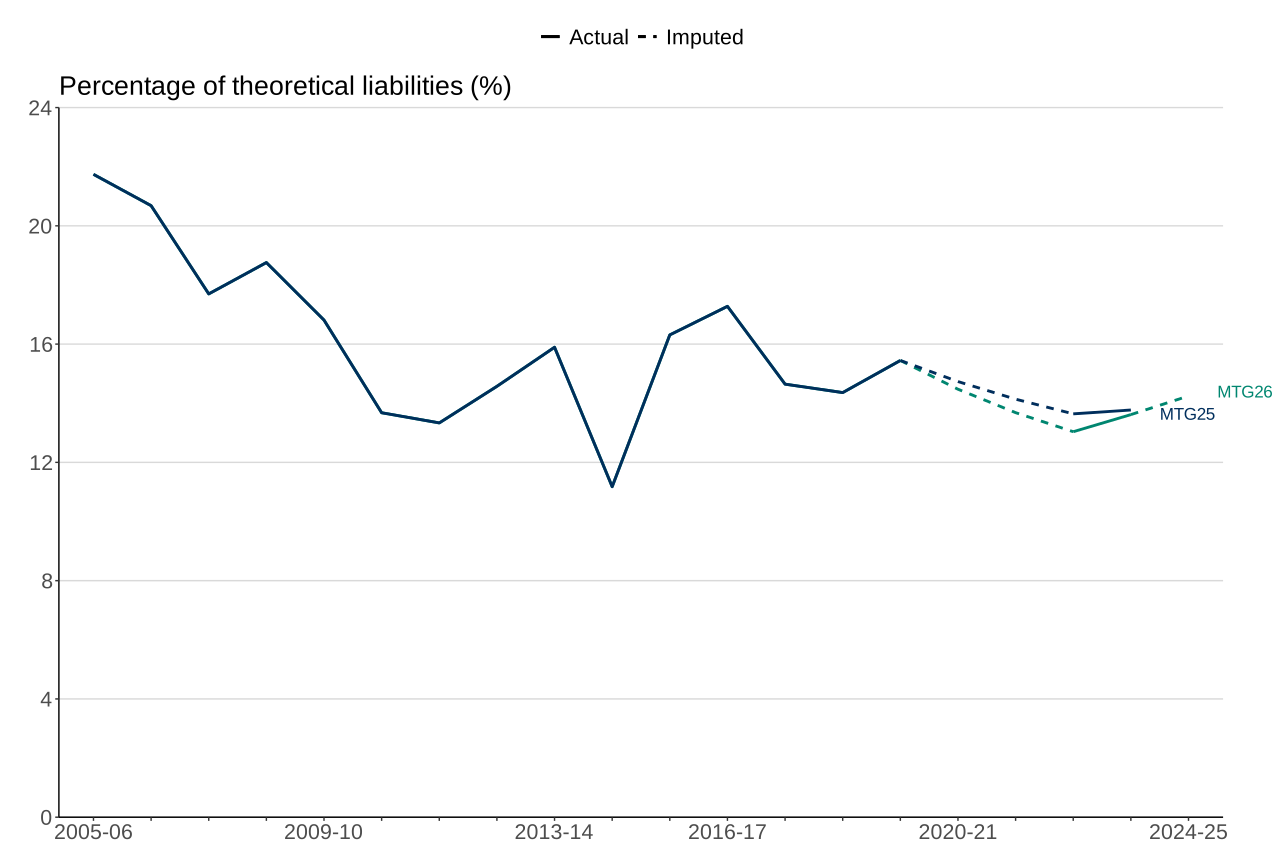
Figure 3.14 shows the revisions to the tobacco duty gap since the publication of the ‘Measuring tax gaps 2025 edition’.
There are minor revisions to the tobacco duty gap since the publication of the ‘Measuring tax gaps 2025 edition’, mainly driven by updates to clearance volumes, prices and duty rates, affecting the estimates from 2019 to 2020 onwards. The latest available data can be found in the Tobacco Bulletin.
Figure 3.14: Revisions to tobacco duty gap since the ‘Measuring tax gaps 2025 edition’
Notes for Figure 3.14:
-
The full data series can be seen in the online tables.
-
MTG stands for ‘Measuring tax gaps’.
Cigarettes
Main findings
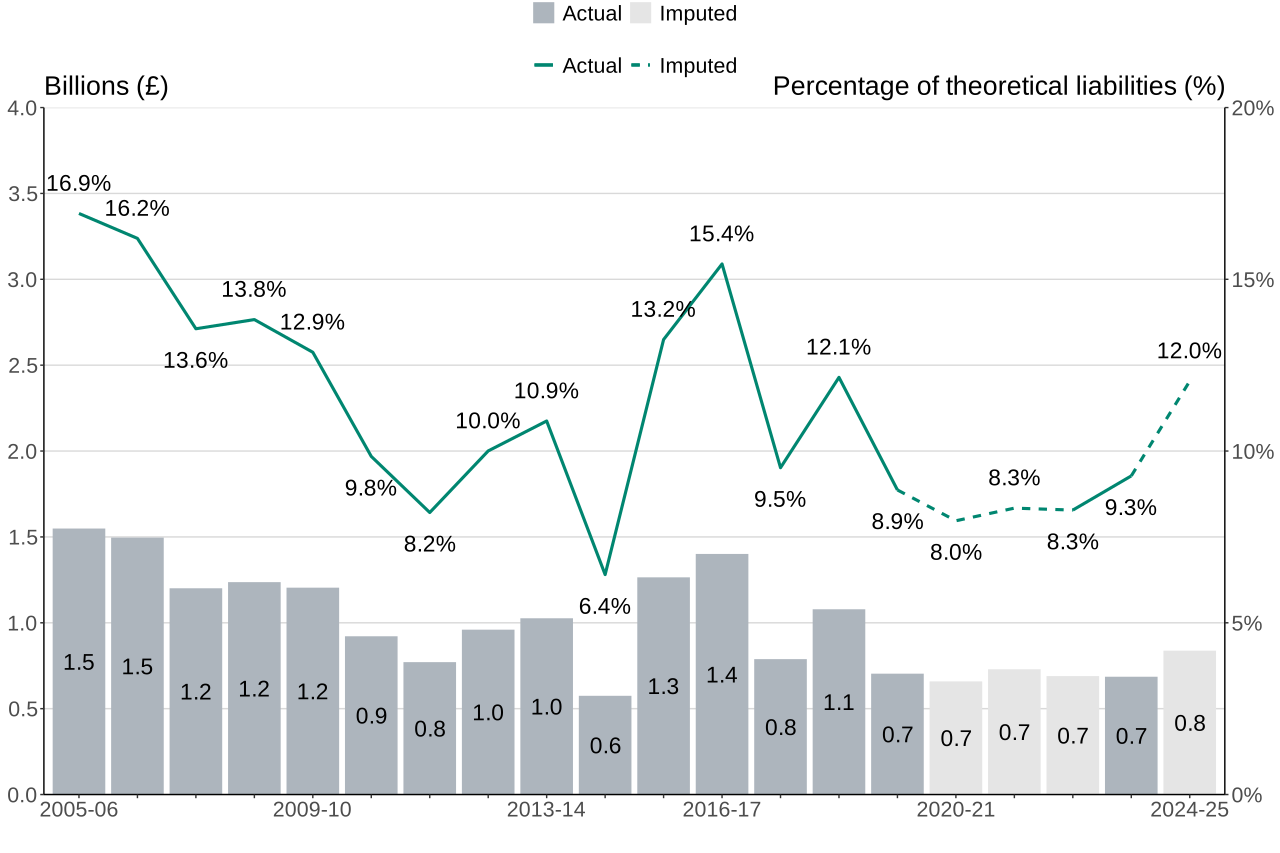
Figure 3.15 shows the cigarettes duty gap time series in absolute terms and as a percentage of theoretical cigarettes duty liability.
The cigarettes duty gap is 12.0% of the theoretical cigarettes duty liability, or £0.8 billion in absolute terms, in tax year 2024 to 2025.
There has been an overall reduction in the cigarettes duty gap estimate as a proportion of theoretical cigarettes duty liability, from 16.9% in 2005 to 2006 to 12.0% in 2024 to 2025.
Figure 3.15: Cigarettes duty gap by value and as a percentage of theoretical duty liability, 2005 to 2006 up to 2024 to 2025
Notes for Figure 3.15:
- The full data series can be seen in the online tables.
Figure 3.16 shows the cigarettes duty gap, duty liability, and the theoretical duty liability, which is the sum of the duty gap and duty liability, since 2020 to 2021.
The cigarettes duty gap has been broadly stable between £0.7 billion and £0.8 billion in the last 5 years. The cigarettes duty liability was broadly stable between 2020 to 2021 and 2022 to 2023, followed by a decrease to £6.1 billion in 2024 to 2025. The cigarettes theoretical duty liability was also broadly stable between 2020 to 2021 and 2022 to 2023, followed by a decrease to £7.0billion in 2024 to 2025.
Figure 3.16: Cigarettes duty gap, duty liability and theoretical duty liability (£ billion), since 2020 to 2021
| Year | Net duty gap | Duty liability | Theoretical duty liability |
|---|---|---|---|
| 2020-21 | 0.7 | 7.6 | 8.3 |
| 2021-22 | 0.7 | 8.0 | 8.7 |
| 2022-23 | 0.7 | 7.6 | 8.3 |
| 2023-24 | 0.7 | 6.7 | 7.4 |
| 2024-25 | 0.8 | 6.1 | 7.0 |
Notes for Figure 3.16:
-
The full data series can be seen in the online tables.
-
Figures are rounded to the nearest £0.1 billion.
-
Figures may not sum due to rounding.
-
Liability refers to the actual amount expected to be received by HMRC based on taxpayer declarations and HMRC’s compliance activity.
Additional to the cigarettes duty gap is the cigarettes VAT gap. The VAT gap arising from undeclared cigarettes duty is captured within the overall VAT gap covered in chapter 2. Figure 3.17 shows the VAT gap arising from undeclared cigarettes since 2020 to 2021.
The cigarettes VAT gap remained constant at £0.2 billion.
Figure 3.17: VAT gap arising from undeclared cigarettes (£ billion), since 2020 to 2021
| Year | VAT gap |
|---|---|
| 2020-21 | 0.2 |
| 2021-22 | 0.2 |
| 2022-23 | 0.2 |
| 2023-24 | 0.2 |
| 2024-25 | 0.2 |
Notes for Figure 3.17:
-
The full data series can be seen in the online tables.
-
Figures are rounded to the nearest £0.1 billion.
-
Figures are included in the VAT gap estimate.
Revisions
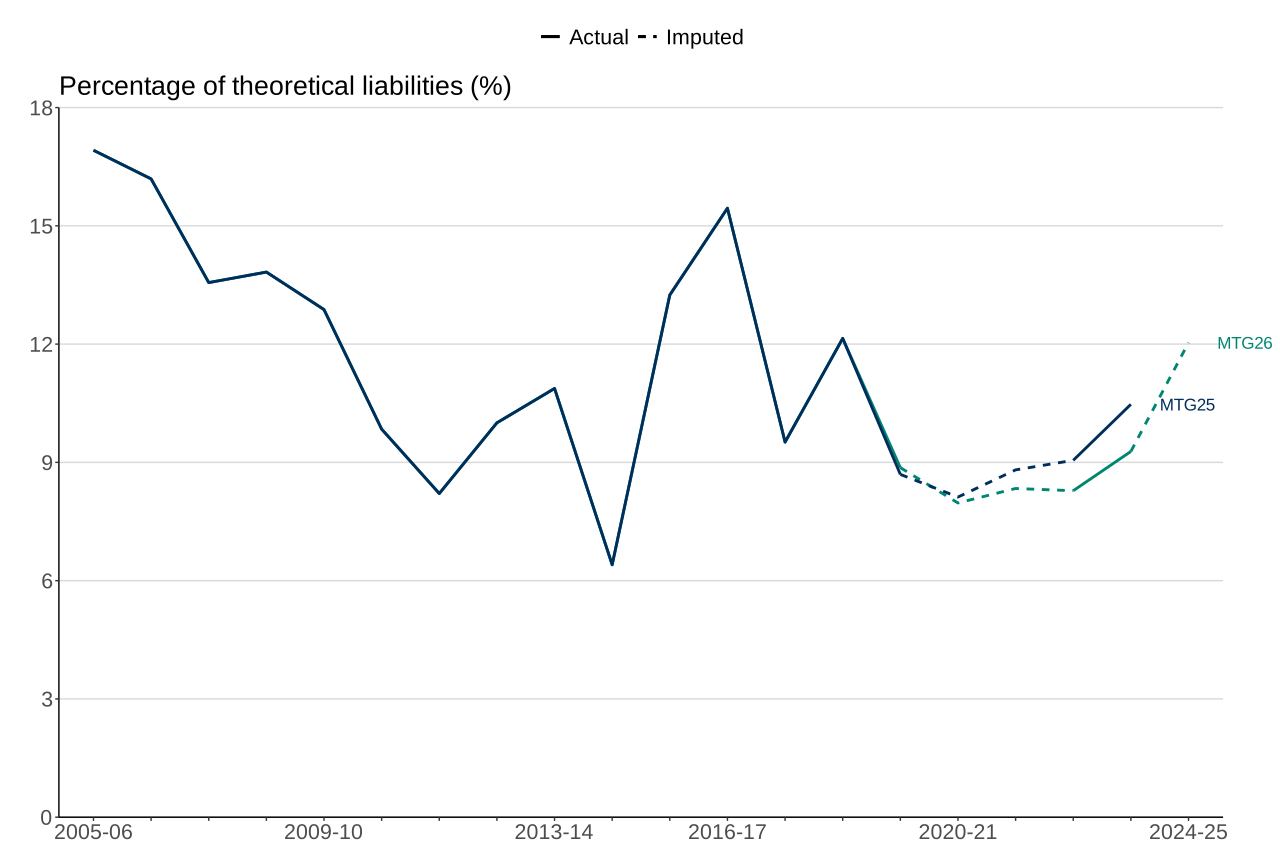
Figure 3.18 shows the revisions to the cigarette duty gap since the publication of the ‘Measuring tax gaps 2025 edition’.
As noted above, there are minor revisions to the cigarette duty gap since the publication of the ‘Measuring tax gaps 2025 edition’, mainly driven by updates to clearance volumes, prices and duty rates.
Figure 3.18: Revisions to cigarettes duty gap since the ‘Measuring tax gaps 2025 edition’
Notes for Figure 3.18:
-
The full data series can be seen in the online tables.
-
MTG stands for ‘Measuring tax gaps’.
Hand-rolling tobacco (HRT)
Main findings
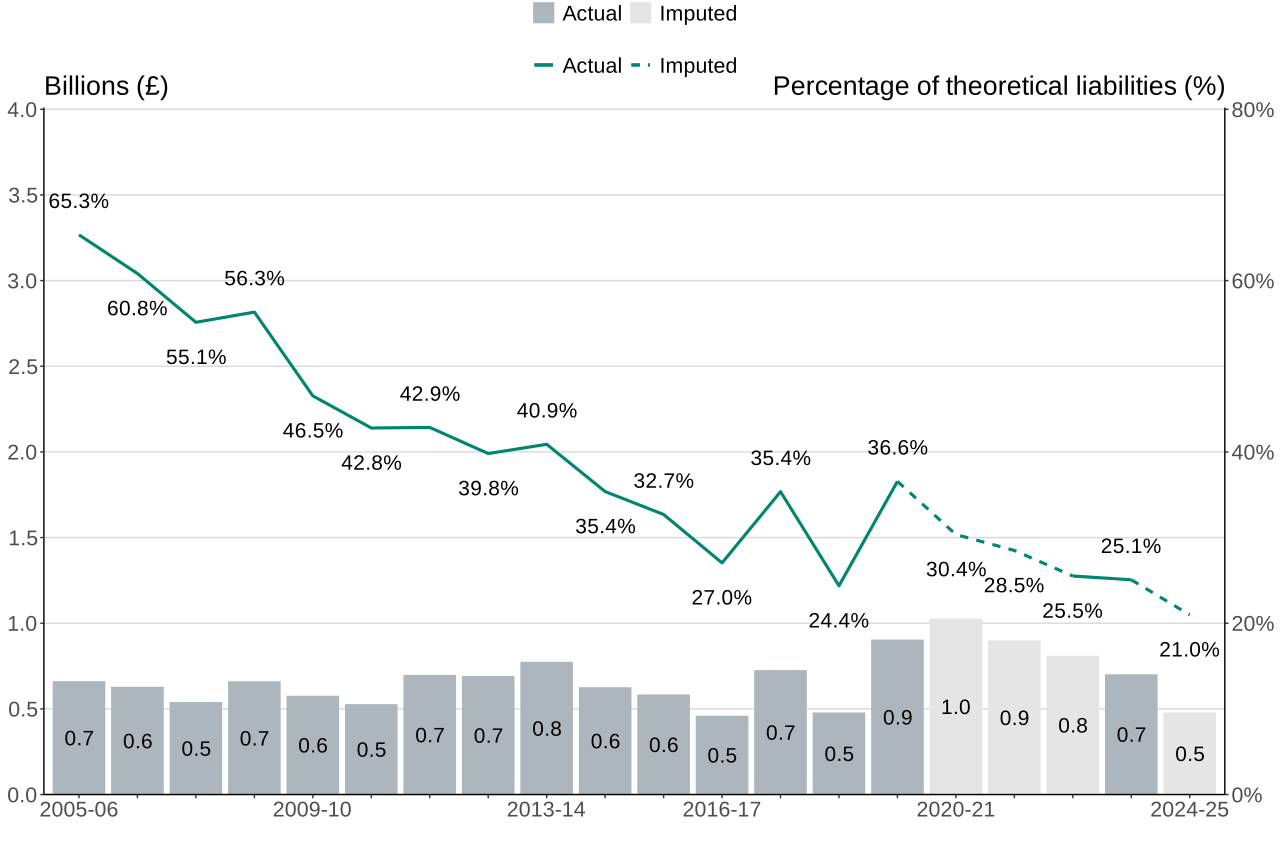
Figure 3.19 shows the hand-rolling tobacco duty gap time series in absolute terms and as a percentage of theoretical hand-rolling tobacco duty liability.
The hand-rolling tobacco duty gap is 21.0% of the theoretical hand-rolling tobacco duty liability, or £0.5 billion in absolute terms, in the 2024 to 2025 tax year.
There has been a reduction in the hand-rolling tobacco duty gap as a proportion of theoretical tobacco duty liability, from 65.3% in 2005 to 2006 to a low of 21.0% in 2024 to 2025.
Figure 3.19: Hand-rolling tobacco duty gap by value and as a percentage of theoretical duty liability, 2005 to 2006 up to 2024 to 2025
Notes for Figure 3.19:
- The full data series can be seen in the online tables.
Figure 3.20 shows the hand-rolling tobacco duty gap, duty liability and theoretical duty liability since 2020 to 2021.
The hand-rolling tobacco duty gap has reduced from £1.0 billion in 2020 to 2021 to £0.5 billion in 2024 to 2025. The hand-rolling tobacco duty liability has reduced from £2.4 billion to £1.8 billion. The theoretical hand-rolling tobacco duty liability decreased from £3.4 billion in 2020 to 2021 to £2.3 billion in 2024 to 2025.
Figure 3.20: Hand-rolling tobacco duty gap, duty liability and theoretical duty liability (£ billion), since 2020 to 2021
| Year | Net duty gap | Duty liability | Theoretical duty liability |
|---|---|---|---|
| 2020-21 | 1.0 | 2.4 | 3.4 |
| 2021-22 | 0.9 | 2.3 | 3.2 |
| 2022-23 | 0.8 | 2.4 | 3.2 |
| 2023-24 | 0.7 | 2.1 | 2.8 |
| 2024-25 | 0.5 | 1.8 | 2.3 |
Notes for Figure 3.20:
-
The full data series can be seen in the online tables.
-
Figures are rounded to the nearest £0.1 billion.
-
Figures may not sum due to rounding.
-
Liability refers to the actual amount expected to be received by HMRC based on taxpayer declarations and HMRC’s compliance activity.
Additional to the hand-rolling tobacco duty gap is the hand-rolling tobacco VAT gap. The VAT gap arising from hand-rolling tobacco is captured within the overall VAT gap covered in chapter 2. Figure 3.21 shows the VAT gap arising from undeclared hand-rolling tobacco since 2020 to 2021.
The hand-rolling tobacco VAT gap has decreased from £0.3 billion to £0.1 billion over the last 5 years.
Figure 3.21: VAT gap arising from undeclared hand-rolling tobacco (£ billion), since 2020 to 2021
| Year | VAT gap |
|---|---|
| 2020-21 | 0.3 |
| 2021-22 | 0.3 |
| 2022-23 | 0.3 |
| 2023-24 | 0.2 |
| 2024-25 | 0.1 |
Notes for Figure 3.21:
-
The full data series can be seen in the online tables.
-
Figures are rounded to the nearest £0.1 billion.
-
Figures are included in the VAT gap estimate.
Revisions
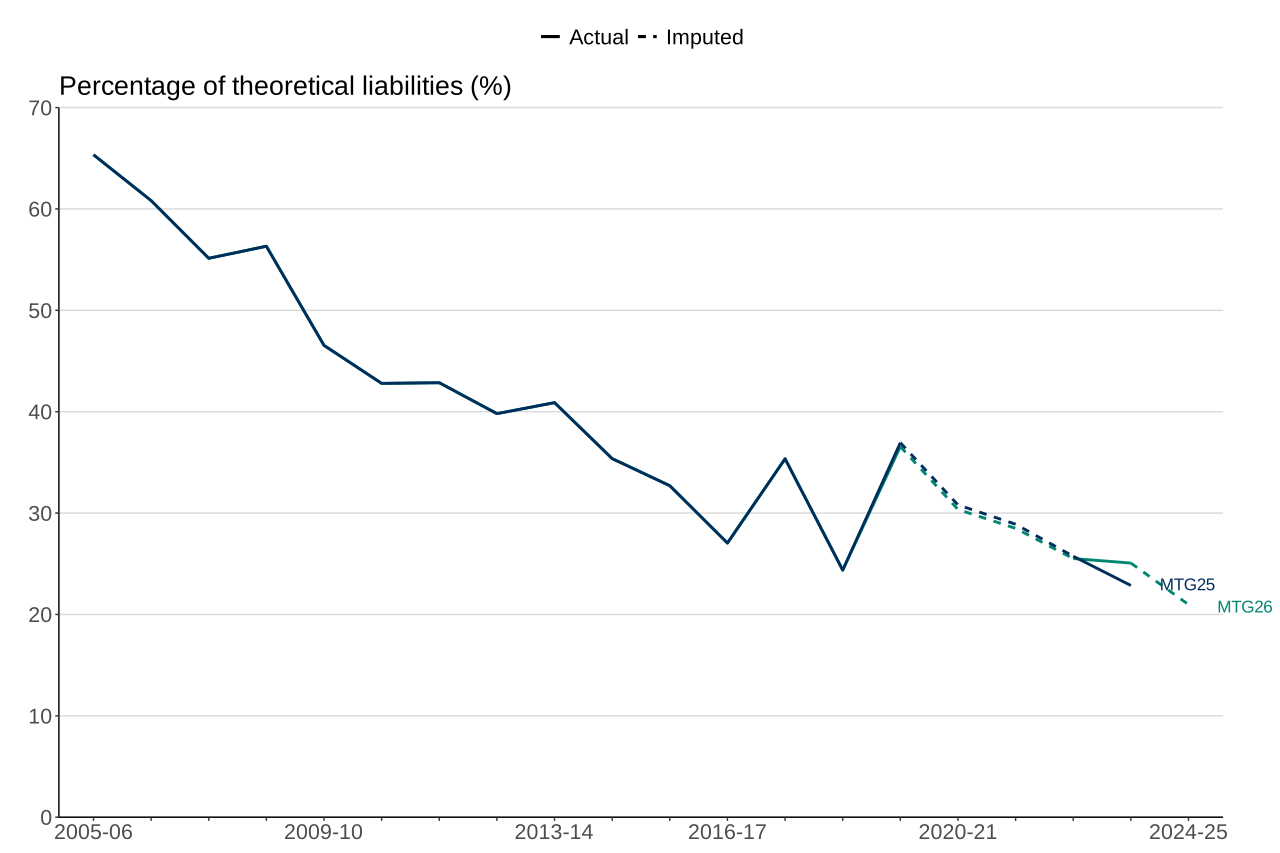
Figure 3.22 shows the revisions to the hand-rolling tobacco duty gap since the publication of the ‘Measuring tax gaps 2025 edition’.
As noted above, there are minor revisions to the hand-rolling tobacco duty gap since the publication of the ‘Measuring tax gaps 2025 edition’, mainly driven by updates to clearance volumes, prices and duty rates.
Figure 3.22: Revisions to hand-rolling tobacco duty gap since the ‘Measuring tax gaps 2025 edition’
Notes for Figure 3.22:
-
The full data series can be seen in the online tables.
-
MTG stands for ‘Measuring tax gaps’.
Hydrocarbon oils (fuel duty)
Main findings
The hydrocarbon oils duty gap is estimated using an established top-down methodology based on fuel consumption data between tax years 2005 to 2006 and 2015 to 2016, and an established bottom-up methodology based on random enquiry programme data for the use of illicit diesel from 2016 to 2017 onwards. More detail is provided in the ‘Methodological annex’. Therefore, figures from 2016 to 2017 onwards are not directly comparable to previous years.
The misuse of other fuels (for example, petrol) has been excluded on the basis that this is believed to be negligible, the scale of which is not currently quantifiable.
Other fuel duties do however form a part of theoretical hydrocarbon oils duty liability.
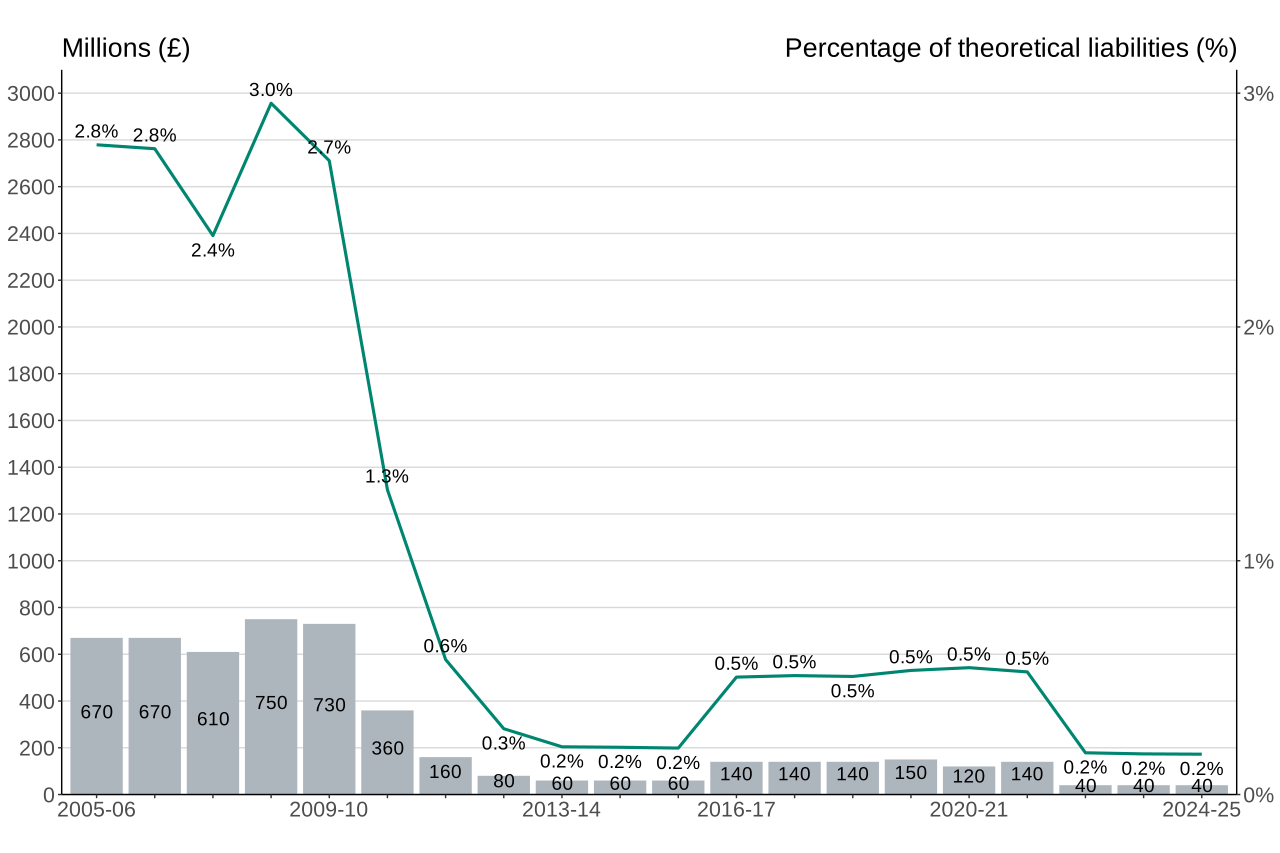
Figure 3.23 shows the hydrocarbon oils duty gap time series in absolute terms and as a percentage of theoretical hydrocarbon oils duty liability.
The net hydrocarbon oils duty gap is 0.2% of the theoretical hydrocarbon oils duty liability, or £40 million in absolute terms, in the 2024 to 2025 tax year.
There has been a reduction in the net hydrocarbon oils duty gap from 2.8% in 2005 to 2006 to 0.2% in 2024 to 2025. There was a large decline from 2.7% in 2009 to 2010 to 0.6% in 2011 to 2012. There was a small increase in the net hydrocarbon oils duty gap in 2016 to 2017 due to a step change from the top-down to bottom-up methodology. It has remained broadly stable, between 0.2% and 0.5%, since 2012 to 2013.
Figure 3.23: Hydrocarbon oils duty gap (£ million) by value and as a percentage of theoretical duty liability, 2005 to 2006 up to 2024 to 2025
Notes for Figure 3.23:
- The full data series can be seen in the online tables.
Figure 3.24 shows the hydrocarbon oils duty gap, duty liability, and the theoretical duty liability, which is the sum of the duty gap and duty liability, since 2020 to 2021.
The gross hydrocarbon oils duty gap decreased from £120 million in 2020 to 2021 to £40 million in 2024 to 2025. Restoration fees form the compliance yield that is subtracted from the gross duty gap to derive the net duty gap. Restoration fees cover the revenue collected from penalties for misusing rebated fuel plus an amount of duty calculated from the size of the vehicle fuel tank. Restoration fees have remained below £10 million between 2020 to 2021 to 2024 to 2025. The net gap has decreased from £120 million in 2020 to 2021 to £40 million in 2024 to 2025, whilst hydrocarbon oils duty liability has increased from around £21.2 billion in 2020 to 2021 to £26.0 billion in 2021 to 2022, followed by a reduction to £24.4 billion in 2024 to 2025. The theoretical hydrocarbon oils duty liability increased from around £21.3 billion in 2020 to 2021 to £26.1 billion in 2021 to 2022, followed by a reduction to £24.4 billion in 2024 to 2025.
Figure 3.24: Hydrocarbon oils duty gap, compliance yield, duty liability and theoretical duty liability (£ million), since 2020 to 2021
| Year | Gross gap | Compliance yield | Net duty gap | Duty liability | Theoretical duty liability |
|---|---|---|---|---|---|
| 2020-21 | 120 | <10 | 120 | 21,170 | 21,290 |
| 2021-22 | 140 | <10 | 140 | 25,970 | 26,110 |
| 2022-23 | 50 | <10 | 40 | 25,100 | 25,150 |
| 2023-24 | 40 | <10 | 40 | 24,920 | 24,970 |
| 2024-25 | 40 | <10 | 40 | 24,360 | 24,400 |
Notes for Figure 3.24:
-
The full data series can be seen in the online tables.
-
Figures are rounded to the nearest £10 million.
-
Figures may not sum due to rounding.
-
Liability refers to the actual amount expected to be received by HMRC based on taxpayer declarations and HMRC’s compliance activity.
Additional to the hydrocarbon oils duty gap is the hydrocarbon oils VAT gap. The VAT gap arising from undeclared hydrocarbon oils duty is captured within the overall VAT gap covered in chapter 2.
Figure 3.25 shows the VAT gap arising from undeclared hydrocarbon oils since 2020 to 2021.
The VAT gap arising from undeclared hydrocarbon oils has decreased from £30 million in 2020 to 2021 to £10 million in 2024 to 2025.
Figure 3.25: VAT gap arising from undeclared hydrocarbon oils (£ million), since 2020 to 2021
| Year | VAT gap |
|---|---|
| 2020-21 | 30 |
| 2021-22 | 40 |
| 2022-23 | 10 |
| 2023-24 | 10 |
| 2024-25 | 10 |
Notes for Figure 3.25:
-
The full data series can be seen in the online tables.
-
Figures are rounded to the nearest £10 million.
-
Figures are included in the VAT gap estimate.
Diesel
Main findings
The diesel duty gap is estimated using an established top-down methodology based on fuel consumption data between tax years 2005 to 2006 and 2015 to 2016, and an established bottom-up methodology based on random enquiry programme data for the use of illicit diesel from 2016 to 2017 onwards. More detail is provided in the ‘Methodological annex’. Therefore, figures from 2016 to 2017 onwards are not directly comparable to previous years.
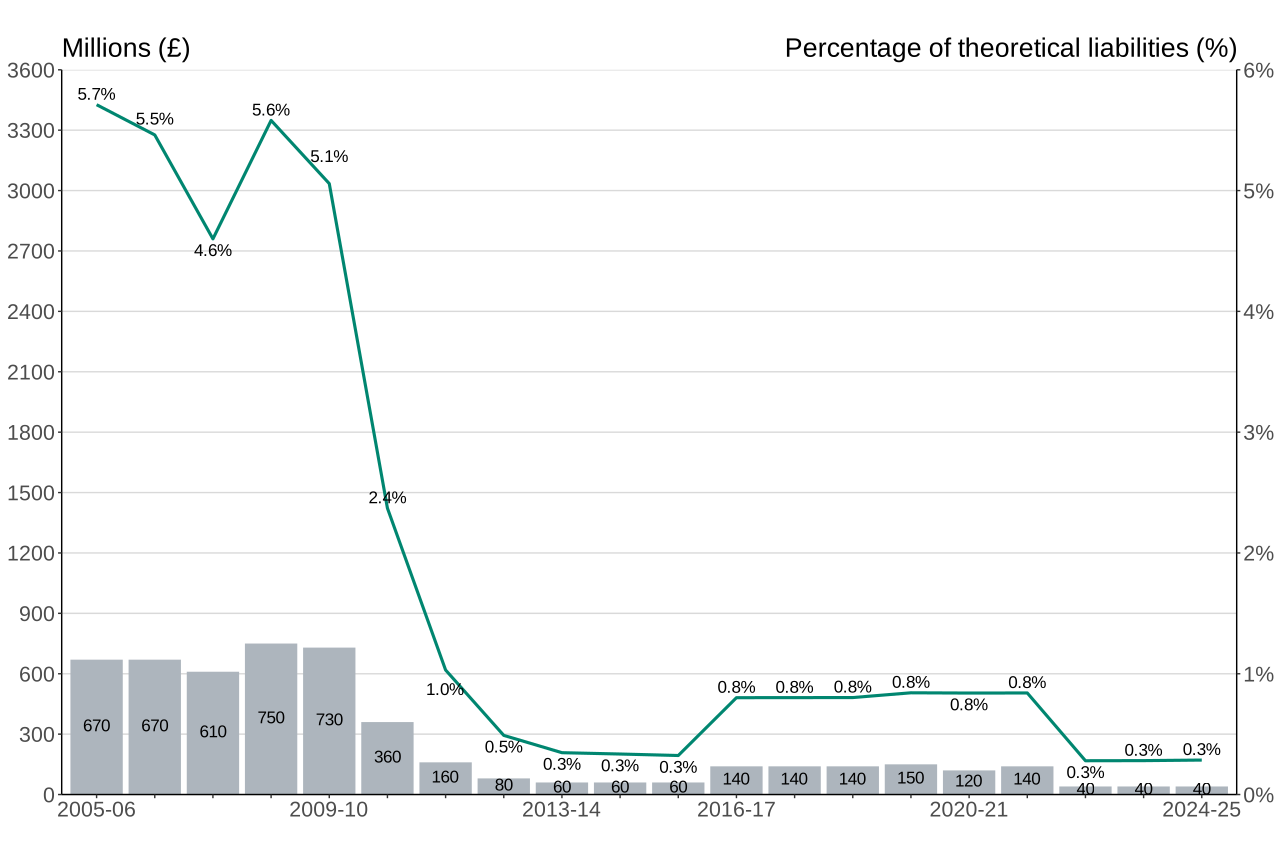
Figure 3.26 shows the diesel duty gap time series in absolute terms and as a percentage of theoretical diesel liabilities.
The net diesel duty gap is 0.3% of the theoretical diesel duty liability, or £40 million in absolute terms, in the 2024 to 2025 tax year.
There has been a reduction in the net diesel duty gap from 5.7% in 2005 to 2006 to 0.3% in 2024 to 2025. There was a large decline from 5.1% in 2009 to 2010 to 1.0% in 2011 to 2012. There was a small increase in the net diesel duty gap in 2016 to 2017 due to a step change from the top-down to the bottom-up methodology. It was broadly stable at 0.8% of theoretical duty liability from 2016 to 2017 to 2021 to 2022, before reducing to 0.3% in 2022 to 2023, where it has remained in 2024 to 2025.
Figure 3.26: Diesel duty gap by value (£ million) and as a percentage of theoretical duty liability, 2005 to 2006 up to 2024 to 2025
Notes for Figure 3.26:
- The full data series can be seen in the online tables.
Figure 3.27 shows the diesel duty gap, duty liability, and the theoretical duty liability, which is the sum of the duty gap and duty liability, since 2020 to 2021.
The gross diesel duty gap decreased from £120 million in 2020 to 2021 to £40 million in 2024 to 2025. Restoration fees form the compliance yield that is subtracted from the gross duty gap to derive the net duty gap. Restoration fees cover the revenue collected from penalties for misusing rebated fuel plus an amount of duty calculated from the size of the vehicle fuel tank. Restoration fees have remained below £10 million between 2020 to 2021 to 2024 to 2025. The net diesel duty gap has decreased from £120 million in 2020 to 2021 to £40 million in 2024 to 2025, whilst diesel duty liabilities have increased from £13.6 billion in 2020 to 2021 to £16.1 billion in 2021 to 2022, followed by a reduction to £14.7 billion in 2024 to 2025. The theoretical diesel duty liability increased from £13.7 billion in 2020 to 2021 to £16.3 billion in 2021 to 2022, followed by a reduction to £14.8 billion in 2024 to 2025.
Figure 3.27: Diesel duty gap, compliance yield, duty liability and theoretical duty liability (£ million), since 2020 to 2021
| Year | Gross gap | Compliance yield | Net duty gap | Duty liability | Theoretical duty liability |
|---|---|---|---|---|---|
| 2020-21 | 120 | <10 | 120 | 13,630 | 13,750 |
| 2021-22 | 140 | <10 | 140 | 16,150 | 16,290 |
| 2022-23 | 50 | <10 | 40 | 16,000 | 16,050 |
| 2023-24 | 40 | <10 | 40 | 15,420 | 15,460 |
| 2024-25 | 40 | <10 | 40 | 14,710 | 14,750 |
Notes for Figure 3.27:
-
The full data series can be seen in the online tables.
-
Figures are rounded to the nearest £10 million.
-
Figures may not sum due to rounding.
-
Liability refers to the actual amount expected to be received by HMRC based on taxpayer declarations and HMRC’s compliance activity.
Additional to the diesel duty gap is the diesel VAT gap. The VAT gap arising from undeclared diesel is captured within the overall VAT gap covered in chapter 2. Figure 3.28 shows the VAT gap arising from undeclared diesel since 2020 to 2021.
The VAT gap arising from undeclared diesel has decreased from £30 million in 2020 to 2021 to £10 million in 2024 to 2025.
Figure 3.28: VAT gap arising from undeclared diesel (£ million), since 2020 to 2021
| Year | VAT gap |
|---|---|
| 2020-21 | 30 |
| 2021-22 | 40 |
| 2022-23 | 10 |
| 2023-24 | 10 |
| 2024-25 | 10 |
Notes for Figure 3.28:
-
The full data series can be seen in the online tables.
-
Figures are rounded to the nearest £10 million.
-
Figures are included in the VAT gap estimate.
Revisions
There are minor revisions to the diesel duty gap since the publication of the ‘Measuring tax gaps 2025 edition’, mainly driven by updates to clearance volumes, road consumption statistics and duty rates. The latest available published data can be found in the Hydrocarbon Oils Bulletin.
Other fuels
The duty gap in other fuels is assumed to be negligible due to low demand from commercial sectors and the highly flammable nature of the products.
Other excise duties
Main findings
The other excise duties gap captures the duty gaps of excise duties that do not currently have standalone models in the ‘Measuring tax gaps’ publication; namely betting and gaming, cider and perry, spirits-based ready-to-drink beverages and wine duties.
Limitations in data or methods available means it is difficult to estimate these components individually, which is why an aggregated estimate is produced under ‘other excise duties’.
The other excise duties gap is based on an illustrative method, whereby a proxy indicator for the scale of revenue losses across other excise duties has been produced by estimating the weighted average percentage of tax gaps from established excise duty gap estimates, namely beer, spirits, tobacco and oils, each year and multiplying this by theoretical duty liabilities. More detail is provided in the ‘Methodological annex’.
The average percentage revenue losses should not be considered estimates of the true percentage losses across betting and gaming, cider and perry, spirits-based ready-to-drink beverages and wine duties, as these are unknown. Many of these taxes are very different from one another in nature and are therefore subject to different rules. The true other excise duties gaps are therefore likely to vary across the duties.
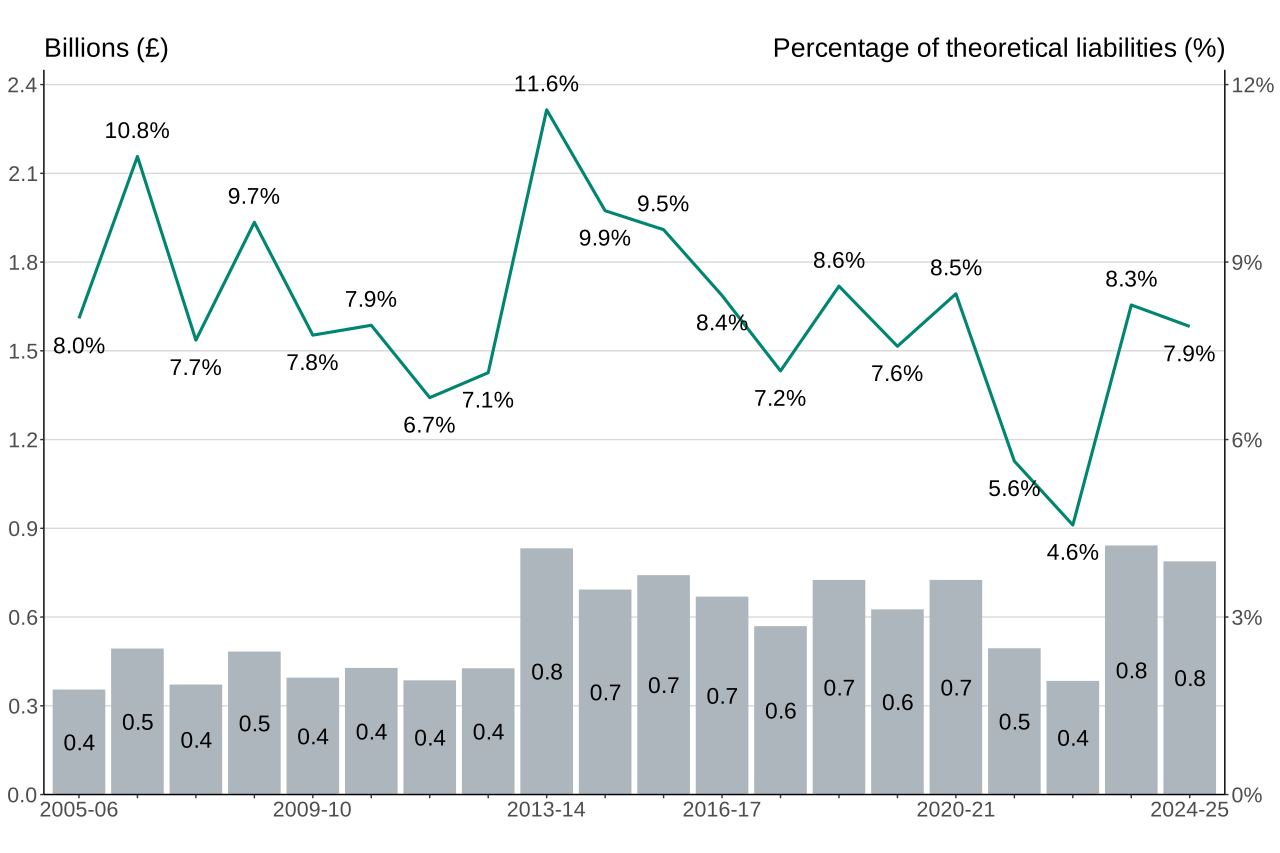
Figure 3.29 shows the other excise duties gap time series in absolute terms and as a percentage of other excise duties theoretical liabilities.
The other excise duties gap is 7.9% of the theoretical other excise duties liabilities, or £0.8 billion in absolute terms, in the 2024 to 2025 tax year.
The estimate for the other excise duties gap has fluctuated over time with a slight overall downward trend from 8.0% in 2005 to 2006, peaking at 11.6% in 2013 to 2014, then decreasing to 7.9% in 2024 to 2025.
Figure 3.29: Other excise duties gap by value (£ billion) and as a percentage of theoretical duty liabilities, 2005 to 2006 up to 2024 to 2025
Notes for Figure 3.29:
- The full data series can be seen in the online tables.
Figure 3.30 shows the other excise duties gap, duty liability, and the theoretical duty liability, which is the sum of the duty gap and duty liability, since 2020 to 2021.
The other excise duties gap has increased from £0.7 billion in 2020 to 2021 to £0.8 billion in 2024 to 2025, whilst other excise duties liability has increased from £7.8 billion to £9.2 billion over the last 5 years. The theoretical other excise duties liability increased from £8.6 billion to £10.0 billion over the last 5 years.
Figure 3.30: Other excise duties gap, duties liabilities and theoretical duties liabilities (£ billion), since 2020 to 2021
| Year | Net duties gap | Duties liability | Theoretical duties liability |
|---|---|---|---|
| 2020-21 | 0.7 | 7.8 | 8.6 |
| 2021-22 | 0.5 | 8.3 | 8.8 |
| 2022-23 | 0.4 | 8.1 | 8.4 |
| 2023-24 | 0.8 | 9.3 | 10.2 |
| 2024-25 | 0.8 | 9.2 | 10.0 |
Notes for Figure 3.30:
-
The full data series can be seen in the online tables.
-
Figures are rounded to the nearest £0.1 billion.
-
Figures may not sum due to rounding.
-
Liability refers to the actual amount expected to be received by HMRC based on taxpayer declarations and HMRC’s compliance activity.