Local authority and children's homes in England inspections and outcomes autumn 2019: main findings
Updated 22 September 2020
Applies to England

© Crown copyright 2020
This publication is licensed under the terms of the Open Government Licence v3.0 except where otherwise stated. To view this licence, visit nationalarchives.gov.uk/doc/open-government-licence/version/3 or write to the Information Policy Team, The National Archives, Kew, London TW9 4DU, or email: psi@nationalarchives.gov.uk.
Where we have identified any third party copyright information you will need to obtain permission from the copyright holders concerned.
This publication is available at https://www.gov.uk/government/statistics/local-authority-and-childrens-homes-in-england-inspections-and-outcomes-autumn-2019/local-authority-and-childrens-homes-in-england-inspections-and-outcomes-autumn-2019-main-findings
The Local authority and children’s homes inspections and outcomes in England release also includes:
- data tables
- methodology
- pre-release access list
About this release
This release covers:
- inspections and outcomes for local authority children’s services inspections as at 31 August 2019 and published by 30 September 2019 (final data)
- inspections and outcomes for local authority children’s services inspections between 1 April 2019 and 31 August 2019, published by 30 September 2019 (provisional data)
- inspections and outcomes of the most recent inspection, for all children’s homes, as at 31 August 2019 and published by 30 September 2019 (final data)
- inspections and outcomes for all children’s homes between 1 April 2019 to 31 August 2019, published by 30 September 2019 (provisional data)
The overall effectiveness of LA children’s services is improving.
At the end of August 2019, 49% of LAs were judged good or outstanding at their most recent inspection. This is 13 percentage points higher than the proportion judged good or outstanding following each authority’s first inspection under the single inspection framework (SIF).
More than half of LAs received a judgement of good or outstanding for the impact of leaders.
As at 31 August 2019, 56% of LAs were judged good or outstanding in the judgement of impact of leaders, a 17 percentage point increase compared with the proportion after every LA’s first inspection under the SIF.
Four in 5 LAs in London are judged good or outstanding, compared with 1 in 5 in the West Midlands region.
Of those LAs inspected as at 31 August 2019, London continues to have the highest proportion judged good or outstanding, at 79%. The West Midlands has the lowest proportion of LAs judged good or outstanding, at 21%.
Around 4 in 5 children’s homes are judged good or outstanding.
As at 31 August 2019, the proportion of children’s homes judged good or outstanding was 82%, an increase of 2 percentage points since 31 March 2019.
Introduction
This release contains data on all children’s homes inspections and local authority (LA) inspections. It supplements the Children’s Social Care data in England 2019 statistics, which cover all Ofsted social care providers’ inspections, and are published on an annual basis in July.
This additional release previously covered the 6-month period 1 April to 30 September and was published in December, 6 months after the full release. As a result of a consultation, from autumn 2019 this release covers the 5-month period from 1 April to 31 August and is published in November to align it with the period for other remits (types of provider we inspect) and with the period covered by our Annual Report.
Inspection details
Ofsted inspects the 151 LAs in England responsible for ensuring and overseeing the effective delivery of social care services for children. The number of LAs is 151 from April 2019, due to the merger of Poole and Bournemouth into a single LA, and the reformatting of Dorset’s borders. These 2 new LAs – Bournemouth, Christchurch and Poole, and Dorset – had not been inspected as at 31 August 2019, therefore in this release the analysis of LA inspections is based on the outcomes for 149 LAs.
Ofsted inspects LA services for children who need help and protection, children in care and care leavers under the inspections of local authority children’s services (ILACS) framework. This inspection cycle began in January 2018. The previous framework, the SIF, ended in October 2017 but was still used for some re-inspections of inadequate LAs up until summer 2018. Throughout this release, when we refer to LAs improving or declining, we are comparing the current position under ILACS with the picture at the end of every LA’s first SIF inspection.
Children’s homes are inspected under the social care common inspection framework (SCCIF) framework. All homes receive a full inspection, and certain homes receive an interim inspection, on an annual cycle. Children’s homes may receive additional concern-driven inspections.
Children’s homes are made up of 3 different sub types of homes:
- children’s homes – these are most of the homes in England and are defined as any home that does not fall within the other 2 sub-types below
- residential special school registered as a children’s home – these are residential schools which, due to the number of days they look after children, must register as children’s homes
- secure children’s homes
Inspections of local authority children’s services
There are almost 12 million children and young people in England. The 151 local authorities in England provide children’s services to around 400,000 children in need each year. More than 75,000 of these children are children in care. We inspect these LAs to see how their children’s services are performing.
Overall LA effectiveness as at 31 August 2019
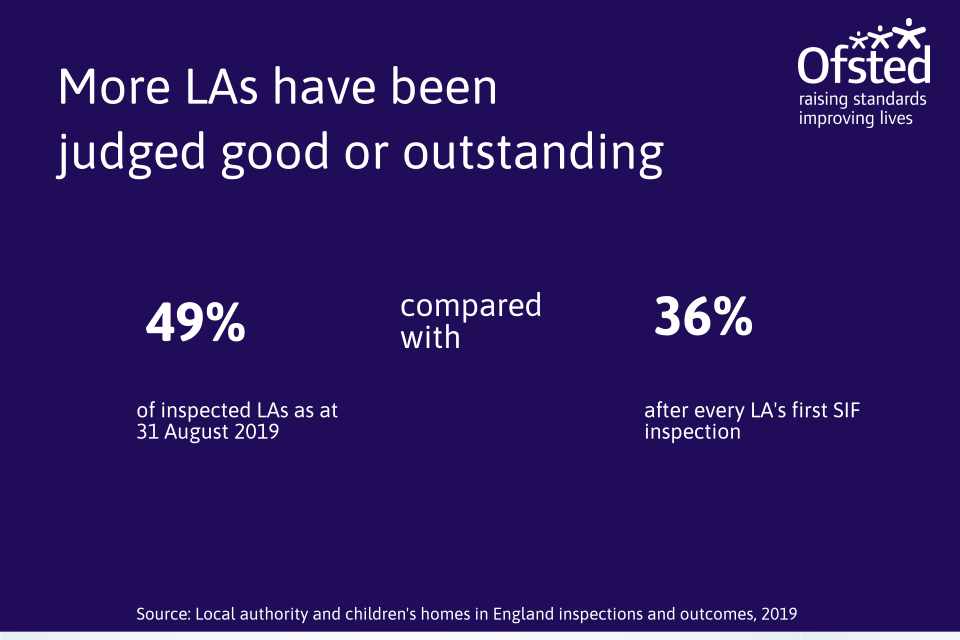
This image shows the change in the percentage of LAs judged good or outstanding between 31 August 2019 and after every LA's first SIF inspection. The proportion of LAs judged good or outstanding has risen from 36 to 49% over time.
Nationally, the overall effectiveness of LA children’s services continues to improve. Currently, 49% of LAs are judged good or outstanding, 39% are requires improvement to be good, and 12% inadequate (Figure 1). This is an improvement from the end of March 2019, and a substantial improvement from the picture after every LA’s first SIF inspection, when 36% of LAs were judged good or outstanding. At the same time, the percentage of the LAs judged inadequate has reduced by almost a half from 22% after every LA’s first SIF inspection to 12% as at 31 August 2019.
Figure 1: LA overall effectiveness as at 31 August 2019 compared to the grade profile as at 31 March 2019, and after every LA’s first SIF inspection

This chart shows the LA overall effectiveness grade profile as at 31 August 2019 compared with 31 March 2019, and after every LA’s first SIF inspection. The percentage of LAs judged good or outstanding has increased over time.
Inspection judgements as at 31 August 2019
In addition to the overall effectiveness judgement, LA children’s services receive judgements in 3 areas:
- the experiences and progress of children who need help and protection
- the experiences and progress of children in care and care leavers
- the impact of leaders on social work practice with children and families
The proportion of LAs judged good or outstanding for children who need help and protection has always been lower than for overall effectiveness. In August 2019, this had increased however to 37% of LAs compared with 28% following every LA’s first SIF inspection.
Under the SIF, no LA was judged outstanding for help and protection at its first inspection. By August 2019, there were 7 LAs that had received an outstanding judgement. These are:
- Bexley
- Essex
- Hampshire
- Leeds
- North Yorkshire
- Redbridge
- Suffolk
Under the ILACS framework, ‘children in care and care leavers’ remain comparable judgement to the ‘children looked after and achieving permanence’ in the SIF.
For the children in care judgement, the percentage of LAs judged to be good or outstanding has increased to 48% as at 31 August 2019 from 38% after every LA’s first SIF inspection.
As figure 2 shows, the impact of leaders judgement has seen the biggest change, with 56% of LAs judged good or outstanding in this area as at 31 August 2019. This is a 17 percentage point increase compared with the proportion after every LA’s first SIF inspection.
It is important to note that the ILACS framework looks at the impact of leaders rather than leadership, management and governance in SIF.
Figure 2: The percentage of LAs judged good or outstanding in each ILACS judgement as at 31 August 2019 compared with the picture as at 31 March 2019, and after every LA’s first SIF inspection

This chart shows the change in the percentage of LAs judged good or outstanding for 3 judgements: help and protection, children in care, and impact of leaders. The impact of leaders judgement has seen the biggest improvement over time.
Regional profile as at 31 August 2019
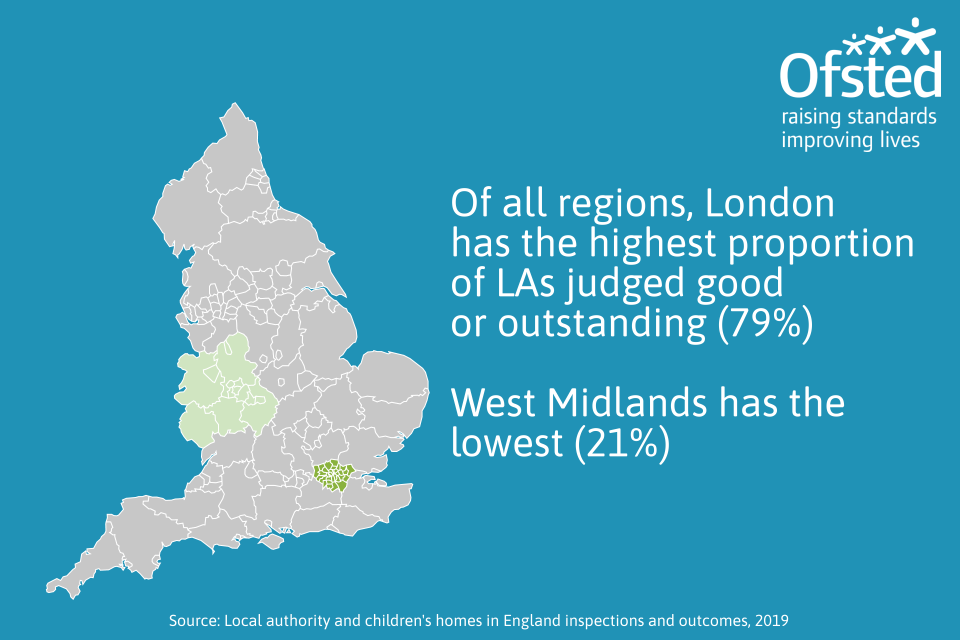
This image shows that of all regions, London has the highest proportion of LAs judged good or outstanding, and the West Midlands has the lowest.
The number of LAs varies considerably between the Ofsted regions. London has the highest number of LAs (33), and the East Midlands has the lowest (9).
Across the 8 Ofsted regions, 5 had shown an increase in the number of LAs judged good or outstanding compared with the picture after every authority’s first SIF inspection. London saw the largest increase with 79% of LAs judged good or outstanding as at 31 August 2019 compared with 52% previously. East of England and the West Midlands saw no change overall, despite the West Midlands having the lowest proportion of good or outstanding LAs. It is worth noting, however, that the West Midlands has the highest proportion of LAs judged requires improvement to be good, at 64% as at 31 August 2019. In the 9 authorities of the East Midlands, 3 were good or outstanding at the end of August 2019 compared with 4 after every LA’s first SIF inspection.
Table 1: Proportion of LAs judged good or outstanding as at 31 August 2019 compared with after every LA’s first SIF, by Ofsted region
| Ofsted region (number of LAs) | Percentage of LAs judged good or outstanding as at 31 August 2019 | Percentage of LAs judged good or outstanding after every LA’s first SIF |
|---|---|---|
| England (149) | 49% | 36% |
| London (33) | 79% | 52% |
| North East, Yorkshire and the Humber (27) | 56% | 41% |
| South East (19) | 47% | 26% |
| East of England (11) | 45% | 45% |
| South West (13) | 38% | 19% |
| East Midlands (9) | 33% | 44% |
| North West (23) | 30% | 26% |
| West Midlands (14) | 21% | 21% |
The second column with the SIF inspection data includes 3 LAs which have no current inspection grade due to restructuring LA boundaries. These 3 LAs are in the the South West region.
LA overall effectiveness by local authority type as at 31 August 2019
Out of 149 LAs that had an overall effectiveness grade as at 31 August 2019, London boroughs continue to have the highest proportion of LAs judged good or outstanding at 79%. In shire counties (also known as non-metropolitan counties), despite 6 LAs having been now judged outstanding, overall the proportion of LAs judged good or outstanding decreased from 48% after every LA’s first SIF inspection to 42% as at 31 August 2019 (Figure 3).
Figure 3: LA overall effectiveness judgement split by LA type, at 31 August 2019

This chart shows the LA overall effectiveness grade profile as at 31 August 2019 by 4 types of LAs. London boroughs have the highest percentage of LAs judged good or outstanding and metropolitan districts have the lowest.
ILACS activity between 1 April 2019 and 31 August 2019

This image shows that twice as many LAs improved in overall effectiveness grade than declined between 1 April 2019 and 31 August 2019.
In total, 27 LAs have received an ILACS inspection outcome since the end of March 2019. This number includes 5 inspections that took place between January and March 2019, but their inspection reports were published in May 2019.
There were 18 standard inspections and 9 short inspections. The short and standard inspections have the same scope, with judgements made against the same grade descriptors. However, short inspections are of LAs previously judged good or outstanding.
Of these 27 ILACS inspections:
- 4 were judged outstanding
- 8 were judged good
- 10 were judged requires improvement to be good
- 5 were judged inadequate
More than half of all LAs (15) improved their overall effectiveness judgements, 7 LAs declined and 5 retained the same judgement.
As figure 4 shows, all previously inadequate LAs improved. Those judged good were more likely to improve or remain good than decline, and the outcomes for LAs previous judged requires improvement to be good varied. As at 31 August 2019, we have not re-inspected any of the LAs judged outstanding under SIF.
Figure 4: Change in overall effectiveness judgement from previous SIF inspection to ILACS inspection for LAs inspected in 1 April 2019 to 31 August 2019

This image shows the change in the overall effectiveness grade for 27 LAs inspected between 1 April 2019 and 31 August 2019. All previously inadequate LAs improved.
Of the 15 LAs that improved their effectiveness, 4 improved from good to outstanding. These are: Hampshire, Lincolnshire, Redbridge and Suffolk.
Seven LAs previously judged inadequate were inspected in the current reporting period and all improved:
- 5 improved to requires improvement to be good (Kirklees, Tameside, Wirral, Worcestershire, South Gloucestershire)
- 2 improved to good (Barnet and Tower Hamlets)
Of the 7 LAs that declined, 2 declined from good to requires improvement to be good (Derbyshire and Stockton-on-Tees), and 5 declined to inadequate: 1 from good (Trafford), and 4 from requires improvement to be good (Medway, Northamptonshire, Kingston Upon Hull, and West Sussex).
ILACS monitoring visits
Between 1 April and 31 August 2019, Ofsted carried out 11 monitoring visits. Each LA only received 1 visit during the period. The 11 inadequate authorities receiving monitoring visits were judged inadequate in the following areas:
- help and protection (11)
- leadership and management (10)
- children in care and care leavers (6)
The majority (8) of these monitoring visits focused on the systems for identifying and assessing need when an individual first contacts the authority with concerns for a child, known collectively as ‘the front door’. A further 2 visits reviewed the progress for children in need or subject to a protection plan, and 1 visit was to review children in care.
ILACS focused visits
Between 1 April and 31 August 2019, Ofsted carried out 14 focused visits to 14 LAs. They were previously judged good (4), or requires improvement to be good (10) for overall effectiveness.
The most common themes for focused visits was were:
- the front door (6)
- children in need/subject to a plan (4)
- achieving permanence (2)
- vulnerable adolescents (1)
- children in care (1)
Overall experiences and progress of children and young people for all children’s homes
Inspection profile as at 31 August 2019
Due to the change in period covered by this release, from 30 September to 31 August, we have chosen not to include comparisons to last year’s data.
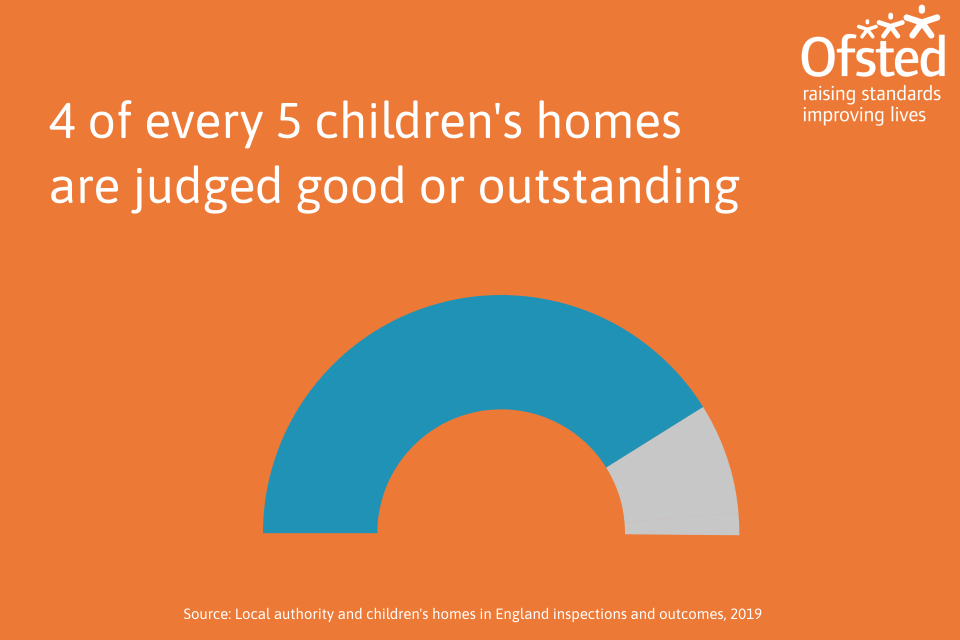
This image shows that 4 out of 5 children's homes were judged good or outstanding as at 31 August 2019.
On 31 August 2019, 2,216 children’s homes (93% of all homes) had an inspection judgement. Eighty-two per cent were judged good or outstanding, 15% were judged requires improvement to be good, and 3% were judged inadequate at their most recent inspection (Figure 5).
Figure 5: All children’s homes overall effectiveness as at 31 August 2019

This image shows the overall effectiveness grade profile of all children's homes as at 31 August 2019.
More homes of all 3 types had been judged inadequate as at 31 August 2019 compared with 31 March 2019. This is expected because of the way children’s homes are selected for inspection based on their risk assessment. It means that homes assessed as high risk, and those previously judged requires improvement to be good or inadequate, are inspected first in the inspection cycle. As at 31 August 2019, we have inspected around 900 homes in the new inspection cycle, which means that some homes do not have a new judgement yet and their judgement is from the previous inspection year.
As shown in figure 6, the grade profile of children’s homes is very similar to the overall grade profile of all types of children’s homes. The most notable change in the overall effectiveness between 31 March and 31 August 2019 was in secure children’s homes, where 3 homes declined to inadequate:
- 1 from good, and
- 2 from requires improvement to be good.
This means almost a third of secure children’s homes are now judged inadequate.
Figure 6: Most recent overall effectiveness of children’s homes as at 31 August 2019, by type

This chart shows the overall effectiveness grade profile for all types of children's homes as at 31 August 2019. Children's homes have the highest percentage of homes judged good or outstanding while secure children's homes have the lowest.
Three residential special schools registered as children’s homes also declined to inadequate. In addition, 2 homes declined from outstanding to good, and 1 from good to requires improvement to be good. Despite this, the proportion of homes judged good or outstanding increased by 6 percentage points from 71% as at 31 March 2019 to 77% as at 31 August 2019. This is because 6 homes improved from requires improvement to be good to good, and 1 inadequate home resigned since March 2019.
Regional profile of children’s homes as at 31 August 2019
In most regions the percentage of children’s homes of all types judged good or outstanding has increased or remained the same. In 2 regions, East of England and South East, the increase was by 8 percentage points – the largest increase among regions. One region, East Midlands, has seen a decrease in the percentage of homes judged good or outstanding by 3 percentage points. Because of all these changes, the gap between the regions with the highest and the lowest percentages of children’s homes judged good or outstanding reduced slightly from 21 percentage points at 31 March 2019 to 20 percentage points as at 31 August 2019.
Table 2: Proportion of children’s homes of all types judged good or outstanding as at 31 August 2019 and as at 31 March 2019, by Ofsted region
| Ofsted region | Percentage of children’s homes judged good or outstanding as at 31 August 2019 | Percentage of children’s homes judged good or outstanding as at 31 March 2019 |
|---|---|---|
| England | 82% | 80% |
| North East, Yorkshire and the Humber | 88% | 87% |
| South East | 87% | 79% |
| North West | 85% | 84% |
| East of England | 83% | 74% |
| East Midlands | 81% | 84% |
| West Midlands | 80% | 79% |
| London | 72% | 71% |
| South West | 69% | 65% |
Children’s homes overall effectiveness by sector as at 31 August 2019
As figure 7 shows, overall, children’s homes run by LAs and those in voluntary sector performed better than privately owned homes. As at 31 August 2019, 84% of LA and voluntary-run homes were judged good or outstanding, compared with 82% of homes in private sector.
Figure 7: All children’s homes overall effectiveness as at 31 August 2019 by sector

This chart shows the overall effectiveness grade profile for children's homes as at 31 August 2019 by each sector. Children’s homes run by LAs and those in the voluntary sector performed better than privately-owned homes.
Inspection judgements for health authority homes have not been included as a separate entry because there are so few of them (9 homes: 7 judged good and 2 requires improvement to be good). They have, though, been included in the England figure.
All children’s homes inspections in the period between 1 April and 31 August 2019

This image shows that 2 in 3 children's homes inspected between April and August 2019 were judged either good or outstanding.
Between 1 April and 31 August 2019, there were 911 full inspections of all children’s homes. Three further children’s homes also had a monitoring visit with a judgement. These 3 inspections and outcomes are included in the analysis below.
Because of the change in the reporting period that is covered by this release, the inspection outcomes cannot be compared with the same period in the previous year.
Figure 8: All children’s homes overall effectiveness for inspections that took place between 1 April 2019 and 31 August 2019

This chart shows the overall effectiveness grade profile for all types of children's homes inspected between 1 April and 31 August 2019. Children's homes have the highest percentage of homes judged good or outstanding.
Between 1 April 2019 and 31 August 2019, 2 in 3 homes were judged either good or outstanding, and nearly 1 in 10 was judged inadequate.
Overall effectiveness for all children’s homes – change since 2018 to 2019 inspection
Of the 914 homes that had an inspection with an overall effectiveness judgement between 1 April 2019 and 31 August 2019, 816 also had an inspection grade in the previous year (1 April 2018 to 31 March 2019).
Figure 9: Change to overall effectiveness of the children’s homes inspected in 2019 to 2020 compared with their previous inspection judgement in 2018 to 2019

This image shows the change in the overall effectiveness grade for children's homes inspected between 1 April 2019 and 31 August 2019 compared with their judgement in the previous inspection year. More than half of homes retained the same judgement.
The proportion of homes judged the same was 54%. Of the remaining homes, 23% improved and 23% declined compared with their previous inspection judgement in 2018 to 2019.
Inadequate inspections in the period
Eighty children’s homes were judged inadequate at the first full inspection in 2019 to 2020. None of these had been judged inadequate at their most recent previous inspection in 2018 to 2019. Thirty-five homes declined from good, 35 from requires improvement to be good, and 4 from outstanding. Six were newly registered homes, not previously inspected.
As shown in figure 10, most inadequate homes had at least 1 monitoring visit in the period, and almost all homes that had another full inspection improved to either requires improvement to be good, or good. Some homes were inspected and judged inadequate near the end of the 5-month period covered by this release and therefore did not have another visit or inspection within the reporting period; 3 of them resigned before 31 August 2019.
Figure 10: Inspection activity of children’s homes initially judged inadequate in the period between 1 April 2019 and 31 August 2019

This chart shows the overall effectiveness grade profile for children's homes inspected between 1 April and 31 August 2019 by each sector. Children’s homes in private sector had the highest percentage of homes judged good or outstanding.
Interim inspections
Between 1 April and 31 August 2019, 15 children’s homes had an interim inspection, of which 12 resulted in a judgement. The remaining 3 homes were not judged because no children were living in the home at the time of inspection.
Of these 12 homes that had an interim inspection with a judgement:
- 3 improved
- 5 sustained effectiveness
- 4 declined
Of the 4 homes that were judged as having declined effectiveness, 2 were previously judged requires improvement to be good, 1 was good, and 1 was outstanding. Three of these homes had follow-up monitoring visits in the period, and 1 of them was suspended as at 31 August 2019.
Revisions to previous release
The provisional data in the previous Children’s Social Care data in England 2019 release related to inspections that took place between 1 April 2019 and 31 March 2019 with reports published by 30 April 2019.
It indicated that there were 3,480 inspections of all social care providers in this period. This revised data shows that there were an additional 66 inspections that took place between 1 April 2019 and 31 March 2019 with reports published since 30 April 2019. These consist of an additional 44 full inspections, and 6 monitoring visits of all provision types, and 16 interim inspections of children’s homes.
The addition of these inspections changed the profile of overall effectiveness for children’s homes, boarding schools, and residential special schools as at 31 March 2019. The proportion of children’s homes of all types judged outstanding increased by 1 percentage point from 18% to 19%, and the proportion of homes judged good fell by 1 percentage point from 62% to 61%. These revisions did not result in any changes to the main findings identified in the previous publication because the proportion of homes judged good or outstanding as at 31 March 2019 remains the same (80%).
The proportion of boarding schools judged inadequate increased from 15% to 16% and those judged requires improvement to be good fell from 11% to 10%. The proportion of residential special schools judged good or outstanding increased from 87% to 88%. You can find further details in the revised tables in the charts and tables file accompanying this release.
Revisions to data in this publication are published in line with Ofsted’s revisions policy for official statistics.
Notes
In March 2019, Ofsted consulted with users to seek views on our proposals for revisions to the frequency and content of social care inspection official statistics and management information. This is described in more detail in the accompanying quality and methodology report. Following the consultation, we removed interactive tables from the underlying data file and changed the period covered by this release from 6 months (1 April to 30 September) to 5 months (1 April to 31 August).
The accompanying quality and methodology report for this release sets out the main uses of this data, further contextual information, and arrangements for quality assurance. It also provides information about strengths and limitations of the statistics.
Across the figures and tables, percentages are rounded and may not add to 100.
Glossary
For a full definition of the terms below, please see the glossary tab within the underlying data tables.
Children’s homes
A children’s home is an establishment that provides care and accommodation wholly or mainly for children. Children’s homes vary in size and nature, and fulfil a range of purposes to meet the different needs of children and young people.
London boroughs
The London boroughs are the 32 local authority districts that make up Greater London, and the City of London, which is a City Corporation. The London boroughs are administered by London borough councils. They are the principal local authorities in London and are responsible for running most local services, such as schools, social services, waste collection and roads.
Metropolitan districts
They are the principal local authorities in the 6 largest urban areas in England outside Greater London: the counties of Greater Manchester, Merseyside, South Yorkshire, Tyne and Wear, West Midlands, and West Yorkshire. There are 36 metropolitan districts, which are administered by metropolitan district councils. They are responsible for running most local services, such as schools, social services, waste collection and roads.
Residential special schools registered as children’s homes
Residential special schools registered as children’s homes provide education and accommodation to children resident for more than 295 days per year, including children with very specialist needs.
Sector
‘Sector’ refers to the type of provider that owns the children’s social care provision. These can be:
- academy: publicly funded independent schools run by trusts
- health authority: run by NHS Trusts
- LA: public bodies responsible for the children’s social care provision
- private: for-profit organisations mostly with limited company status; they can also be individually owned children’s social care provisions and run for profit
- voluntary: mostly not-for-profit organisations, mainly with charitable status, and individually owned provisions run on a not-for-profit basis
Secure children’s homes
Secure children’s homes accommodate children and young people who are remanded or have been sentenced for committing a criminal offence, or whose behaviour is deemed to present a significant threat to their own and others’ safety.
Shire counties
Shire counties, also known as non-metropolitan counties, have a 2-tier structure of local government. Most non-metropolitan counties have a county council, and also have several districts, each with a borough or district council. In these cases, local government functions are divided between county and district councils. There are 26 shire county councils.
Unitary authorities
A unitary authority is a type of local authority that has a single tier and is responsible for all local government functions within its area. Typically, unitary authorities cover towns or cities that are large enough to function independently of county or other regional administration. There are 56 unitary authorities, including the Council of the Isles of Scilly, where some local government services are provided in conjunction with Cornwall Council.
You can find detailed information on the administrative structure within England on the Office for National Statistics website.
Further information
Contact for comments or feedback
If you have any comments or feedback on this publication, please contact Adam King on 03000 130 020 or socialcaredata@ofsted.gov.uk.
Annual Report
Findings from our forthcoming Annual Report will be published on 21 January 2020.
Acknowledgements
Thanks to the following for their contribution to this statistical release: Anna Otczyk, Emily Moreton, Fiona Lewis, Austen Norris, Talan George.
Instructions for printing and saving
Instructions may vary depending on which browser you use, such as Internet Explorer or Google Chrome, and the type of device you use, such as an iPhone or laptop.
You will find your print and save options in your browser’s menu. You may also have other options available on your device. The instructions for mobile and tablet devices will be specific to their make and model.
How to search
Click on Ctrl + F on a Windows laptop or Command + F on a Mac
This will open a search box in the top right-hand corner of the page. Type the word you are looking for in the search bar and press enter.
Your browser will highlight the word, usually in yellow, wherever it appears on the page. Press enter to move to the next place it appears.
How to print a copy of the guidance
Click on Ctrl + P on a Windows laptop or Command + P on a Mac
You can also choose to save as a PDF.