Liver disease profiles, January 2022 update
Updated 1 March 2022
Applies to England

© Crown copyright 2022
This publication is licensed under the terms of the Open Government Licence v3.0 except where otherwise stated. To view this licence, visit nationalarchives.gov.uk/doc/open-government-licence/version/3 or write to the Information Policy Team, The National Archives, Kew, London TW9 4DU, or email: psi@nationalarchives.gov.uk.
Where we have identified any third party copyright information you will need to obtain permission from the copyright holders concerned.
This publication is available at https://www.gov.uk/government/statistics/liver-disease-profiles-january-2022-update/liver-disease-profiles-january-2022-update
1. New in this update
1.1 New hospital admission data has been added to the Liver Disease Profiles
The liver profile from which this is a summary was developed by the National Liver Disease Intelligence Network at Public Health England, (now in the Office for Health Improvement and Disparities). This follows recommendations in March 2014 from the All-Party Parliamentary Hepatology Group (APPHG) inquiry into improving outcomes in liver disease. The APPHG was chaired by the late Sir David Amess.
This is one of a series of bulletins for liver disease profile updates. The Liver disease profiles: November 2021 update covered mortality and vaccination coverage data.
This update includes new data for 3 indicators in the liver disease profile:
-
hospital admissions for liver disease in persons, males and females
-
hospital admissions for alcoholic liver disease in persons, males and females
-
hospital admissions for non-alcoholic fatty liver disease (NAFLD) in persons (3-year and 1-year)
Due to the potential impact of coronavirus (COVID-19) on hospital data, indicators that were only available at a 3-year view are now being presented in views for both 3-year up to the financial year ending 2020 and 1-year up to the financial year ending 2021 where numbers allow. The indicators with data prior to 2020 were refreshed to account for the new 2021 local authority configurations.
2. Main findings
This update shows:
-
rates of admission to hospital where the primary diagnosis was liver disease significantly decreased from 143.6 per 100,000 population in the financial year ending 2020 to 124.3 per 100,000 population in the financial year ending 2021 (the first full year of the COVID-19 pandemic)
-
at a regional level, overall rates of liver disease admissions to hospital remain highest in the north of England with the North East having the highest rate of 166.8 per 100,000 population in the financial year ending 2021
-
rates of admission to hospital for alcoholic liver disease in the financial year ending 2021 were the highest (45.5 per 100,000 population, a count of 24,544 admissions) they have been since the financial year ending 2011 and are significantly higher than they were in the financial year ending 2020
-
there was a 14.6-fold difference in admission rates for alcoholic liver disease between the counties and unitary authorities (UA) with the highest and lowest rate (143.5 per 100,000 population in Hartlepool and 9.8 per 100,000 population in Reading in the financial year ending 2021)
-
in the financial year ending 2021, the rate of hospital admissions from non-alcoholic fatty liver disease reduced to 3.7 per 100,000 population, a count of 2,085, which is significantly lower than the rate in previous year (4.9 per 100,000 population, a count of 2,777)
3. Summary
3.1 Hospital admission rates due to liver disease
This indicator has been updated with data for the financial year ending 2021 for males, females and persons. Prior data has been refreshed to present data for the new 2021 local authority configurations.
In the financial year ending 2021, the rate of hospital admission for liver disease significantly decreased compared to the previous year from 143.6 (142.6–144.6) per 100,000 population to 124.3 (123.4-125.3) per 100,000 population in England. This is a reduction of 19.3 per 100,000 population since the financial year ending 2020.
This significant decrease is reflected in both the male and female rates. In males the rate in the financial year ending 2020 was 179.8 (178.1-181.4) per 100,000 population and fell to 156.4 (154.9-157.9) per 100,000 population in the financial year ending 2021. The rates for females fell from 110.0 (108.7-111.2) per 100,000 population to 94.4 (93.3-95.6) per 100,000 population. The male rate remains 1.7 times higher than the female rate.
Figure 1: Variation in hospital admission rates for liver disease, per 100,000 population, England, 2010/11 to 2020/21
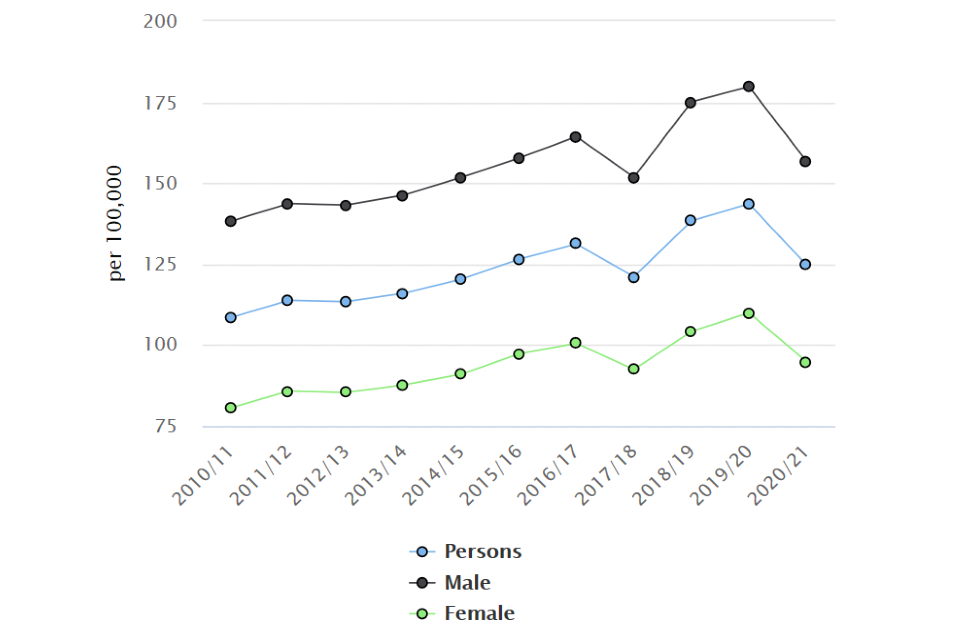
Prior to the financial year ending 2021, trends suggested that liver disease was affecting more and more people each year, with numbers of admissions to hospital reaching 77,180 in the financial year ending 2020. In the financial year ending in 2021, the number of hospital admissions dropped to 67,458, a reduction of 9,722 hospital admissions. This period covers the first year of the coronavirus (COVID-19) pandemic.
At a regional level for persons, rates of liver disease admissions to hospital remain highest in the North of England with the North East having the highest rate (166.8 (161.9-171.8) per 100,000 population) followed by Yorkshire and the Humber (140.6 (137.4-143.8) per 100,000 population) and the North West (140.2 (137.5-143.0) per 100,000 population). This pattern is also found in the male population, however, in females it is the South West and East Midlands regions that have the second and third highest rates after the North East region.
Across the county and unitary authority (UA) areas (sometimes referred to as upper tier local authorities (UTLA)) there is a 4-fold difference between the rate of admissions for liver disease for the financial year ending 2021. Hartlepool experienced the highest rates, 264.4 (231.5-300.6) per 100,000 population (240 admissions), whilst the lowest rate was in Bracknell Forest, 64.1 (50.2-80.6) per 100,000 population (75 admissions).
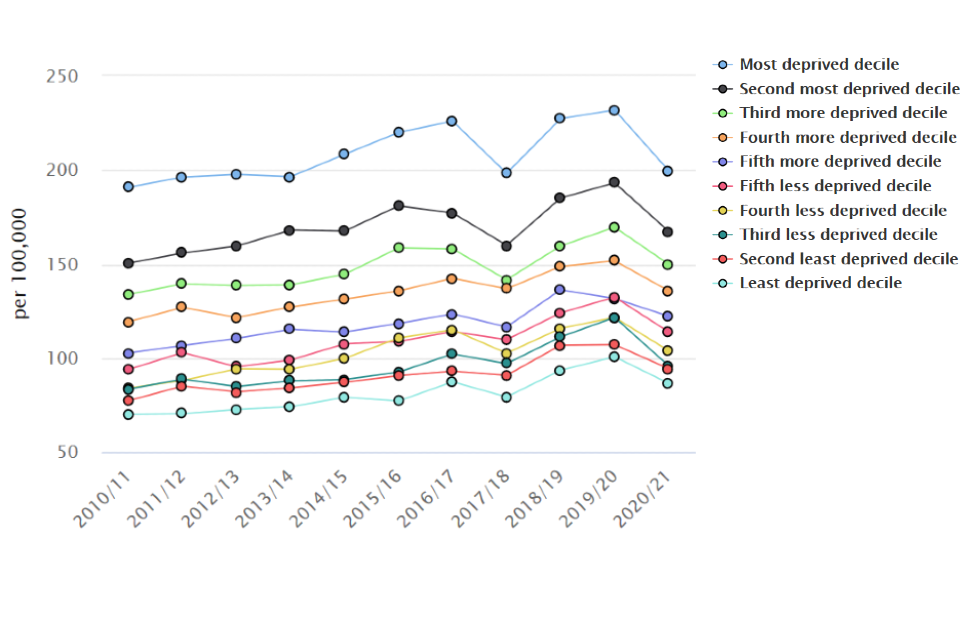
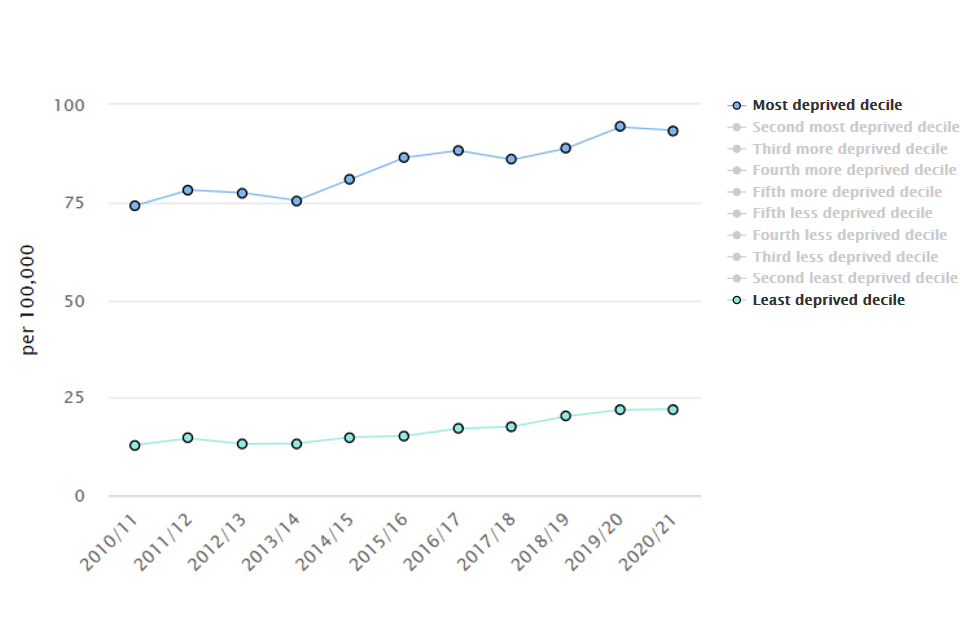
Areas with high levels of deprivation experience higher rates of hospital admission for liver disease. Those in the most deprived lower super output area deprivation decile have a rate (199.3 per 100,000 population) that is 2.3 times higher than that of the least deprived areas (86.0 per 100,000 population). The gap between the deprivation deciles has remained similar over the previous years.
Figure 2: Hospital admission rates due to liver disease, per 100,000 population by lower super output area deprivation decile 2019, England, 2010/11 to 2020/21
3.2 Hospital admission rates for alcoholic liver disease
This indicator has been updated with data for the financial year ending 2021, for males, females and persons. Prior data has been refreshed to present data for the new 2021 local authority configurations.
The rate of hospital admission for alcoholic liver disease has continued to increase since the financial year ending 2011 when it was 31.3 (30.8-31.8) per 100,000 population. In the financial year ending 2021 the rate reached 45.5 (45.0-46.1) per 100,000 population, a count of 24,544 admissions. This was significantly higher than in the previous year
Figure 3: Trend in hospital admission rates for alcoholic liver disease, per 100,000 population, England, 2010/11 to 2020/21
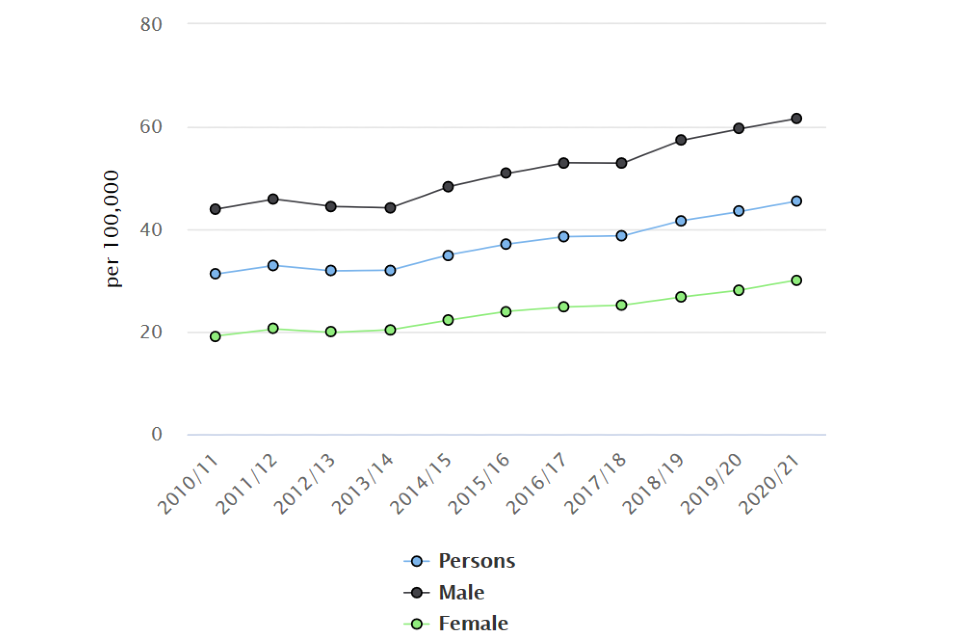
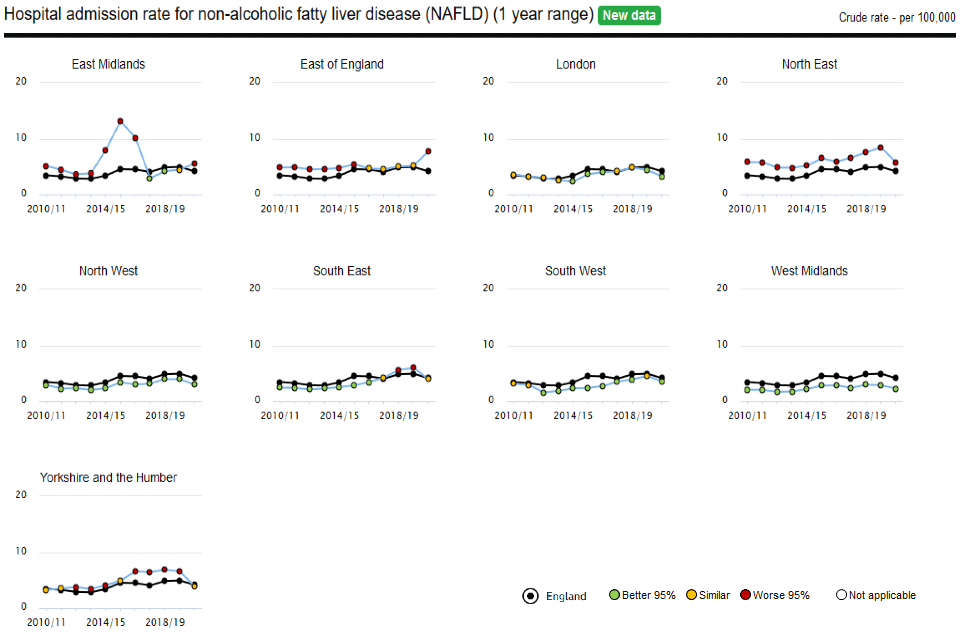
Figure 4: Trend in hospital admission rates for alcoholic liver disease, per 100,000 population, for England Regions, 2010/11 to 2020/21
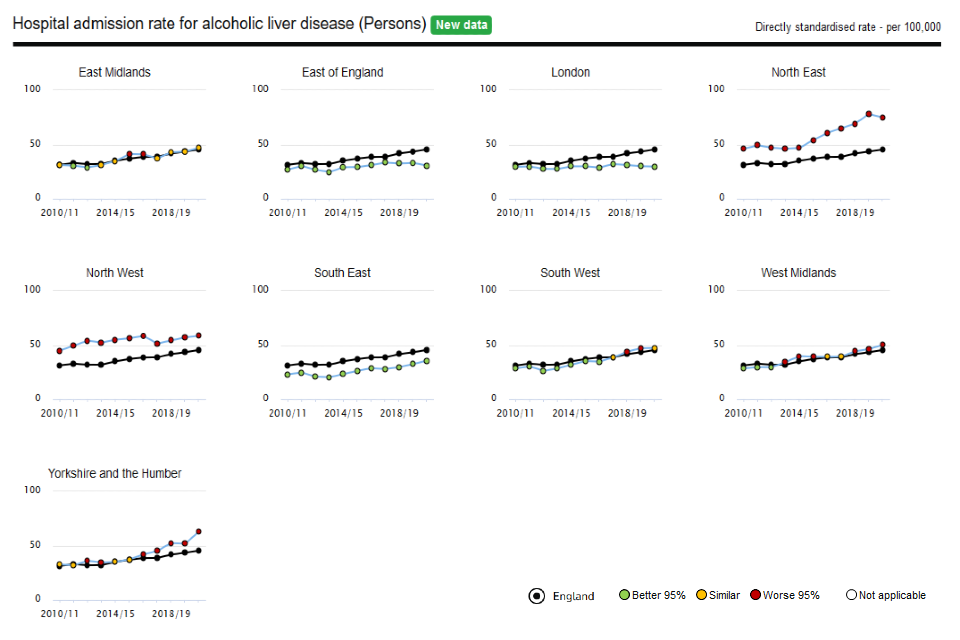
As shown in figure 4, the North East was the region with the highest rate of hospital admissions for liver disease (74.8 (71.5-78.2) per 100,000 population), followed by Yorkshire and the Humber (63.0 (60.9-65.2) per 100,000 population) and the North West (58.6 (56.9-60.4) per 100,000 population). London was the region with the lowest rate (29.7 (28.5-31.0) per 100,000 population).
There was a 14.6-fold difference in admission rates for alcoholic liver disease for the counties and unitary authorities with the highest and lowest rate (143.5 (119.0-171.5) per 100,000 population in Hartlepool and 9.8 (5.3-16.6) per 100,000 population in Reading).
The rate of hospital admissions for alcoholic liver disease is twice as high in males (61.7 (60.7-62.6) per 100,000 population) than for females (30.1 (29.5-30.8) per 100,000 population) in England. The county and unitary authority with the largest difference between male and female rates was Dudley, where there was a 6.8-fold difference (155.4 (136.4-176.3) per 100,000 population in males and 22.7 (16.0-31.3) per 100,000 population in females). Hartlepool had the highest rate for the male population, 242.6 (196.3-296.5) per 100,000 population, almost 4 times higher than the England rate. In the female population, Torbay had the highest rate, 89.2 (68.6-114.0) per 100,000 population.
Areas with high levels of deprivation experience higher rates of hospital admission for alcoholic liver disease (figure 5). Those in the most deprived lower super output area decile have a rate (93.6 (90.8-96.4) per 100,000 population) that is 4.3 times higher than that of the least deprived districts (21.9 (20.7-23.1) per 100,000 population). This gap has widened since the financial year ending 2011.
Figure 5: Hospital admission rates due to alcoholic liver disease, per 100,000 population by lower super output area deprivation decile 2019, England, 2010/11 to 2020/21
3.3 Hospital admission rates due to non-alcoholic fatty liver disease
This indicator has been updated with data for the 3-year period for the financial year ending 2020, and data for 1-year period is now included up to the financial year ending 2021. Prior data has been refreshed to present data for the new 2021 local authority configurations.
In England in the financial year ending 2021, 2,085 people were admitted to hospital due to non-alcoholic fatty liver disease, at a rate of 3.7 (3.5-3.8) per 100,000 population. This rate has been slowly increasing over time but in the rate was significantly lower in the financial year ending 2021, than the previous year ending 2020.
Over the 3 year period ending 2020, rates were twice as high in the North East region (7.5 (6.9-8.1) per 100,000 population) than the West Midlands (2.7 (2.5-3.0) per 100,000 population) which regionally had the lowest rate. Looking at the 1-year data, in the financial year ending 2021, admission rates were highest in the North East region (5.8 (4.9-6.8) per 100,000 population) and the West Midlands remained the lowest (2.3 (1.9-2.7) per 100,000 population).
Figure 6: Hospital admission rates for non-alcoholic fatty liver disease, per 100,000 population, England, 2010/11 – 2020/21
Across the county and UA areas in the financial year ending 2021, Thurrock had the highest rate of admissions for non-alcoholic fatty liver disease at 14.2 (9.2-21.0) per 100,000 population, Nottinghamshire had the highest number of admissions with 115 people.
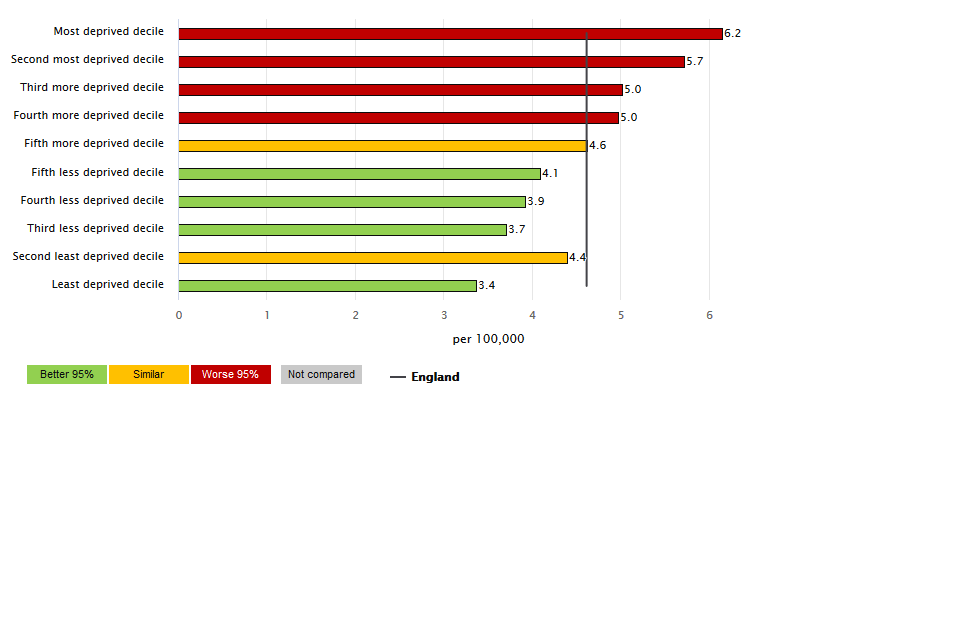
When considering deprivation, the highest rates of admission for non-alcoholic fatty liver disease were seen amongst the lower super output areas in the more deprived groups. This gradient is more pronounced when looking at the 3-year data.
Figure 7: Hospital admission rates for non-alcoholic liver disease, per 100,000 population aged under 75, by IMD 2019 lower super output area deciles in England. (1 year range, 2020/21)
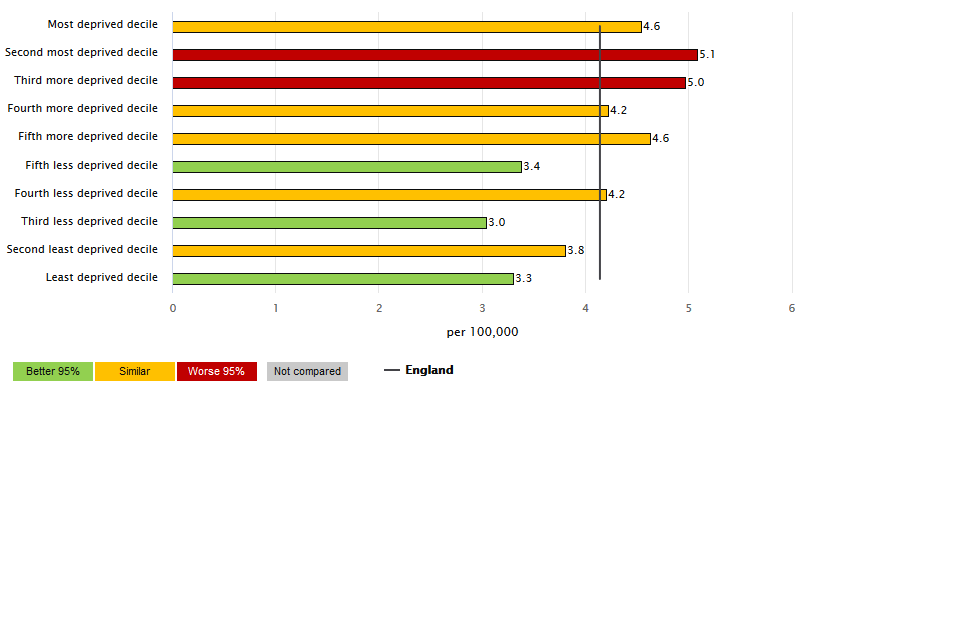
Figure 8: Hospital admission rates for non-alcoholic liver disease, per 100,000 population aged under 75, by IMD 2019 lower super output area deciles in England. (3 year range, 2017/18 to 2019/20)
4. Background and further information
Liver disease is almost entirely preventable with the major risk factors: alcohol, obesity and hepatitis B and C accounting for up to 90% of cases.
The liver disease profiles provide an invaluable resource relating to one of the main causes of premature mortality nationally; a disease whose mortality rates are increasing in England, while decreasing in most EU countries. The local authority profiles will support the development of Joint Strategic Needs Assessments and work of health and wellbeing boards presenting local key statistics and highlighting questions to ask locally about current action to prevent liver disease.
The website contains data for upper tier local authorities, former Government Office regions, England and where available lower tier local authorities.
Further details about the profile methodology are available within the definitions section of the online version of the liver disease profile.
Responsible statistician, product lead: Liz Rolfe, Julia Verne
For queries relating to this document, please contact: liverdisease@phe.gov.uk