Liver disease profiles: November 2021 update
Published 2 November 2021
Applies to England

© Crown copyright 2021
This publication is licensed under the terms of the Open Government Licence v3.0 except where otherwise stated. To view this licence, visit nationalarchives.gov.uk/doc/open-government-licence/version/3 or write to the Information Policy Team, The National Archives, Kew, London TW9 4DU, or email: psi@nationalarchives.gov.uk.
Where we have identified any third party copyright information you will need to obtain permission from the copyright holders concerned.
This publication is available at https://www.gov.uk/government/statistics/liver-disease-profiles-november-2021-update/liver-disease-profiles-november-2021-update
The liver disease profiles have been refreshed and updated.
1. New in this update
1.1 New mortality and vaccination coverage data has been added to the Liver Disease Profile
The liver profile from which this is a summary was developed by the national liver intelligence service at Public Health England, (now the Office for Health Improvement and Disparities). This follows recommendations in March 2014 from the All-Party Parliamentary Hepatology Group (APPHG) inquiry into improving outcomes in liver disease. The APPHG was chaired by the late Sir David Amess.
This update includes new data for 6 indicators in the liver disease profile:
-
mortality from liver disease in persons, males and females aged under 75
-
mortality from alcohol related liver disease in persons, males and females aged under 75
-
mortality from non-alcoholic fatty liver disease (NAFLD) in persons aged under 75
-
mortality from hepatitis B related end-stage liver disease/hepatocellular carcinoma in persons aged under 75
-
mortality from hepatitis C related end-stage liver disease/hepatocellular carcinoma in persons aged under 75
-
percentage of eligible children who received 4 doses of Hepatitis B vaccine at any time by their 2nd birthday
Due to the potential impact of coronavirus (COVID-19) on mortality data, indicators are now being presented in views for both 3-year up to 2017 to 2019 and single-year up to 2020 where numbers allow. The mortality indicators have been recalculated for the new 2021 local authority configurations and back series data has been adjusted to also take into account the changes in cause of death coding software and ICD10 coding making data comparable to the most recent 2020 data.
2. Main findings
This update shows:
-
premature mortality from all major causes of liver disease increased in 2020
-
deprivation remains an influential factor on liver disease mortality with those living in the most deprived areas being more adversely affected
-
during 2020, the rate of premature deaths due to liver disease significantly increased compared to 2019. In 2020, there were 10,127 premature deaths due to liver disease in England, a rate of 20.6 (20.2 to 21.0) per 100,000 population aged under 75 compared with 9,218 deaths and a rate of 18.9 (18.5 to 19.3) per 100,000 population aged under 75 in 2019
-
rates of premature liver disease deaths across local authority areas are generally much higher in males than females, however, in the 7 local authority areas the rate experienced by females is higher than males
-
during 2020, the rate of premature deaths from alcohol related liver disease significantly increased compared to 2019 - in 2020 there were 5,285 deaths, a rate of 10.8 (10.5 to 11.1) per 100,000 population aged under 75 compared to 2019 where there were 4,459 deaths, a rate of 9.1 (8.9 to 9.4) per 100,000 population aged under 75 in 2019
-
during 2020, the rate of premature deaths from non-alcoholic fatty liver disease increased significantly compared to 2019 - in 2020 there were 330 deaths, a rate of 0.64 (0.57 to 0.71) per 100,000 population aged under 75 compared to 2019 where there were 237 deaths, a rate of 0.46 (0.40 to 0.51) per 100,000 population aged under 75 in 2019
-
rates of people dying prematurely from non-alcoholic fatty liver disease during 2017 to 2019 were 4 times higher in the North West region (1.0 per 100,000 population aged under 75) than those experienced in the West Midlands region with the lowest rate (0.25 per 100,000 population aged under 75)
-
during 2020, the rate of premature mortality from Hepatitis B related end-stage liver disease/hepatocellular carcinoma increased (though not significantly) compared to 2019 - in 2020 there were 82 deaths, a rate of 0.16 (0.13 to 0.20) per 100,000 population aged under 75 compared to 2019 where there were 67 deaths, a rate of 0.13 (0.10 to 0.17) per 100,000 population aged under 75 in 2019
-
rates of premature mortality from Hepatitis B related end-stage liver disease/hepatocellular carcinoma are highest amongst the most deprived lower super output areas (based on IMD 2019)
-
during 2020, the rate of premature deaths from hepatitis C related end-stage liver disease or liver cancer has decreased (though not significantly) compared to 2019. In 2020 there were 237 deaths, a rate of 0.46 (0.40 to 0.52) per 100,000 population aged under 75 compared to 2019 where there were 243 deaths, a rate of 0.47 (0.41 to 0.53) per 100,000 population aged under 75 in 2019
-
hepatitis B vaccination coverage went down in the financial year beginning 2020 with just 32 UTLAs with 100% coverage compared to 2019/20 where there was 48
3. Summary
3.1 Premature mortality rate due to liver disease
This indicator has been updated with 2020 single-year data and 2017 to 2019 3-year data for males, females and persons. Data has been refreshed and presents data to the new 2021 local authority configurations. This indicator highlights the premature deaths caused by a largely preventable disease in each lower and upper tier local area.
During 2020, there was a significant increase in the rate of premature deaths due to liver disease compared to 2019. In 2020, there were 10,127 premature deaths due to liver disease in England, a rate of 20.6 (20.2 to 21.0) per 100,000 population aged under 75 compared with 9,218 deaths and a rate of 18.9 (18.5 to 19.3) per 100,000 population aged under 75 in 2019.
Figure 1: Single-year mortality rate due to liver disease, per 100,000 population age under 75, England, from 2001 to 2020
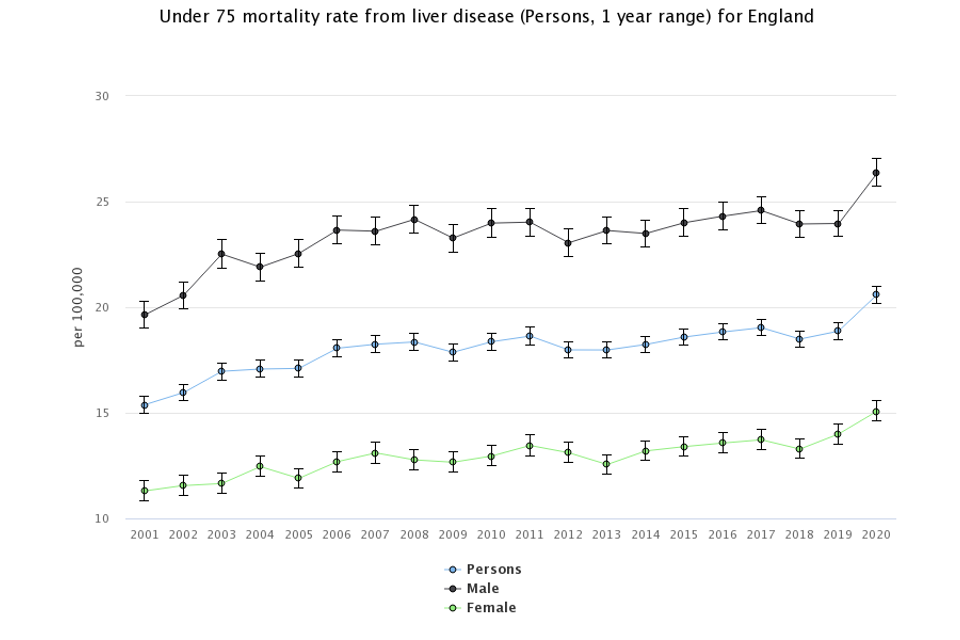
Liver disease continues to claim more lives each year. The 2020 single-year rate for males was 26.4 per 100,000 population aged under 75, for females it was 15.1 both of which have increased significantly since 2019.
In 2020, Blackpool local authority had the highest premature death rates for liver disease (44.9 per 100,000 population aged under 75) in the country for persons. The lowest rate in 2020 was South Norfolk (7.4 per 100,000 population aged under 75).
Birmingham had the largest count of premature deaths from liver disease with 549 deaths in 2017 to 2019. It also had the largest number of deaths in the single-year data for 2020 of 194 (a rate of 24.9 per 100,000 population aged under 75). The median rate across the England LTLAs was 19.4 per 100,000 population aged under 75.
In 2017 to 2019, Harrow local authority showed the widest gap with a 3.7-fold difference between the rate experienced by males (21.1 per 100,000 population aged under 75) compared to females (5.8 per 100,000 population aged under 75). Richmondshire, South Cambridgeshire, Guildford, West Devon, Ribble Valley, Harborough, and Uttlesford local authorities however showed slightly higher rates in females than males.
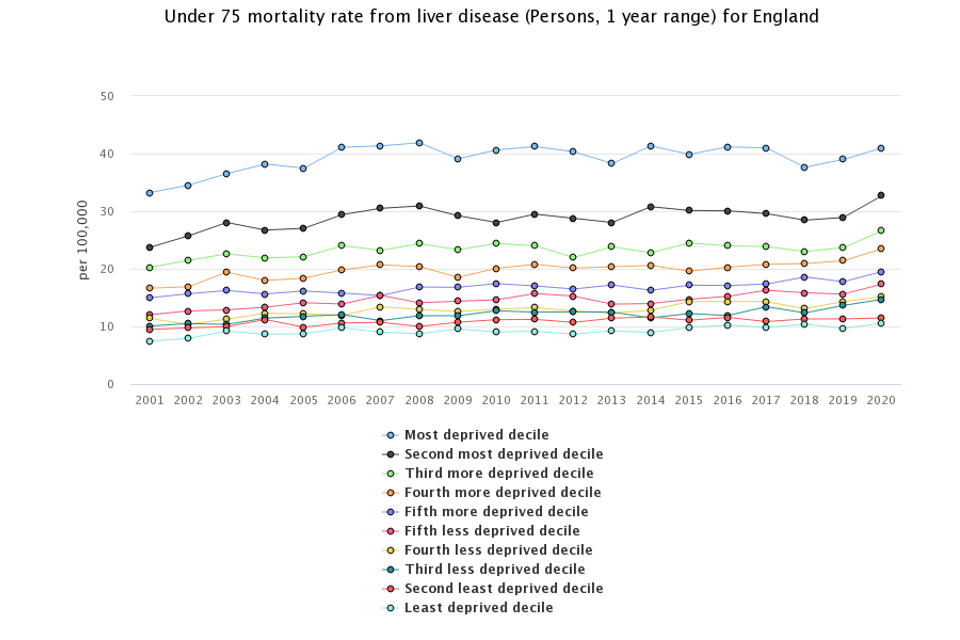
Areas experiencing greater levels deprivation have much higher rates of premature death from liver disease. Those in the most deprived areas have a rate (41.0 per 100,000 people aged under 75) that is almost 4 times higher than the least deprived areas (10.5 per 100,000 people aged under 75). The trend shows that the gap between the least and most deprived groups are not narrowing.
Figure 2: Mortality rate due to liver disease, per 100,000 population aged under 75, by lower super output area deprivation decile 2019, England, 2001 to 2020
3.2 Premature mortality due to alcohol related liver disease
This indicator has been updated and previous data refreshed to present data from the year 2001 to 2003, up to 2017 to 2019 for males, females and persons using the 2021 upper tier local authority configurations. Single year data from 2001 to 2020 is also being presented for persons.
During 2020, the rate of premature deaths from alcohol related liver disease significantly increased compared to 2019. In 2020 there were 5,285 deaths, a rate of 10.8 (10.5 to 11.1) per 100,000 population aged under 75 compared to 2019 where there were 4,459 deaths, a rate of 9.1 (8.9 to 9.4) per 100,000 population aged under 75 in 2019. This represents 826 more deaths in 2020 than in 2019.
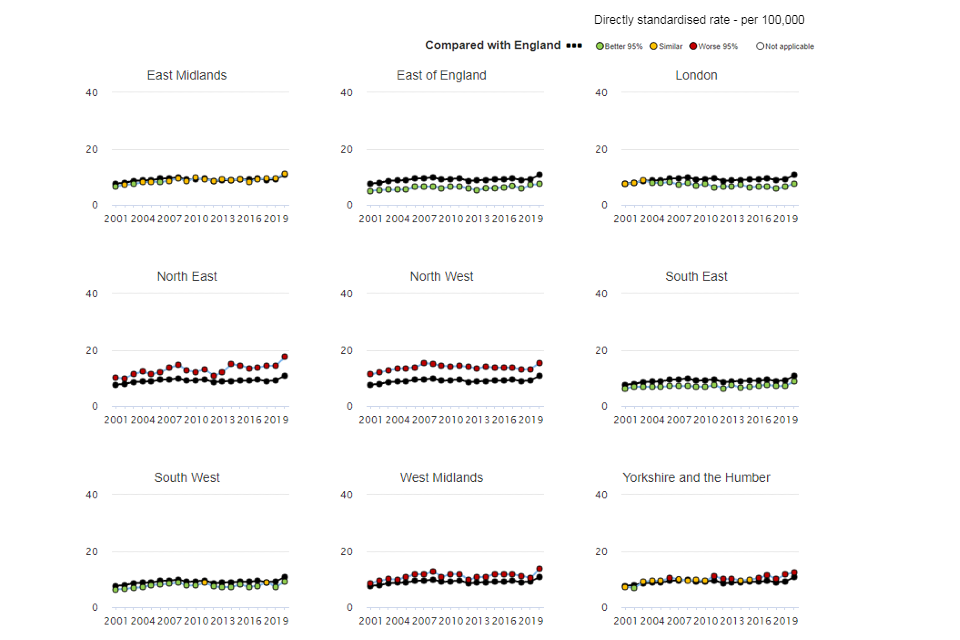
The trend in mortality rates for alcohol related liver disease has been varied over time but all regions saw an increase in deaths in 2020 compared to previous years.
Figure 3: Mortality rate from alcohol related liver disease, per 100,000 population age under 75, by region, England, 2001 to 2020
Rates of premature alcohol related liver disease mortality based on the 3-year data from 2017 to 2019 is significantly higher in males (11.9 per 100,000 population aged under 75) than for females (6.5 per 100,000 population aged under 75).
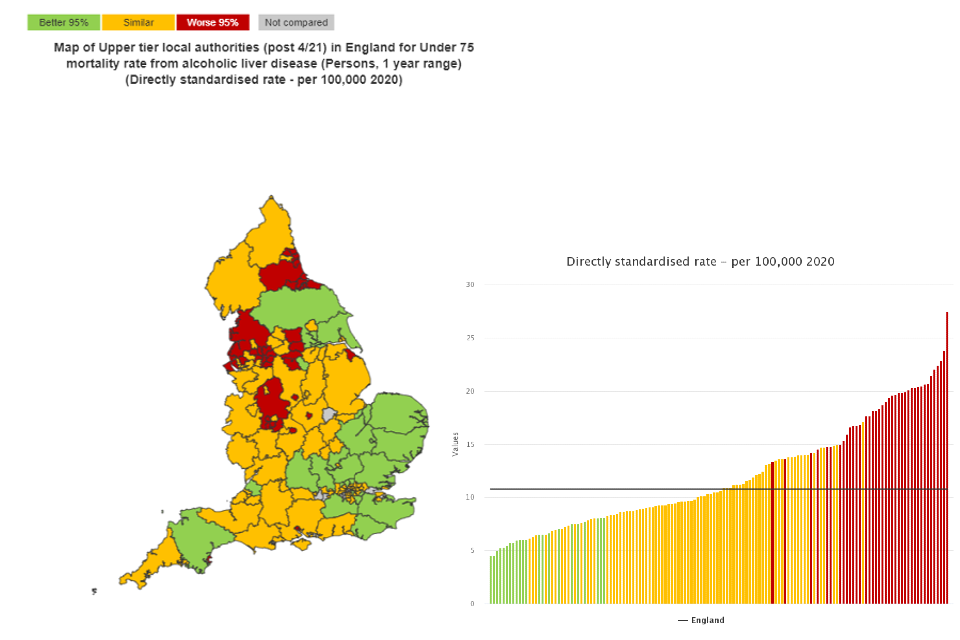
Across the county and unitary authorities, single-year rates in 2020 varied from 4.5 per 100,000 population aged under 75 and a count of 13 in Bromley to a rate of 27.5, a count of 60 in Wolverhampton (figure 4). The rate for Wolverhampton was 1.2 times higher than the next highest rate, of 23.8 per 100,000 population aged under 75, a count of 30 experienced in Blackpool.
Regionally the northern areas tended to have significantly higher rates in England than the southern regions.
Figure 4: Under 75 alcohol related liver disease mortality rate, per 100,000 population, upper tier local authorities, 2020
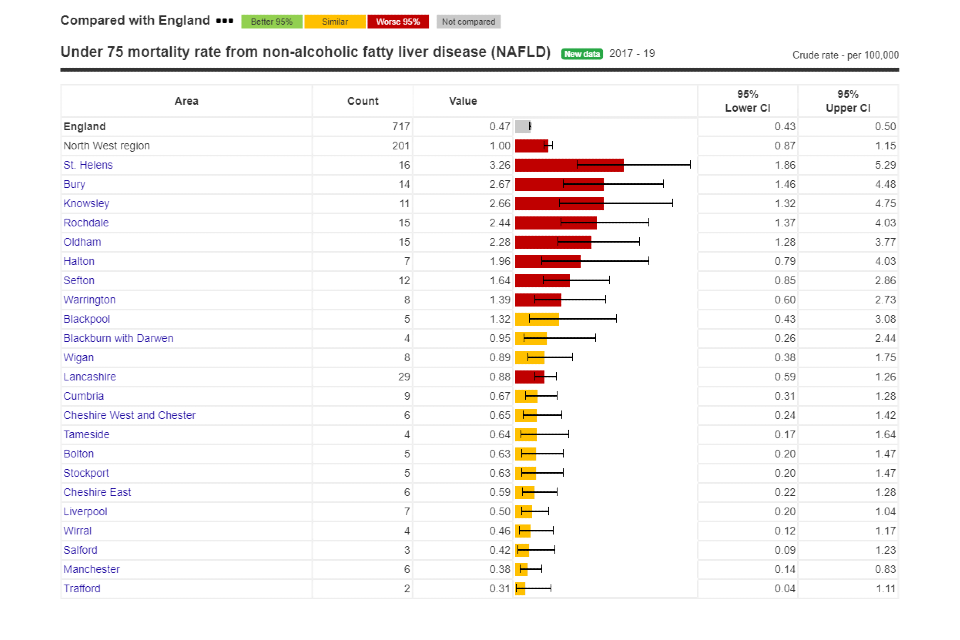
3.3 Premature mortality due to non-alcoholic fatty liver disease
This indicator has been updated with 2020 single-year data at a regional level for persons, and 2017 to 2019 3-year data for persons where the back series of data has been refreshed for the new 2021 local authority configurations.
During 2020, the rate of premature deaths from and non-alcoholic fatty liver disease increased significantly compared to 2019. In 2020 there were 330 deaths, a rate of 0.64 (0.57 to 0.71) per 100,000 population aged under 75 compared to 2019 where there were 237 deaths, a rate of 0.46 (0.40 to 0.51) per 100,000 population aged under 75 in 2019.
3-year rates for 2017 to 2019 were 4 times higher in the North West region (1.0 per 100,000 aged under 75) than the West Midlands (0.25 per 100,000 aged under 75).
Across the upper tier local authority areas during 2017 to 2019, St Helens had the highest rate at 3.26 per 100,000 people aged under 75, Essex had the highest number of deaths at 32.
Figure 5: Under 75 non-alcoholic fatty liver disease mortality rate, per 100,000 population, upper tier local authorities in the North West region, 2017 to 2019
This indicator has been updated with 2020 single-year data at a regional level for persons, and 2017 to 2019 3-year data for persons where the back series of data has been refreshed for the new 2021 local authority configurations.
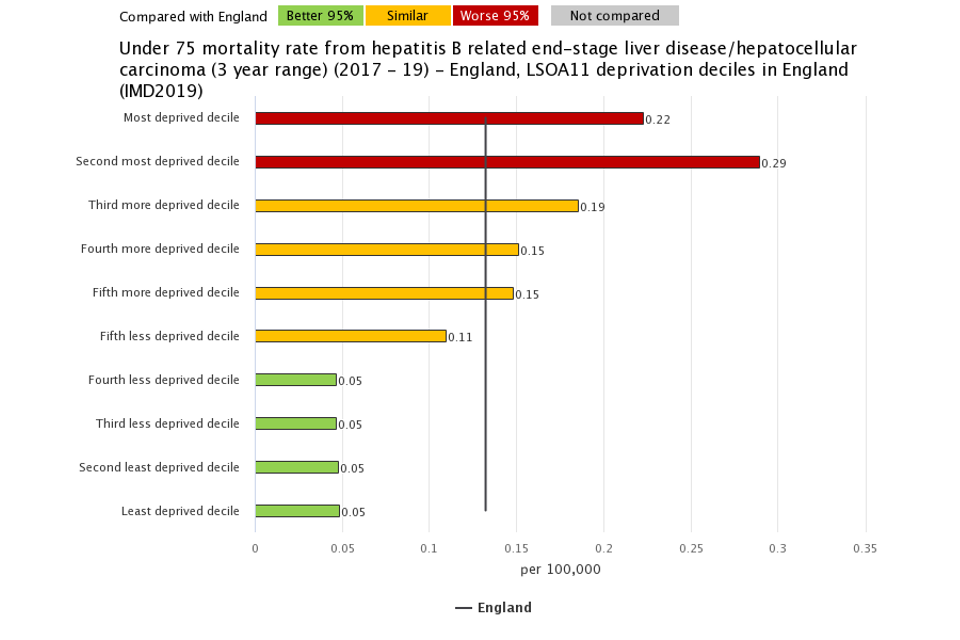
During 2020, the rate of premature mortality from Hepatitis B-related end-stage liver disease/hepatocellular carcinoma increased (though not significantly) compared to 2019. In 2020 there were 82 deaths, a rate of 0.16 (0.13 to 0.20) per 100,000 population aged under 75 compared to 2019 where there were 67 deaths, a rate of 0.13 (0.10 to 0.17) per 100,000 population aged under 75 in 2019.
During the 3-year period from 2017 to 2019, there were 203 premature deaths from hepatitis B-related end-stage liver disease/hepatocellular carcinoma in England, a rate of 0.13 per 100,000 population aged under 75.
Rates of mortality vary across the indices of multiple deprivation (IMD) 2019 LSOA deciles. The most deprived groups experience higher rates of mortality from hepatitis B end-stage liver disease/hepatocellular carcinoma than the less deprived areas.
Figure 6: Hepatitis B related end-stage liver disease/hepatocellular carcinoma disease mortality rate, per 100,000 population aged under 75, 2017 to 2019 by IMD 2019 lower super output area deciles in England.
3.4 Premature mortality from hepatitis C related end-stage liver disease/hepatocellular carcinoma
This indicator has been updated with 2020 single-year data at a regional level for persons, and 2017 to 2019 3-year data for persons where the back series of data has been refreshed for the new 2021 local authority configurations.
About three quarters of people infected with acute hepatitis C develop a chronic condition that can lead to end-stage liver disease or liver cancer. In 2016, the World Health Organization set a target to reduce hepatitis C mortality by 65% by 2030. Since then there has been increased treatment provision with direct-acting antiviral (DAA) drugs now available to patients.
During 2020, rates of premature deaths from hepatitis C related end-stage liver disease or liver cancer has decreased (though not significantly) compared to 2019. In 2020 there were 237 deaths, a rate of 0.46 (0.40 to 0.52) per 100,000 population aged under 75 compared to 2019 where there were 243 deaths, a rate of 0.47 (0.41 to 0.53) per 100,000 population aged under 75 in 2019. Since 2016 the count of deaths (336) have reduced by 29%.
Figure 7: Under 75 mortality rate from hepatitis C related end-stage liver disease/hepatocellular carcinoma, per 100,000 population, England. Box plots show both 3-year and single-year data
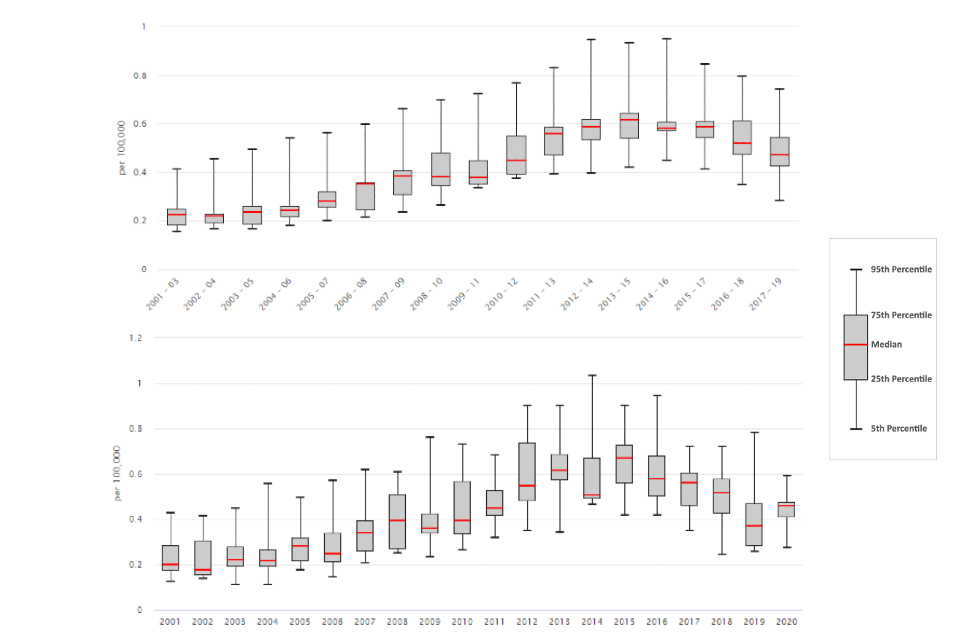
Figure 7 shows the distribution of region values for the 3-year period from 2001 to 2003 up to 2017 to 2019 and also the single-year period from 2001 to 2020. The median of the regional values has been decreasing since 2015 from a rate 0.67 to 0.37 per 100,000 population aged under 75 in 2019. In 2020 however the median increased to a rate of 0.46 per 100,000 population aged under 75.
Overall the North West region has the highest rate of premature mortality from hepatitis C. Across the upper tier local authority areas however, Hammersmith and Fulham had with the highest rate of premature mortality from hepatitis C related end-stage liver disease/hepatocellular carcinoma of 2.3 in 2017 to 2019, and per 100,000 people aged under 75. This is significantly worse than the England average.
3.5 Percentage of eligible children who received 4 doses of Hepatitis B vaccine at any time by their 2nd birthday
This indicator has been updated with data for the financial year beginning 2020 for persons. Data has been refreshed and presented for the new 2021 local authority configurations.
Hepatitis B vaccinations are given to babies born to mothers who are known to have hepatitis B infection as a preventative measure. If a person develops chronic hepatitis B, around a fifth will eventually develop liver cirrhosis and a tenth of these will get liver cancer.
In 2020/21 the median proportion of children aged 24 months who received all 4 doses of the vaccine, was 83%. The most deprived 2019 deprivation decile had vaccination rates much lower than the least deprived deprivation decile, 62.2% and 86.1% respectively. 32 of the 152 upper-tier local authority areas had 100% vaccination coverage. For 34 areas coverage was either 0 or unable to be reported due to missing data or data quality reasons.
4. Background and further information
Liver disease is almost entirely preventable with the major risk factors: alcohol, obesity and hepatitis B and C accounting for up to 90% of cases.
The liver disease profiles provide an invaluable resource relating to one of the main causes of premature mortality nationally; a disease whose mortality rates are increasing in England, while decreasing in most EU countries. The local authority profiles will support the development of Joint Strategic Needs Assessments and work of health and wellbeing boards presenting local key statistics and highlighting questions to ask locally about current action to prevent liver disease.
The website contains data for upper tier local authorities, former Government Office regions, England and where available lower tier local authorities.
Further details about the profile methodology are available within the definitions section of the online version of the liver disease profile.
Responsible statistician, product lead: Liz Rolfe, Julia Verne
For queries relating to this document, please contact: liverdisease@phe.gov.uk