Influenza in the UK, annual epidemiological report: winter 2025 to 2026
Published 28 May 2026

© Crown copyright 2026
This publication is licensed under the terms of the Open Government Licence v3.0 except where otherwise stated. To view this licence, visit nationalarchives.gov.uk/doc/open-government-licence/version/3 or write to the Information Policy Team, The National Archives, Kew, London TW9 4DU, or email: psi@nationalarchives.gov.uk.
Where we have identified any third party copyright information you will need to obtain permission from the copyright holders concerned.
This publication is available at https://www.gov.uk/government/statistics/influenza-in-the-uk-annual-epidemiological-report-winter-2025-to-2026/influenza-in-the-uk-annual-epidemiological-report-winter-2025-to-2026
Main points
The main messages of the 2025 to 2026 season are:
-
the season started in the second half of October 2025 in children and young adults with rising influenza A(H3N2) activity. It peaked around the second week of December (2025) and declined after
-
the 2025 to 2026 season was dominated by influenza A(H3N2) subclade K
-
activity started earlier than in the 2024 to 2025 season but also declined earlier and the overall level of activity over the course of the season was lower
-
mortality estimates were lower than in the 2024 to 2025 season
-
vaccine coverage in adults and children was overall similar to the 2024 to 2025 season
-
overall vaccine effectiveness (VE) in adults was lower than last season at 21 to 34%. In children, VE was 51 to 68%
-
modelling indicated that, in England, the vaccination programme prevented an estimated 104,000 hospital admissions and 7,100 deaths
Disease activity and burden
In the 2025 to 2026 season:
-
across nations, cumulative influenza-like illness consultation rates in primary care were lower during the 2025 to 2026 season than in the 2024 to 2025 season and higher than in the 2023 to 2024 season
-
across nations, cumulative hospitalisation rates for influenza were lower during the 2025 to 2026 season than in the 2024 to 2025 season and higher than in the 2023 to 2024 season
-
in England and Scotland, cumulative intensive care units (ICU) and high dependency units (HDU) admission rates were lower in the 2025 to 2026 season than in the 2024 to 2025 and 2023 to 2024 seasons
-
in England, influenza-attributable excess mortality was estimated at 3,798 deaths, which was lower than in the 2024 to 2025 season (9,740 deaths) and the 2023 to 2024 season (4,431 deaths)
Disease patterns
In the 2025 to 2026 season:
-
overall influenza activity across nations started around weeks 42 and 43 2025 (13 October to 19 October 2025) and peaked across nations around week 50 2025 (week commencing 8 December). Overall influenza activity then declined from the end of December and the beginning of January and returned to baseline levels at varying times depending by surveillance indicator and nation
-
peak activity was lower than in the 2024 to 2025 season, but higher than in the 2023 to 2024 season
-
activity was driven by influenza A(H3N2) - there was minimal influenza A(H1N1)pdm09 and influenza B activity
-
influenza A(H3N2) activity started to increase in October 2025 in younger age groups and peaked across nations in December 2025
Vaccination coverage and impact
In the 2025 to 2026 season:
-
across nations and age groups, influenza vaccine coverage was similar to the 2024 to 2025 season. Coverage across nations ranged from 71 to 75% for adults aged 65 years and above, 37 to 43% for younger adults with clinical risk factors, 45 to 55% for secondary school children, 55 to 67% for primary school children and 30 to 50% for pre-school children
-
estimated VE against primary care influenza attendances ranged from 21% (adults aged 65 years and above) to 52% in children aged 2 to 17 years. Against hospitalisation, VE ranged from 29% in adults aged 65 years and above to 68% in children aged 2 to 17 years
-
the main modelled estimates of vaccine impact indicated that the vaccination programme in England prevented between 86,900 and 125,100 hospital admissions and between 5,800 and 8,900 deaths
Community surveillance
Syndromic surveillance
England
In England, national UKHSA real-time syndromic surveillance systems monitor GP in-hours (GPIH) consultations, GP out-of-hours (GPOOH) contacts, emergency department (ED) attendances and National Health Service (NHS) 111 triaged calls and online assessments.
The clinical coding and patient healthcare-seeking behaviour underpinning these syndromic surveillance systems may change over time. During the 2022 to 2023 season, syndromic surveillance data should be interpreted with some caution due to a ‘group A strep incident’ from week 48 2022. During this incident, national media reports of an increase in severe invasive group A streptococcus (iGAS) disease in children led to changes in healthcare-seeking behaviour across the NHS, particularly in children with iGAS-type symptoms which are likely to have included respiratory presentations of illness, across NHS healthcare services.
NHS 111 triaged calls for acute respiratory infection
During the 2025 to 2026 season, weekly NHS 111 triaged calls for acute respiratory infection (ARI) began to increase from week 45 2025 (week commencing 3 November) and peaked in week 52 2025 (week commencing 22 December). By week 3 2026 (week commencing 12 January) call levels had declined to levels similar to November 2025 before declining further from week 7 2026 (week beginning 9 February). Overall, during the weeks of highest activity in the 2025 to 2026 season (November and December), ARI calls were slightly lower than the same months in the 2024 to 2025 and 2023 to 2024 seasons. During weeks 48 to 50 2025 call levels were similar or slightly higher than the same weeks in previous years. Some caution is needed in interpreting attendances around week 52 and week 1 each year as increased calls noted during those weeks may be explained by less availability of primary care services due to bank holidays.
Figure 1. Weekly NHS 111 triaged calls for ARI by season, England, 2022 to 2026

Emergency department attendances
Syndromic surveillance ED attendance data presented here includes 111 EDs (NHS type 1) that reported data throughout the most recent 4 influenza seasons. ED numbers may differ from those presented in previous annual reports, where a different number of EDs were included.
ED ARI attendances increased gradually from around 9,000 attendances per week at the beginning of October 2025, peaked at slightly over 17,000 in week 49 2025, and stabilised back at around 10,000 weekly attendances from week 2 2026 (week commencing 5 January).
ARI attendances during the period of peak activity (November and December 2025) were largely lower than the same months in the 2024 and 2023. However, ARI attendances in weeks 47 to 49 2025 were higher than the same weeks in previous years.
The ARI syndromic indicator is a composite of respiratory infection diagnoses of which influenza-like illness (ILI) is one subcomponent. Some caution is needed in interpreting ED attendances around week 52 and week 1 each year as attendances may be impacted by healthcare-seeking behaviour during the holiday period and less availability of primary care services during bank holidays.
Figure 2. Weekly ED attendances for ARI by season, England, 2022 to 2026

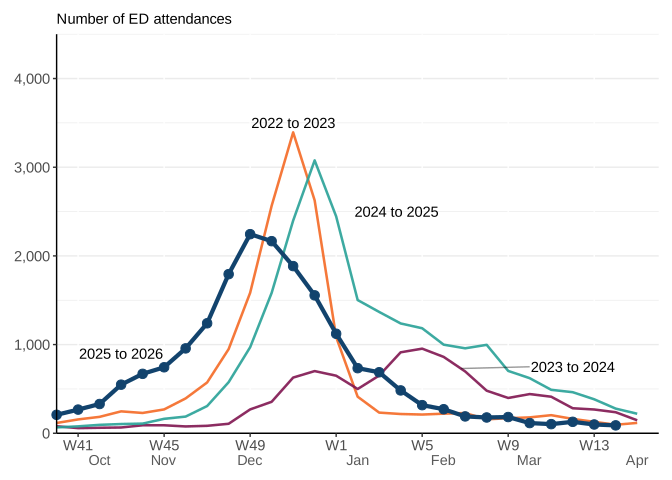
ILI ED attendances increased from week 43 2025 (week commencing 20 October), peaked in week 49 2025 (week commencing 1 December), with an initial decline until week 2 2026 (week commencing 5 January) and with a more gradual decline thereafter.
Overall, in the 2025 to 2026 season, the levels of ED ILI attendances were higher than in the previous 3 seasons until week 50; the peak occurred earlier than each of the 3 previous seasons, however the overall numbers of attendances were lower in 2025 to 2026 compared with the 2024 to 2025 and 2022 to 2023 seasons.
Some caution is needed in interpreting attendances around week 52 and week 1 each year as attendance levels may be impacted by healthcare-seeking behaviour during the holiday period and less availability of primary care services due to the bank holidays.
Figure 3. Weekly ED attendances for ILI by season, England, 2022 to 2026
Scotland
NHS24 is the NHS phone service for Scotland equivalent to 111 in England, providing a 24-hour hotline available to members of the public who require advice about urgent but not life-threatening medical problems. Data from these calls is recorded by call handlers and stored electronically, including information regarding time of call, geographical location, caller demographics, and call reason.
The proportion of NHS24 calls for respiratory symptoms is calculated through identifying calls with the following call reasons: ‘colds and flu’. Call reason is a free-text field, that is screened for key words used to identify syndromes.
During the 2025 to 2026 season, the percentage of calls for cold and flu gradually increased from week 42 2025 (week commencing 13 October 2025) and peaked in week 48 (week commencing 24 November 2025) and gradually declined thereafter.
Figure 4. Weekly percentage of NHS24 calls for cold and flu, Scotland, 2022 to 2026 [note 1]

Note 1: percentages of calls for colds and flu have always been under 1% in the previous 4 seasons.
Acute respiratory infection incidents
England
Information on ARI incidents is based on situations reported to UKHSA health protection teams (HPTs) and entered onto the Case and Incident Management System.
These include confirmed outbreaks of ARI (2 or more laboratory-confirmed cases of SARS-CoV-2, influenza or other respiratory pathogens) linked to a particular setting, as well as situations where an outbreak is suspected. All suspected outbreaks are further investigated by the HPT in liaison with local partners. Respiratory sampling to identify the virus involved is encouraged, however where clinical-epidemiological risk assessment suggests a higher probability of influenza this may not be done, and antiviral prophylaxis started empirically. Incident reports are manually reviewed during the data cleaning process and assigned to a specific pathogen only if confirmation of a positive virological test can be identified.
Reporting practices are known to vary between seasons and between regions. Any interpretation of temporal and regional trends should consider the likelihood of differences in reporting of ARI incidents over time and between regions.
In England, there were a total of 3,866 ARI incidents in closed settings reported between week 40 of 2025 and week 14 of 2026. Virological testing information was available for 2,091 (54.1%) incidents, of which 1,159 (55.4%) were due to influenza, 104 (5.0%) were due to multiple pathogens (at least one of which was influenza) and 828 (39.6%) incidents were due to other pathogens, including SARS-CoV-2 (360) and respiratory syncytial virus (RSV)) (274). In 1,775 (45.9%) incidents, virological testing results were not available.
Of the incidents in which influenza was virologically confirmed, 1,056 (83.6%) were reported from care homes, 98 (7.8%) from educational settings, 84 (6.7%) from hospital settings, 4 (0.3%) from prisons and 21 (1.7%) from other settings (Table 1).
Table 1. Number of incidents by institution and pathogen, England, week 40 2025 to week 14 2026
| Setting | Influenza | Mixed outbreak (with influenza present) | Other pathogens | Not available/tested | Total |
|---|---|---|---|---|---|
| Care Home | 967 | 89 | 680 | 1,454 | 3,190 |
| Educational setting | 91 | 7 | 72 | 284 | 454 |
| Hospital | 77 | 7 | 65 | 8 | 157 |
| Prison | 4 | 0 | 2 | 7 | 13 |
| Other | 20 | 1 | 9 | 22 | 52 |
| Total | 1,159 | 104 | 828 | 1,775 | 3,866 |
The highest number of influenza outbreaks was in week 50 2025. The majority of influenza outbreaks throughout the season occurred in care homes, with influenza outbreaks in educational settings peaking in November and December 2025 (Figure 5).
Figure 5. Number of influenza outbreaks by week and setting, England, 2025 to 2026 [note 2]

Note 2: includes outbreaks of influenza as well as mixed outbreaks where at least one of the pathogens identified was influenza.
The majority of influenza outbreaks were virologically confirmed to be influenza A. A small number of influenza B outbreaks were identified, predominantly in the second half of the season. Of 1,039 outbreaks where an influenza type was identified, 1,031 (99.2%) were influenza A, 2 (0.2%) were influenza B and 6 (0.6%) were multiple influenza types. In the remaining 224 (17.7%) influenza outbreaks, no influenza type was identified (Figure 6).
Figure 6. Number of outbreaks by week and influenza type in all settings, England, 2025 to 2026 [note 2]

Note 2: includes outbreaks of influenza as well as mixed outbreaks where at least one of the pathogens identified was influenza.
Scotland
In Scotland, outbreaks are defined where there are at least 2 cases (laboratory confirmed and/or suspected) of any ARI within 48 hours in any setting. To be defined as an ARI outbreak, either the pathogen or the scenario entered onto HPZone must be clearly indicative of acute respiratory infection as the type of outbreak.
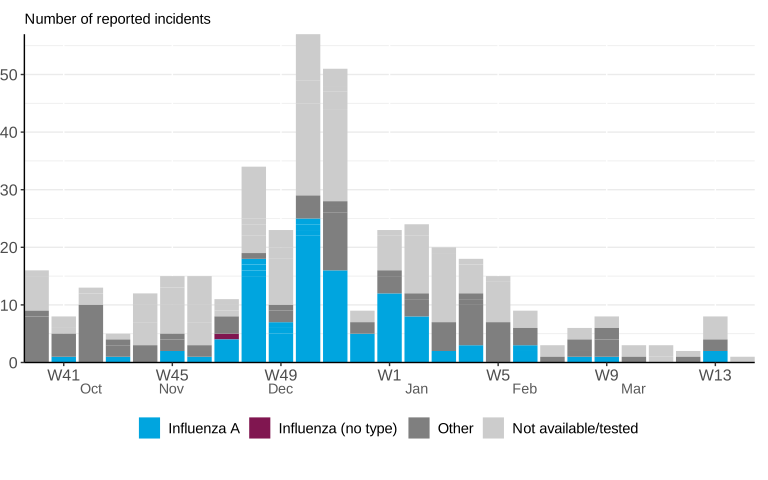
Between week 40 2025 to week 14 2026, a total of 113 influenza outbreaks were reported. 112 of these were confirmed influenza A, 1 was confirmed influenza where no type information was available. Of outbreaks positive for influenza, 100 were reported from care homes. Influenza outbreaks started to increase around week 47 2025 (week commencing 17 November 2025), peaked during weeks 50 2025 (week commencing 8 December 2025) and declined to low weekly amounts (no more than 3 weekly reported outbreaks) from week 3 2026 (week commencing 12 January 2026).
Figure 7. Number of outbreaks by week and influenza type in all settings, Scotland, 2025 to 2026 season
Northern Ireland
Suspected ARI incidents in different settings are notified to the Public Health Agency (PHA) Acute Response Duty Room and recorded in HPZone, a case and incident management system. A confirmed ARI outbreak can be defined as where there are 2 or more laboratory confirmed cases with onset within a 14-day period, where transmission within the same setting is considered the likely cause.
In Northern Ireland, there were a total of 211 confirmed ARI outbreaks reported to the PHA Acute Response Duty Room from week 40, 2025 (week commencing 29 September) to week 14, 2026 (week commencing 30 March). Of these, 112 (53.1%) were reported in hospital settings, 93 (44.1%) in care home settings and 6 (2.8%) in other settings. Of the 211 ARI outbreaks, 116 (55.0%) were confirmed influenza outbreaks of which 111 (95.7%) were Influenza A (not subtyped) and 5 (4.3%) were influenza A(H3N2). Of the 211 ARI outbreaks, 11 (5.2%) were confirmed RSV outbreaks and 84 (39.8%) were confirmed COVID-19 outbreaks.
Figure 8. Number of outbreaks by week and influenza type in all settings, Northern Ireland, 2025 to 2026 season

Wales
In Wales, outbreaks are reported on a different interface (Tarian) from other nations. Therefore some caution is needed when comparing absolute numbers between nations.
There were a total of 148 ARI outbreaks reported between week 40 2025 and week 12 2026. Of these, 137 (92.6%) were reported from residential or care homes, 9 (6.1%) from educational settings, 1 (0.7%) from hospital settings and 1 (0.7%) from a custodial setting. Virological results indicated that 24 outbreaks were due to SARS-CoV-2, 50 were due to influenza A(not subtyped), 8 were influenza type non reported, 6 were due to rhinovirus, 2 were due to RSV, 1 was due to parainfluenza and 20 were mixed outbreaks. In 37 outbreaks no pathogen was identified.
FluSurvey
FluSurvey, run by the UK Health Security Agency (UKHSA), is an internet-based participatory surveillance system similar to the InfluenzaNet platform. It was developed to monitor self-reported respiratory symptoms, social contact patterns and health service use in the UK general population in near-real time through a weekly survey of registered participants.
Individuals aged 18 and over can register on the platform and complete a baseline profile questionnaire and weekly symptoms questionnaires on behalf of themselves or members of their household. Participants are sent weekly email reminders inviting them to report any symptoms that they may have experienced and their healthcare-seeking behaviour as a result of their symptoms. For further details refer to the data quality report.
All 2025 to 2026 season data presented in this report was collected between week 45 2025 and week 14 2026 inclusive. The previous 2024 to 2025 season collected data between reporting weeks 47 2024 to week 14 2025.
A total of 3,894 participants enrolled over the course of the season and completed at least one survey with an average of 2,074 (53.3%) participants contributing each week. Of these 3,894 participants, 3,662 submitted a background survey (69.3% were female and 30.3% were male). Age groups were distributed as follows: 1.4% aged 0 to 17 years, 16.2% aged 18 to 44 years, 43.7% aged 45 to 64 years and 38.7% aged 65 years and above. The majority (3,280, 89.6%) of participants were resident in England, with 122 participants residing in Wales, 224 in Scotland, and 28 in Northern Ireland.
The European Centre for Disease Control (ECDC) ILI case definition of sudden onset of symptoms with at least one of fever (chills), malaise, headache, muscle pain and at least one of cough, sore throat, shortness of breath has been used for reporting. The ILI case definition is derived based on self-reported symptoms and is a broad definition that can include other respiratory illnesses such as COVID-19. The proportion of weekly participants meeting the ILI ECDC case definition peaked in week 50 2025 (week commencing 8 December 2025) at 7.4% compared to the previous season which peaked at 7.6% in week 52 2024 (week commencing 23 December 2024) (Figure 9).
Figure 9. Weekly ILI rates per 1,000 participants and their rate of healthcare use reported through FluSurvey, United Kingdom, 2024 to 2026

Healthcare use is presented as self-reported use of health services among participants meeting the ILI ECDC case definition. Where a person reports use of more than one health care service, secondary care will be indicated over primary care use and physical attendance to primary care will be indicated over use of remote services (for example, online NHS services, telephoning their GP or 111). Among participants who met the ILI ECDC case definition, 15.9% reported contact with health services as a result of their symptoms compared to 16.5% in the previous season. The most frequently reported contact with healthcare services was a visit to the GP in both seasons (Figure 10).
Figure 10. Percentage of participants reporting healthcare use by type among FluSurvey participants meeting the ILI case definition, United Kingdom, 2025 to 2026

SARS-CoV-2 Immunity and Reinfection Evaluation (SIREN) study in healthcare workers
The SIREN study is a prospective cohort study of hospital-based healthcare workers across the UK run by UKHSA. Initially established in 2020 as part of the pandemic response, SIREN focuses on the impact of winter pressures on the NHS workforce.
Participants are invited to rejoin the study each winter season. Information on acute symptoms and healthcare usage is collected fortnightly via an online survey. Participants are invited to report acute symptoms experienced in the previous 14 days and any healthcare attendance resulting from the symptoms experienced.
For the 2025 to 2026 season, data was collected between week 42 2025 (week commencing 13 October) and week 12 2026 (week commencing 16 March), with previous season comparisons including a similar reporting time frame.
A total of 3,824 participants were recruited into the study for the 2025 to 2026 season, with an average fortnightly participation of 3,070 participants (80.0%). Participants were distributed across the UK, with a median age of 55 years, 84.1% were female and 69.5% in clinical roles.
The ECDC case definition for ILI was adapted, and applied to the self-reported symptoms from the fortnightly surveys (at least one of: fever, headache, muscle aches, fatigue and at least one of: cough, sore throat, shortness of breath).
In 2025 to 2026, the proportion of participants reporting ILI peaked in week 52 (week commencing 22 December 2025) at 8.9%. The proportion of participants reporting ILI followed a similar trend each season, however, the proportion was highest and peaked earlier in the season (12.4%, week 50) in 2023 to 2024.
Healthcare use is reported among participants who meet the ILI case definition. Participants could report attending multiple healthcare services (primary care, Accident and Emergency (A&E), hospital admission). Where more than one option was reported, hospital admission was selected over A&E, and A&E selected over primary care, for reporting purposes. During winter 2025 to 2026, 14.6% of participants with ILI reported attending healthcare services, compared to 16.5% in 2024 to 2025. The most frequently attended healthcare service was primary care.
Figure 11. Proportion of SIREN participants reporting ILI symptoms, 2023 to 2026

Figure 12. Proportion of participants reporting healthcare use by type among participants reporting ILI symptoms, 2025 to 2026

Primary care surveillance
Influenza-like-illness consultation rates
England
Weekly rates of GP consultations for ILI through the Royal College of General Practitioners (RCGP) Research and Surveillance Centre (RSC) scheme surpassed the 2025 to 2026 season moving epidemic method (MEM) baseline threshold of 8.32 per 100,000 between week 46 2025 (week commencing 10 November) and week 5 2026 (week commencing 26 January) (Figure 13). You can find out more about the RCGP scheme in our data quality report.
The 2025 to 2026 MEM medium threshold of 16.81 per 100,000 was crossed in week 49 2025. The ILI rate peaked at 27.8 per 100,000 in week 50 2025. The ILI rates were at the MEM medium threshold levels for 3 weeks (Figure 13).
The ILI rate for the 2025 to 2026 season was similar than that observed in the 2024 to 2025 season up to week 38, and higher than that observed in the 2024 to 2025 season between week 39 and week 51. In the 2025 to 2026 season, the ILI rates were above the MEM baseline threshold levels for 12 weeks compared with 14 weeks in the 2024 to 2025 season (Figure 13).
Figure 13. Weekly GP ILI consultation rates per 100,000 from the RCGP RSC network, England, by season [note 3]

Note 3: MEM thresholds are based on data from the 2017 to 2018 season to the 2024 to 2025 season. The 2019 to 2020, 2020 to 2021 and 2021 to 2022 seasons have been removed.
Scotland
Public Health Scotland reports consultation rates for ILI in primary care. Typically, around 96% of all practices in Scotland routinely report to PHS on a weekly basis.
GP ILI consultation rates exceeded the baseline range (9.2 consultations per 100,000 population) initially in week 46 2025 (week commencing 10 November 2025) and peaked in week 51 2025 (week commencing 15 December 2025). After this, consultation rates decreased rapidly and returned to baseline activity levels in week 3 2026 (week commencing 12 January 2026).
The cumulative GP ILI consultation rate for the 2025 to 2026 season (up to week 14) was 282 per 100,000, slightly lower than in the 2024 to 2025 season (295 per 100,000) and higher than the 2023 to 2024 season (181 per 100,000).
Figure 14. Weekly GP ILI consultation rates per 100,000 from GP practices, Scotland, by season

Northern Ireland
PHA reports consultation rates for in-hours influenza or ILI in primary care. Data with approximately 95% coverage of the Northern Ireland population is auto-extracted weekly from the General Practitioner Intelligence Platform (GPIP).
The GP ILI consultation rate exceeded the pre-epidemic threshold for low activity (10.7 per 100,000 population) in week 47, 2025 (week commencing 17 November) and remained above baseline for 10 consecutive weeks, returning to baseline in week 5, 2026 (week commencing 26 January). The peak consultation rate occurred in week 50 2025 (week commencing 8 December), reaching 57.5 per 100,000 population. This peak was earlier and higher compared with the 2024 to 2025 season (week 51 2024; week commencing 16 December; 49.1 per 100,000 population).
Figure 15. Weekly GP ILI consultation rates per 100,000 from sentinel GP practices, Northern Ireland, by season

Wales
Consultation rates for ILI in primary care are calculated using data submitted by sentinel GP practices across Wales, which cover a representative sample of 13% of the population of Wales.
The GP ILI consultation rate crossed the baseline threshold of 9.6 per 100,000 population in week 46 2025 (week commencing 10 November 2025) and initially peaked in week 50 2025 (week commencing 8 December 2025) at 25.1 per 100,000 followed by a subsequent peak in week 2 2026 (week commencing 5 January 2026) at 26.3 per 100,000. The GP ILI consultation rate returned below the baseline threshold in week 4 2026 (week commencing 19 January 2026). The cumulative consultation rate between week 40 and week 14 was 275.5 per 100,000 which was lower than in the 2024 to 2025 season (353.3 per 100,000) and higher than the 2023 to 2024 season (182.0 per 100,000).
Figure 16. Weekly GP ILI consultation rates per 100,000 from sentinel GP practices, Wales, by season

General practice sentinel swabbing
Sentinel GP-based swabbing
England
From week 40 2025, the RCGP sentinel swabbing scheme testing capability has been expanded to the UKHSA Bristol laboratory in addition to the UKHSA Colindale laboratory. Samples sent to Colindale are tested for influenza A and B, RSV A and B, SARS-CoV-2, Human metapneumovirus (hMPV), adenovirus, seasonal coronavirus and enterovirus/rhinovirus while samples sent to Bristol are tested for influenza A and B, RSV and SARS-CoV-2.
Starting from week 40 (week commencing 29 September) 2025, samples with more than 7 days between the sample collection date and the symptom onset date have been excluded.
In England, influenza positivity through the GP sentinel swabbing scheme, in collaboration with the RCGP, was higher up to week 50 compared with the previous season. Positivity began to increase in week 41 (week commencing 6 October) 2025, compared with week 45 (week commencing 3 November) 2024 in the 2024 to 2025 season (Figure 17).
Figure 17. Weekly percentage testing positive for influenza in GP sentinel practices, England, by season

Broader virological testing is depicted in Figure 18. Influenza comprised 36.2% of the total respiratory pathogens detected in the swabbing scheme. For non-flu pathogens detected through the RCGP sentinel swabbing scheme, enterovirus or rhinovirus (these pathogens are tested together) were the second most detected respiratory pathogen (26.0% of total positive specimens).
Figure 18. Weekly number of samples tested for influenza and other respiratory viruses in GP sentinel practices, England, 2025 to 2026 season [note 4]

Note 4: unknown category corresponds to samples with no result yet.
A total of 13,036 samples were tested between week 40 (week commencing 29 September) 2025 and week 14 (week commencing 30 March) 2026, 2,090 samples were positive for influenza. During the same period in the 2024 to 2025 season, a total of 16,030 samples were tested and 2,179 samples were positive for influenza. In the 2025 to 2026 season, influenza A(H3N2) accounted for the majority of positive influenza specimens. Among the positive samples for influenza, 84.9% (1,775 out of 2,090) were positive for influenza A(H3N2), 11.5% (241 out of 2,090) were positive for influenza A(H1N1)pdm09, and 1.1% (24 out of 2,090) were positive for influenza B. Influenza A(H3N2) detections dominated for most of the season (Figure 19).
Figure 19. Percentage of positive tests for influenza and other respiratory viruses in GP sentinel practices, England, 2025 to 2026 season

During the 2025 to 2026 season, influenza positivity was highest in week 48 (week commencing 24 November) 2025 in those aged under 5 years, in week 50 (week commencing 8 December) 2025 in those aged between 5 and 17 years and in week 49 (week commencing 1 December) in those aged 18 years and over. Influenza A(H3N2) positivity rates was predominant for most of the 2025 to 2026 season across all age groups (Figure 20).
Figure 20. Weekly percentage testing positive for influenza by type and age group in England, GP sentinel swabbing, 2025 to 2026 season

Figure 21 shows a proxy for incidence of primary care influenza attendances based on the ARI consultation rate and the influenza positivity. Incidence increased from week 41 2025 and peaked at 177.9 per 100,000 in week 49 2025, this was higher than the 2024 to 2025 peak of 145.6 per 100,000 in week 51 2024. During the 2025 to 2026 season, the cumulative estimated primary care influenza attendance rate was 1411.4 per 100,000 compared with 1493.3 per 100,000 in the 2024 to 2025 season.
Figure 21. Primary care influenza attendances per 100,000 (proxy) in England, GP sentinel swabbing [note 5]

Note 5: this is an experimental metric used as a proxy for the incidence of primary care influenza attendances per 100,000 population. This is a composite indicator calculated using the weekly ARI rate per 100,000 population multiplied by the weekly influenza positivity among the ARI presentations. The ARI rate is calculated within the Royal College of General Practitioners (RCGP) Research and Surveillance Centre (RSC) network of around 2,000 GP practices covering over 20 million registered patients of all ages across England. The influenza positivity is from a subset of the GP practices participate to the virology swabbing surveillance. This approach is described in the World Health Organization (WHO) pandemic influenza severity assessment (PISA) framework.
Scotland
Community Acute Respiratory Infection (CARI) surveillance is a sentinel community surveillance programme for a range of respiratory pathogens: SARS-CoV-2, influenza A and B, RSV, adenovirus, coronavirus (non-SARS CoV-2), human metapneumovirus, rhinovirus, parainfluenza and Mycoplasma pneumoniae. The programme is open to GP practices across all NHS Boards in Scotland. To become a sentinel site, GP practices voluntarily opt into the CARI programme. The number of participating practices was stable over the season at 121, although the number of practices returning swabs each week can vary.
Patients in the community who consult a sentinel GP practice who have at least 1 of 4 respiratory symptoms (cough, sore throat, shortness of breath or coryza) are tested after consent.
In the 2025 to 2026 season, the percentage of positive tests for influenza increased in week 45 2025 (week commencing 3 November 2025) and peaked in week 48 2025 (week commencing 24 November 2025) at 44%. After the peak, influenza positivity gradually decreased throughout the remainder of the season. In the 2025 to 2026 season, the peak positivity was several weeks earlier than the previous 2 seasons and was lower than the 2024 to 2025 season (52%).
Figure 22. Weekly percentage of tests positive for influenza through CARI, Scotland, by season

Figure 23 shows the total counts of positive tests for all tested pathogens. Between week 40 2025 and week 14 2026, the most frequently detected non-influenza viruses were rhinovirus (2,582 samples positive), RSV (941 samples positive) and seasonal coronaviruses (800 samples positive). The supplementary data file has more details, particularly for pathogens (Mycoplasma pneumoniae, adenovirus, hMPV and SARS-CoV-2) grouped in the ‘other’ category in figure 23.
Figure 23. Weekly positive test counts for all tested pathogens through CARI, Scotland, 2025 to 2026 season

Northern Ireland
Community sentinel GP practices cover approximately 15% of the population of Northern Ireland. The programme tests for influenza A and B, RSV and SARS-CoV-2 through the opportunistic swabbing of patients who provide consent, and who attend (in person) with ILI, ARI or suspected COVID-19 symptoms. All testing is undertaken at the Regional Virus Laboratory (RVL).
1,093 influenza swabs were received from week 40, 2025 (week commencing 29 September) to week 14, 2026 (week commencing 30 March) of which 415 were positive (38.0% positivity). Among the positive samples for influenza, 4.3% (18 out of 415) were influenza A(H1), 92.3% (383 out of 415) were influenza A(H3N2), 1.2% (5 out of 415) were influenza A(not subtyped) and 2.2% (9 out of 415) were influenza B. The highest number of positive influenza samples were in week 51, 2025 (week commencing 15 December) (53.4%; 70 out of 131). 1,095 RSV swabs were received from week 40, 2025 (week commencing 29 September) to week 14, 2026 (week commencing 30 March) of which 47 were positive (4.3% positivity). The highest number of positive RSV samples were in week 51, 2025 (week commencing 15 December) (6.1%; 8 out of 131). 1,018 SARS-CoV-2 swabs were received from week 40, 2025 (week commencing 29 September) to week 14, 2026 (week commencing 30 March) of which 28 were positive (2.8% positivity). The highest number of positive SARS-CoV-2 samples were in week 51, 2025 (week commencing 15 December) (3.9%; 4 out of 102).
Figure 24. Weekly number of samples testing positive for influenza, RSV and SARS-CoV-2, GP sentinel practices, Northern Ireland, 2025 to 2026 season

Wales
Between week 40 2025 (week commencing 29 September 2025) and week 14 (week commencing 30 March 2026), influenza cases via GP sentinel swabbing increased from week 43 (week commencing 20 October 2025), predominantly due to influenza A(H3N2) activity. Influenza positivity peaked in week 49 2025 (week commencing 1 December 2025) at 35.3% and then declined rapidly to week 3 2026 (week commencing 12 January 2026) at 6.4%, and continued to decline for the remainder of the season. Between week 40 2025 and week 14 2026, 864 cases of influenza were detected.
Among the other viruses tested between 40 2025 and week 14 2026, the most detections were rhinovirus (953 samples positive), RSV (283 samples positive) and parainfluenza (239 samples positive). Figure 25 groups pathogens detected less frequently together. Refer to the supplementary data file for full details of results.
Figure 25. Weekly test counts for all tested pathogens through GP sentinel practices, Wales, 2025 to 2026 season

Secondary care surveillance
Influenza hospital admissions
England
Surveillance of influenza admissions to Intensive Care Units (ICU) and High-Dependence Units (HDU) is based on mandatory reporting by NHS acute trusts in England. Surveillance of influenza hospitalisations to all levels of care (inclusive of ICU and HDU) is based on data from a small sentinel network of acute NHS trusts in England. Trusts submit weekly aggregate data on new influenza admissions and these are summed and converted to rates per 100,000 by linking to catchment populations of participating trusts in that week. Refer to the data quality report for additional details on data collection and calculation of admission rates. All 2025 to 2026 season data presented in this report was collected between week 40 2025 (commencing 29 September) and week 14 2026 (ending 5 April) inclusive, with comparisons to previous seasons for the same respective weeks (week 40 to week 14 in the following year). Due to retrospective updates by reporters, historical data included in this report may differ slightly since the last annual report.
Influenza hospital admissions (SARI Watch sentinel surveillance)
As a sentinel surveillance system, the number of trusts volunteering to participate may vary between seasons. Therefore, rates of hospitalised influenza cases are presented here to compare between different seasons.
Overall activity
A total of 13,048 test confirmed influenza hospital admissions were reported by 28 participating trusts in the 27-week period. Of 28 trusts, 26 were regular reporters participating in 20 weeks or more.
Cumulative rates presented are based on a sum of weekly rates which take into account only trusts participating in that week. The cumulative admission rate was 100.1 per 100,000 trust catchment population. This was lower than the cumulative admission rate of 140.0 per 100,000 in the 2024 to 2025 season. The unusually early and intense start to influenza hospitalisation activity in 2025 to 2026 draws parallels to the 2022 to 2023 season. Specifically, the 2022 to 2023 season was characterised by a sharp increase and had the highest peak weekly admission rate since the end of the COVID-19 pandemic. The cumulative admission rate in 2022 to 2023 was slightly lower at 94.2 per 100,000 compared with the cumulative admission rate in 2025 to 2026.
Summary of epidemic activity
The overall weekly influenza hospital admission rate exceeded the baseline MEM threshold in week 42 2025. By comparison, in the 2024 to 2025 season the rate breached the baseline threshold in week 48 2024.
The overall rate peaked at 10.79 per 100,000 in week 49 2025 within the medium impact range. This peak was lower than the peak in the 2024 to 2025 season (16.18 per 100,000). By week 6 2026, the epidemic returned to baseline levels marking a period of 16 weeks above baseline impact activity (Figure 26). This compares with 18 weeks above baseline impact activity in the 2024 and 2025 season. Further comparisons to previous seasons are presented in Figure 26.
Figure 26. Weekly influenza hospital admission rates per 100,000 trust catchment population with MEM thresholds, reported through SARI Watch sentinel surveillance, England

The overall cumulative admission rate was highest in those aged 85 and above, with the weekly admission rate peaking at 67.59 per 100,000 in week 50 2025 for that age group (Figure 27).
Figure 27. Weekly hospital admission rate by age group for new influenza cases, reported through SARI Watch sentinel surveillance, England [note 6]

Note 6: the green line corresponds to the most recent 2025 to 2026 season, the grey line corresponds to the previous 2024 to 2025 season.
Influenza hospital admissions by type and subtype
Of the 13,048 influenza hospital admissions reported, 12,899 (98.9%) were influenza A and 149 (1.1%) were influenza B.
Influenza A hospital admissions peaked in week 49 2025. A large proportion 89.2% (11,500 out of 12,899) of influenza A cases were reported as influenza A (subtype unknown). For comparison, the proportion of influenza A (subtype unknown) cases was similar in the 2024 to 2025 season at 88.0% (12,134 out of 13,785).
Among influenza A admissions with subtyping information, there were 1,292 (92.4%) influenza A(H3N2) cases and 107 (7.6%) influenza A(H1N1)pdm09.
The number of influenza B cases was low throughout the 2025 to 2026 season, unlike previous seasons where influenza B activity was observed to increase after January. Influenza type and subtype proportions by age group are presented in Figure 28.
Figure 28. Proportion of influenza hospital admissions by influenza type and age group, reported through SARI Watch sentinel surveillance, England (week 40 2025 to week 14 2026)

Scotland
Influenza admissions are captured from Rapid Preliminary Inpatient Data (RAPID), which consists of daily submissions of inpatient hospital admissions in Scotland. Influenza admissions are defined as patients with an emergency admission (excluding surgical, mental health specialties, or emergency admissions with diagnostic codes related to injuries), who have a positive influenza test results within 14 days before and 2 days after admission.
In the 2025 to 2026 season, admission rates started to increase in week 44 2025 (week commencing 27 October 2025) and peaked in week 49 2025 (week commencing 1 December 2025) at 1,050 admissions (19 per 100,000 population) and declined thereafter (Figure 29). Cumulative rates were lower than the 2024 to 2025 season and higher than 2023 to 2024 season.
Figure 29. Weekly influenza hospitalisation rates through RAPID by season, Scotland, 2023 to 2026

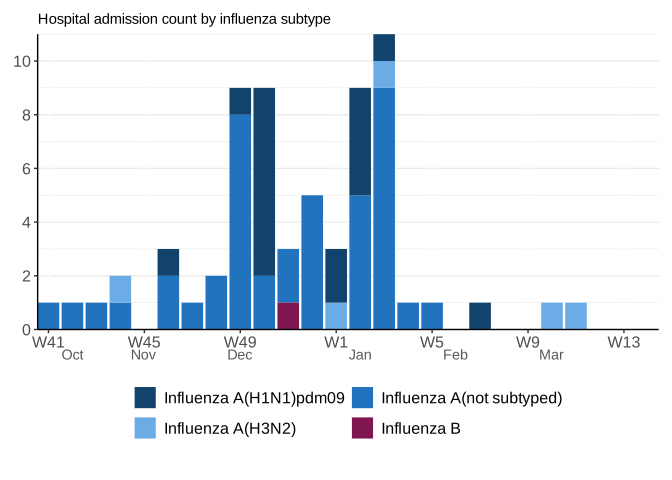
Figure 30 shows the number of hospital admissions by influenza subtype. Peak activity was attributable to influenza A. In samples which had full sequencing results, the majority were influenza A(H3N2).
Figure 30. Weekly influenza hospitalisation counts by influenza subtype, Scotland, 2025 to 2026

Northern Ireland
Community-acquired influenza emergency admissions to acute hospitals are estimated by combining data from the Patient Administration System (PAS), EPIC and virological reports in NIHAP. Admissions are counted where there was a positive test up to 7 days before admission or up to one day after admission, and the method of admission was ‘Emergency’. Admissions refer to the first admission per infection episode. All trusts in Northern Ireland contribute to this data collection.
Influenza admission activity increased from week 43, 2025 (week commencing 20 October) showing a single peak in week 49 2025 (week commencing 1 December) at 18.1 per 100,000 population before declining to low levels, reaching 1.3 per 100,000 population in week 5 2026 (week commencing 26 January). There was a total of 2,446 emergency influenza admissions, with a cumulative admission rate of 126.9 per 100,000 population.
Figure 31. Weekly influenza hospital admission rate by season, Northern Ireland, 2023 to 2026

Overall, 55 emergency admissions were influenza A(H1N1), 598 were influenza A(H3N2), 1,766 were influenza A (not subtyped) and 27 were influenza B. The majority of influenza A emergency admissions was reported in those aged 75 years and older (32.6%; 789 out of 2,419). The number of influenza B emergency admissions remained very low throughout the season with adolescents and young adults (those aged 15 to 44 years) being the age group most represented in influenza B admissions (33.3%; 9 out of 27).
Figure 32. Weekly number of influenza admissions by subtype, Northern Ireland, 2025 to 2026 season

Wales
Hospitalised influenza cases in Wales are identified by linking hospital admissions recorded in the Wales Patient Administration Systems (PAS) to laboratory test results using patient NHS number. Cases are defined as those admitted to hospital who tested positive for influenza within 28 days prior to admission or up to day 2 of an inpatient stay (where admission date is day 1).
A total of 1,720 hospitalised influenza cases were reported in Wales from week 40 2025 (week commencing 29 September 2025) to week 14 2026 (week commencing 30 March 2026). Hospital admissions increased slightly in week 43 2025 (week commencing 11 November), followed by a rapid increase in week 48 2025 where admissions remained elevated for several weeks and peaked at 190 admissions in week 51 2025 (week commencing 15 December 2025). This was followed by a gradual decline remaining at low levels from week 7 2026 onwards (week commencing 9 February 2026).
Figure 33. Weekly influenza hospital admission counts, Wales, 2023 to 2026

Influenza ICU or HDU admissions
England
Influenza ICU and HDU admissions (SARI Watch mandatory surveillance)
Overall activity
A total of 1,617 test confirmed influenza ICU and HDU admissions were reported by 116 participating trusts in the 27-week period. Of 116 trusts, 104 were regular reporters participating in 19 weeks or more.
Cumulative rates presented are based on a sum of weekly rates which take into account only trusts participating in that week. The cumulative admission rate was 3.3 per 100,000 trust catchment population. This was lower than the cumulative admission rate of 4.1 per 100,000 in the 2024 to 2025 season. The unusually early and intense start to influenza ICU and HDU activity in 2025 to 2026 draws parallels to the 2022 to 2023 season. Specifically, the 2022 to 2023 season recorded the highest peak weekly admission rate since the end of the COVID-19 pandemic. The cumulative admission rate in 2022 to 2023 was slightly higher at 3.8 per 100,000 compared with the cumulative admission rate in 2025 to 2026.
Summary of epidemic activity
The overall weekly influenza ICU and HDU admission rate exceeded the baseline MEM threshold in week 44 2025. By comparison, in the 2024 to 2025 season the rate breached the baseline threshold in week 49 2024.
The overall rate peaked at 0.33 per 100,000 in week 50 2025 within the medium impact range. This peak was lower than the peak in the 2024 to 2025 season (0.54 per 100,000). By week 6 2026, the epidemic returned to baseline levels marking a period of 14 weeks above baseline impact activity (Figure 34). This compares with 13 weeks above baseline impact activity in the 2024 and 2025 season. Further comparisons to previous seasons are presented in Figure 34.
The overall cumulative admission rate was highest in those aged between 65 to 74 years, with the weekly admission rate peaking at 0.87 per 100,000 in week 51 2025 (Figure 35) for that age group. Although the overall cumulative rate was slightly lower for those aged between 75 and 84 years, the weekly admission rate peaked at 0.90 per 100,000 in week 50 2025.
Figure 34. Weekly influenza ICU and HDU admission rate per 100,000 trust catchment population with MEM thresholds, reported through SARI Watch mandatory surveillance, England

Figure 35. Weekly ICU and HDU admission rate by age group for new influenza cases, reported through SARI Watch mandatory surveillance, England [note 6]

Note 6: the green line corresponds to the most recent 2025 to 2026 season, the grey line corresponds to the previous 2024 to 2025 season.
Influenza ICU and HDU admissions by type and subtype
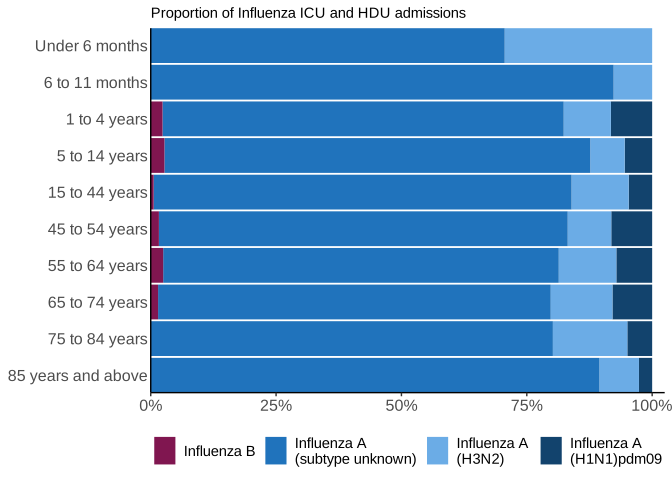
Of the 1,617 influenza ICU and HDU admissions reported, 1,595 (98.6%) were influenza A and 22 (1.4%) were influenza B.
Influenza A ICU and HDU admissions peaked in week 50 2025. A large proportion (81.9%; (1,306 out of 1,595) of influenza A cases were reported as influenza A (subtype unknown). For comparison, the proportion of influenza A (subtype unknown) cases was similar in the 2024 to 2025 season at 82.8% (1,452 out of 1,753).
Among influenza A admissions with subtyping information, there were 186 (64.4%) influenza A(H3N2) cases and 103 (35.6%) influenza A(H1N1)pdm09.
The number of influenza B cases was low throughout the 2025 to 2026 season, accounting for 1.4% of total influenza cases compared to 11.7% in 2024 to 2025. Influenza type and subtype proportions by age group are presented in Figure 36.
Figure 36. Proportion of influenza ICU and HDU admissions by influenza type and age group, reported through SARI Watch mandatory surveillance, England (week 40 2025 to week 14 2026)
Scotland
Patients admitted to ICU and HDU with recently confirmed influenza are identified from the Scottish Intensive Care Society Audit Group (SICSAG) that collects detailed patient level data on all patients in ICU/HDU across Scotland. All patients that are admitted to ICU/HDU with a positive influenza test result within a period of 14 days before the ICU and HDU admission and the ICU and HDU discharge date are included. Where the discharge date is missing, any patient with a positive influenza test result within a period of 14 days before ICU/HDU admission and 7 days after ICU and HDU admission are included.
Influenza ICU admissions began rising in late October 2025 and peaked in week 49 (week commencing 1 December 2025) at 52 admissions and declined thereafter. Between week 40 2025 (week commencing 29 September 2025) until week 12 2026 (week commencing 16 March 2026), a total of 318 ICU admissions were reported. 253 were influenza A without a known subtype, 56 were Influenza A(H3N2), 8 were influenza A(H1N1)pdm09 and 1 was influenza B.
Total admissions during the same period (week 40 to week 12) were lower than in the 2024 to 2025 season (422 admissions) and higher than the 2023 to 2024 season (226 admissions).
Figure 37. Weekly influenza ICU admission through SICSAG by subtype, Scotland, 2025 to 2026

Wales
Data from Wales is for patients swabbed and testing positive for influenza whilst in ICU settings, as indicated by the test location code in the all-Wales laboratory test database (Datastore). The number of individuals with influenza admitted to ICU is likely to be higher as some individuals may not have been tested, or may have been tested outside of ICU before or after being transferred.
Between week 40 2025 (week commencing 29 September 2025) to week 14 2026 (week commencing 30 March 2026), 62 influenza ICU admissions were reported in Wales, 61 were influenza A and one was influenza B. Among 20 admissions where subtyping information was available, 15 were positive for influenza A(H1N1)pdm09, 4 were positive for influenza A(H3N2), and one was positive for influenza B.
Figure 38. ICU admissions reported by influenza subtype, Wales
ECMO admissions, UK
UKHSA collects data on adult patients admitted to severe respiratory failure (SRF) centres for extra corporeal membrane oxygenation (ECMO) or other advanced respiratory support. Data is based on reporting by 8 SRF centres in the UK (7 in England and 1 in Scotland) to the UKHSA ECMO surveillance module. Surveillance is all year round. Refer to the data quality report for details on data collection. Due to retrospective updates by reporters since the last annual report, the data includes a small number of additions.
Between week 40 2025 (commencing 29 September) and week 14 2026 (ending 5 April), there were 140 admissions to SRF centres requiring ECMO in the UK (Figure 39). Of these, test confirmed ARI accounted for 47.1% (66 out of 140), suspected ARI (where causative pathogen remained undetermined) accounted for 6.4% (9 out of 140), non-infection causes accounted for 44.3% (62 out of 140) and sepsis of non-respiratory origin accounted for 2.1% (3 out of 140).
Of 66 test confirmed ARI ECMO admissions in the 2025 to 2026 season (week 40 2025 to week 14 2026), 37.9% (25 out of 66) were for influenza (4 influenza A (subtype unknown), 15 influenza A(H3N2), 6 influenza A(H1N1)pdm09 and 0 influenza B cases). In this period, there were no COVID-19 or RSV ARI admissions.
In the previous season (week 40 2024 to week 14 2025), there were 179 admissions to SRF centres requiring ECMO in the UK. Of these, test confirmed ARI accounted for 53.1% (95 out of 179), suspected ARI accounted for 5.6% (10 out of 179), non-infection causes accounted for 35.8% (64 out of 179) and sepsis of non-respiratory origin accounted for 5.6% (10 out of 179).
Of 95 test confirmed ARI cases, there were 59 admissions for influenza (22 influenza A (subtype unknown), 9 influenza A(H3N2), 17 influenza A(H1N1)pdm09 and 11 influenza B cases). There were 1 COVID-19 and 2 RSV ARI admissions in 2024 to 2025.
As ECMO surveillance operates all year round, the figure below shows all cause admissions over one year from week 15 2025 (commencing 7 April) to week 14 2026 inclusive.
Figure 39. Weekly all cause ECMO admissions in adults to SRF centres in the UK, inclusive of admissions for test confirmed influenza, COVID-19 and RSV ARI [note 7]

Note 7: the other group includes other viral, bacterial or fungal ARI, suspected ARI, non-infection (such as asthma, primary cardiac and trauma) and sepsis of non-respiratory origin.
Laboratory surveillance
Second Generation Surveillance System, England
The Second Generation Surveillance System (SGSS) captures test result information for notifiable infectious diseases, including influenza, from laboratories in England. In this section, positivity rate, or the percentage testing positive, is presented as a 7-day rolling positivity rate, with the number of individuals testing positive for influenza during the preceding 7 days divided by the number of individuals tested overall during the preceding 7 days through PCR testing. Test records are deduplicated using patient identifiers, such that each record indicates how many tests are attributed to an individual each day and how many of these tests were positive. Further details can be found in the data quality report.
In the 2025 to 2026 season, influenza positivity rates began to increase in mid-September and accelerated rapidly by the end of September, doubling from 2.3% on 28 September 2025 to 5.5% on 12 October 2025. This increase in influenza activity occurred earlier this season compared with previous seasons, when doubling would typically be seen in November.
The influenza positivity rate peaked on 7 December 2025 at 21.8%, though there was an early spike in positivity in November at 11.5%. This subsequent small decrease is likely explained by changing testing patterns during the November half-term.
Influenza positivity decreased gradually and consistently from the December peak for the remainder of the season, following a similar pattern to the 2024 to 2025 season (Figure 40).
Figure 40. Rolling 7-day positivity of tests positive for Influenza among all reported influenza tests, England 2022 to present, England [note 8]
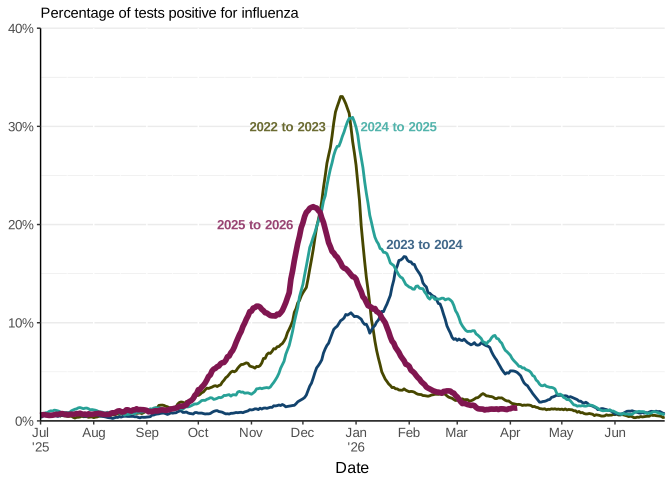
Note 8: data from previous seasons is aligned by day.
When categorised by age (Figure 41), all age groups peaked in December 2025. Positivity was highest amongst those aged between 5 to 14 years, peaking at 47.4% on 2 December 2025. Notably, this age group saw a sharp increase in early autumn, with positivity rates triple those in the other age groups by November 2025.
Positivity among this age group remained high until mid-December 2025 before falling sharply compared with other age groups. A second, smaller spike in activity appeared only in this age group in mid to late January, peaking at 18.3% on 18 January 2026. This second spike was possibly explained by increased mixing following the Christmas break.
Positivity rates were also higher among those aged between 15 and 24 years compared with other age groups, peaking at 40.8%, though positivity increased gradually up to mid-December, in line with most other age groups and the overall influenza trend.
Among infants aged between 0 to 4 years, positivity increased sharply in early autumn but remained stable from November to January, at around 20% before gradually decreasing for the rest of the season (Figure 41).
Figure 41. Rolling 7-day positivity of tests positive for influenza among all reported influenza tests by age group, England [note 9]
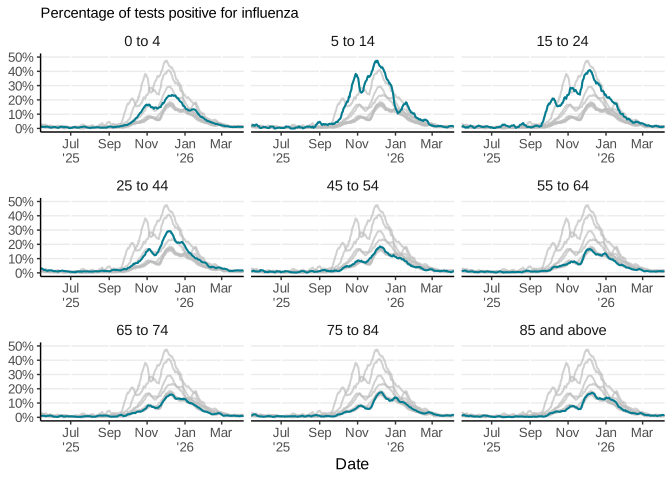
Note 9: the highlighted line corresponds to the age group in the subplot title, grey lines correspond to all other age groups.
Respiratory Datamart, England
Influenza
The Respiratory Datamart system began during the 2009 influenza pandemic to collate all laboratory testing information in England. It is now used as a sentinel laboratory surveillance tool, monitoring all major respiratory viruses in England. 14 laboratories in England, including 5 public health laboratories, 8 NHS hospital laboratories and a UKHSA national laboratory, reported data for this season. The majority of samples were received from hospitals.
Overall influenza positivity was above 5% between week 43 of 2025 (week commencing 20 October 2025) and week 4 of 2026 (week commencing 19 January 2026). Peak positivity (21.4%) below that seen in the 2024 to 2025 season (26.7%) which was comparable to the 25.3% peak in 2019 to 2020 and 28.6% peak in 2018 to 2019 season (Figure 45), noting that these seasons were before the circulation of SARS-CoV-2 and introduction of COVID-19 testing.
The majority of detections were Influenza A. Of the detected influenza A viruses that were subtyped, the majority were Influenza A (H3N2).
Figure 42. Weekly percentage of tests positive for influenza, Respiratory Datamart sentinel laboratories, England, by season
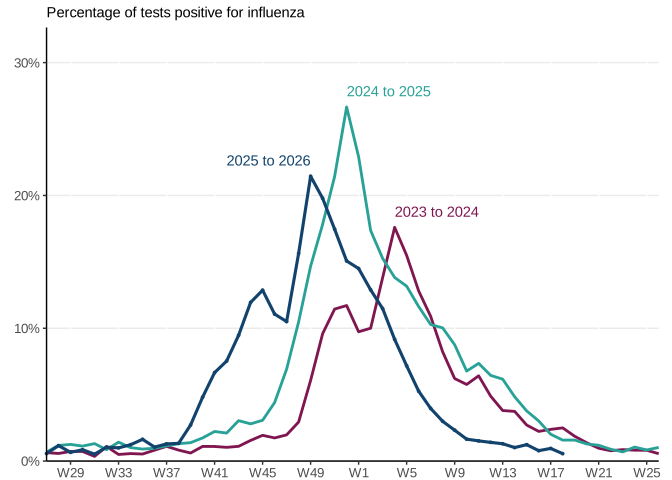
Figure 43. Weekly percentage of tests positive for influenza by age and influenza type, Respiratory Datamart sentinel laboratories, England, 2025 to 2026 season
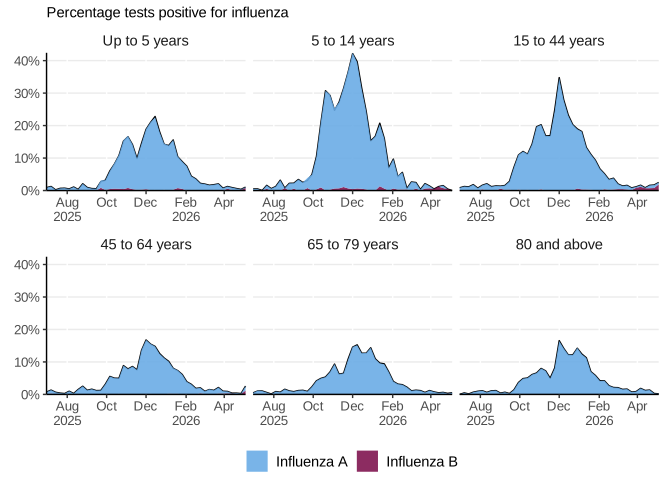
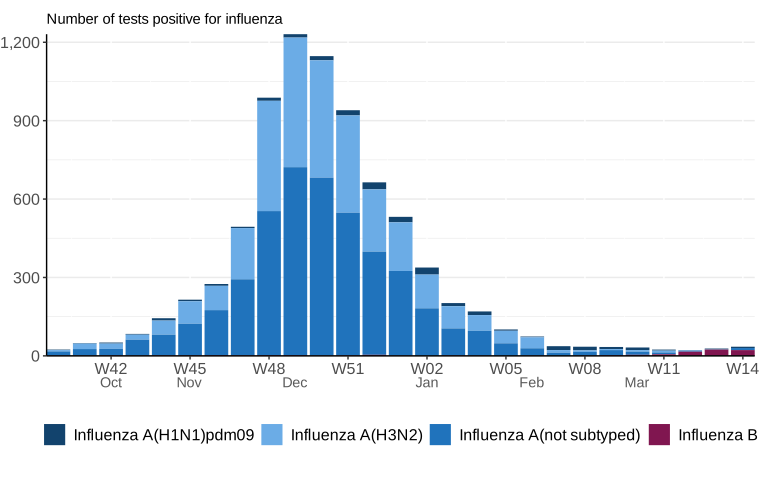
Figure 44. Number of positive tests by influenza subtype, Respiratory Datamart sentinel laboratories, England, 2025 to 2026 season

Figure 45. Weekly number of influenza detections by subtype and overall percentage positivity, Respiratory Datamart, England, 2017 to 2026

Other seasonal respiratory viruses
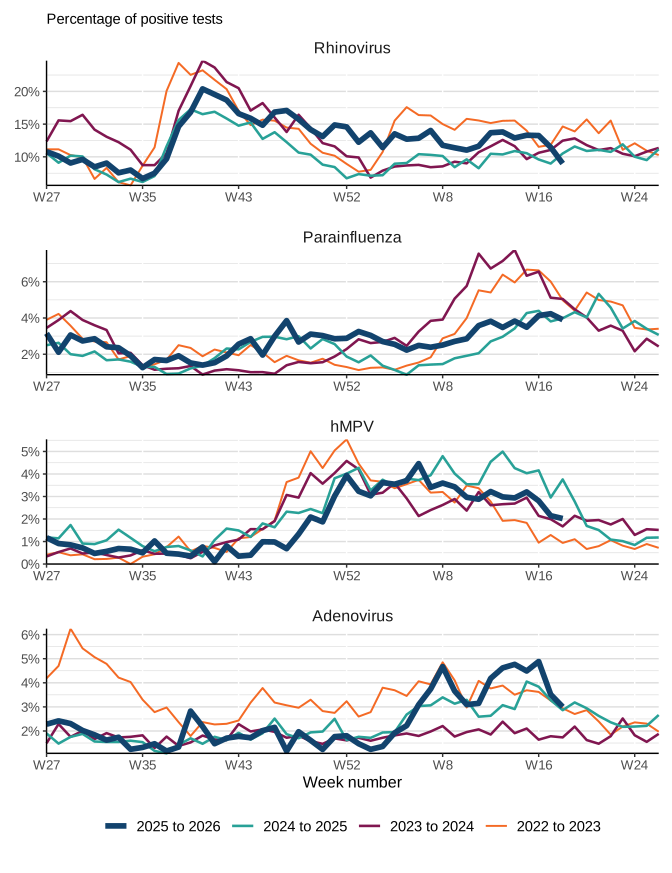
Of the other respiratory viruses monitored through the Respiratory DataMart system, the highest levels of positivity were observed with rhinovirus throughout the season. Positivity for rhinovirus peaked in week 40 2025 (week commencing 29 September 2025) at 20%. Parainfluenza activity remained low throughout the season but activity commonly increases around the period coinciding with publication of this report. Human metapneumovirus (hMPV) levels were similar compared to previous season, with recent activity pointing towards a spring peak. Adenovirus positivity estimates were low throughout the season and similar to previous seasons.
Figure 46. Weekly percentage of samples testing positive for rhinovirus, adenovirus, parainfluenza and hMPV, DataMart sentinel laboratories, England, 2025 to 2026 season
Scotland
All NHS laboratories in Scotland submit data for positive influenza tests via the Electronic Communication of Surveillance Scotland (ECOSS) database. Estimates presented here are after removal of tests that are done through sentinel testing (such as CARI). As of the 2023 to 2024 season, data submitted by all NHS laboratories include negative results for influenza. Positivity estimates are calculated as the number of positive tests divided by all tests in a given week. Positives are deduplicated within a 56-day episode window. If an individual tests positive for influenza but subtype is initially not present, it will be updated by any subsequent typed tests within the episode. Multiple different subtypes counted within a single episode of infection are considered codetections and are removed.
In the 2025 to 2026 season, positivity increased from week 44 2025 (week commencing 27 October 2025) and peaked in week 49 2025 (week commencing 1 December 2025) at 27.5% and declined thereafter. Activity was generally lower than the 2024 to 2025 season, but higher than the 2023 to 2024 season. The peak in activity was noticeably several weeks earlier than in the previous 2 seasons (Figure 47).
Figure 47. Weekly percentages of tests positive for influenza through ECOSS, Scotland, by season

The 2025 to 2026 season was driven by influenza A and in subtyped samples, most samples were influenza A(H3N2). Influenza B detections have remained low throughout the season (Figure 48).
Figure 48. Weekly tests positive for influenza by influenza subtype reported through ECOSS, Scotland, 2025 to 2026 season

Northern Ireland
Results of all positive and negative testing from the RVL and all local laboratories are collated into the Northern Ireland Health Analytics platform (NIHAP). Microbiological surveillance is the monitoring of respiratory viruses from virology data collected from settings such as hospitals and GP surgeries (excluding the sentinel GP practices). The majority of samples were received from hospitals.
Overall influenza positivity showed an increased level of activity (above 5% positivity) from week 44 2025 (commencing 27 October) and remained above this for 13 consecutive weeks, returning to 4.6% positivity in week 5 2026 (week commencing 26 January). Peak positivity was seen in week 49 2025 (week commencing 1 December) at 33.4% which was earlier and lower than what was reported in the 2024 to 2025 season (35.2% positivity in week 52 2024; week commencing 23 December).
Figure 49. Weekly percentage tests positive for influenza by season from NIHAP, Northern Ireland, by season

The majority of detections were influenza A. Of the detected influenza A viruses that were subtyped, the majority were influenza A(H3) (92.0%). Influenza B detections started increasing from week 11 2026 (week commencing 9 March), surpassing influenza A detections from week 12 2026 (week commencing 16 March).
Figure 50. Weekly positive influenza tests by influenza subtype from NIHAP, Northern Ireland, 2025 to 2026 season
Wales
Diagnostic virology results from Wales concern all test results in Wales present in Datastore. These are from patients tested from non-sentinel settings. The vast majority of these patients are in hospital, with a small proportion from non-sentinel community sources.
Out of 28,641 samples tested between week 40 2025 (week commencing 29 September 2025) and week 12 2026 (week commencing 16 March 2026), 2,485 tested positive for influenza A, and 19 tested positive for influenza B. Overall influenza positivity started to increase in week 42 2025 (week commencing 13 October 2025) and peaked in week 48 2025 (week commencing 24 November 2025) at 18.6% remaining elevated for several weeks. Positivity declined from week 2 2026 (week commencing 5 January 2026) to week 8 2026 (week commencing 16 February 2026), before returning to low levels for the remainder of the season.
Figure 51. Weekly percentage of tests positive for influenza through Datastore, Wales, by season

Virus characterisation
England
UKHSA characterises the properties of influenza viruses through one or more tests, including whole genome sequencing (genetic analysis) and haemagglutination inhibition (HI) assays (antigenic analysis). This data is used to compare how similar the circulating influenza viruses are to the strains included in the vaccines, and to monitor for changes in circulating influenza viruses. Antigenic similarity of circulating influenza strains to vaccine strains is defined as having an antibody titre within a 4-fold range when compared with reference viruses representative of the vaccine strain.
Between week 40 (week commencing 29 September) 2025 and week 14 (week commencing 30 March) 2026, the UKHSA Respiratory Virus Unit have genetically characterised, by whole genome sequencing (Illumina) and assessment of the haemagglutinin (HA) gene, 1,883 influenza A viruses (1,615 A(H3N2) and 268 A(H1N1)pdm09 viruses) and 29 influenza B viruses.
The 268 characterised influenza A(H1N1)pdm09 viruses all belong in genetic clade 5a.2. The Northern Hemisphere 2025 to 2026 influenza A(H1N1)pdm09 vaccine strain (an A/Victoria/4897/2022-like virus) also belongs in this genetic clade. 96.7% of viruses belonged to clade 5a.2a.1 subclade D.3.1 and 2.2% belonged to subclade D.3. 3 viruses (1.1%) belonged to clade 5a.2a subclade C.1.9.3. Subclades with their defining amino acid substitutions are presented in Table 2.
55 A(H1N1)pdm09 viruses have been antigenically characterised and 55 (100%) were similar to reference viruses representative of the A/Wisconsin/67/2022 (H1N1)pdm09-like and A/Victoria/4897/2022 (H1N1)pdm09‑like Northern Hemisphere 2025 to 2026 A(H1N1)pdm09 vaccine strains.
Table 2. Number of influenza A(H1N1)pmd09 viruses characterised by genetic and antigenic analysis at the UKHSA Respiratory Virus Unit, England, 2025 to 2026 season
| Clade | Subclade | Defining amino acid substitutions | Number of detections | Percentage |
|---|---|---|---|---|
| 5a.2a | C.1.9.3 | C.1.9 plus S83P, I510T | Below 5 | 1.1% |
| 5a.2a.1 | D.3 | D plus T120A, I372V | 6 | 2.2% |
| 5a.2a.1 | D.3.1 | D.3 plus I460T, V520A | 259 | 96.7% |
Figure 52. Monthly proportion of influenza A(H1N1)pdm09 subclades genetically characterised through RVU, England, 2025 to 2026 season [note 10]

Note 10: n means sample size.
The 1,615 influenza A(H3N2) viruses analysed by whole genome sequencing during the 2025 to 2026 season all belong in genetic clade 2. The Northern Hemisphere 2025 to 2026 influenza A(H3N2) vaccine strain (an A/Croatia/10136RV/2023-like virus) also belongs in this genetic clade. Haemagglutinin (HA) gene sequences show that all the influenza A(H3N2) viruses belong in clade 2a.3a.1 with the majority (97.3%) in subclade K (former J.2.4.1) which emerged early in the 2025 to 2026 season. The clade and subclade distribution of influenza A(H3N2) viruses detected in the 2025 to 2026 respiratory virus season are shown in Table 3.
Table 3. Number of influenza A(H3N2) viruses characterised by genetic and antigenic analysis at the UKHSA Respiratory Virus Unit, England, 2025 to 2026 season
| Clade | Subclade | Defining amino acid substitutions | Number of detections | Percentage |
|---|---|---|---|---|
| 2a.3a.1 | J.2 | J plus K276E | 12 | 0.8% |
| 2a.3a.1 | J.2.2 | J.2 plus S124N | Below 5 | 0.2% |
| 2a.3a.1 | J.2.3 | J.2 plus N158K and K189R | 6 | 0.4% |
| 2a.3a.1 | J.2.4 | J.2 plus T135K(-CHO) and K189R | 16 | 0.9% |
| 2a.3a.1 | K (J.2.4.1) | J.2.4 plus K2N, S144N(+CHO), N158D, I160K, Q173R, T328A and S378N | 1,572 | 97.3% |
| 2a.3a.1 | J.2.5 | J.2 plus D104N, S145N and N158K | 6 | 0.4% |
Figure 53. Monthly proportion of influenza A(H3N2) subclades genetically characterised through RVU, England, 2025 to 2026 season [note 10]

Note 10: n means sample size.
293 A(H3N2) viruses have been antigenically characterised and 13 (4.4%) were similar to reference viruses representative of the A/District of Columbia/27/2023 (H3N2)-like and A/Croatia/10136RV/2023 (H3N2)-like Northern Hemisphere 2025 to 2026 (H3N2) vaccine strains. 280 (95.6%) were antigenically distant from the Northern Hemisphere 2025 to 2026 vaccine strains: 273 belonged to the K subclade, 4 belonged to the J.2.4 subclade and 3 belonged to the J.2.3 subclade.
The 29 genetically characterised influenza B viruses all belong in clade V1A.3a.2 (B/Victoria lineage). The Northern Hemisphere 2025 to 2026 influenza B/Victoria lineage vaccine strain (a B/Austria/1359417/2021-like virus) also belongs in this clade. The clade and subclade distribution of influenza B viruses detected in the 2025 to 2026 respiratory virus season are shown in Table 4.
Table 4. Number of influenza B viruses characterised by genetic and antigenic analysis at the UKHSA Respiratory Virus Unit, England, 2025 to 2026 season
| Clade | Subclade | Defining amino acid substitutions | Number of detections | Percentage |
|---|---|---|---|---|
| V1A.3a.2 | C.3 | C plus E128K, A154E and S208P | Below 5 | 3.4% |
| V1A.3a.2 | C.3.1 | C.3 plus D197N(+CHO) | Below 5 | 6.9% |
| V1A.3a.2 | C.5.1 | C.5 plus E183K | Below 5 | 17.2% |
| V1A.3a.2 | C.5.6 | C.5 plus D129N | 13 | 44.8% |
| V1A.3a.2 | C.5.6.1 | C.5.6 plus T37I, E128D and T199A | 7 | 24.1% |
| V1A.3a.2 | C.5.7 | C.5 plus E128G and E183K | Below 5 | 3.4% |
1 influenza B virus has been antigenically characterised and was similar to reference viruses representative of the B/Austria/1359417/2021 (B/Victoria lineage)‑like Northern Hemisphere 2025 to 26 influenza B vaccine strain.
The WHO consultation on influenza vaccine composition for the Northern Hemisphere 2026/2027 took place in February 2026. The recommendation is the use of trivalent vaccines for the use in the 2026/2027 Northern Hemisphere season (Recommendations for influenza vaccine composition for the 2026-2027 northern hemisphere season).
Genome sequencing has confirmed the detection of LAIV viruses in 9 influenza A/B positive samples in surveillance samples collected since week 40 2025, all from children aged between 2 and 16 years, consistent with known shedding characteristics of LAIV viruses.
Scotland
Virus characterisation in Scotland is performed by the West of Scotland Specialist Virology Centre (WoSSVC) throughout the influenza season. Between week 40 2025 (week commencing 29 September) and week 11 (week ending 15 March), a total of 585 influenza viruses were characterised, 447 (76.4%) of which were influenza A(H3N2), 111 (19%) were A(H1N1)pdm09, and 27 (4.6%) were influenza B.
Of the 447 influenza A(H3N2) viruses, all belonged to clade 2a.3a.1, with subclade K accounting for 95.3% of the viruses followed by subclade J.2.4 which accounted for 3.1%.
For influenza A(H1N1)pdm09 viruses, all belonged in genetic clades 5a.2a and 5a.2a.1, with 82.0% characterised as 5a.2a.1 (D.3.1.1), 17.1% (D.3.1) and 0.9% 5a.2a (C.1.9.3).
All of the 27 influenza B viruses were B/Victoria lineage and belonged in clade V1A.3a.2. Subclade C.5.6 was the most frequently detected making up 33.3% of the influenza B viruses.
Influenza antiviral susceptibility, England
Molecular surveillance by whole-genome sequencing (WGS) is used to monitor the susceptibility of circulating influenza A and B viruses by comparing sequence data of the neuraminidase (NA) and polymerase (PA) genes against the WHO reference tables summarising the amino acid substitutions in the respective influenza genes associated with resistance or reduced susceptibility to neuraminidase inhibitor (NAI) or baloxavir marboxil, respectively.
Sequence data from surveillance samples collected in primary and secondary care are routinely evaluated for presence of amino acid changes associated with reduced inhibition by antiviral drugs. If amino acid substitutions associated with resistance or reduced susceptibility to antivirals are identified, the details of potential drug exposure and clinical history are investigated. Antiviral susceptibility result is usually not reported back to the sender laboratory unless, there is an indication of reduced susceptibility to antivirals or the sender specifically requested antiviral resistance testing on the sample.
Influenza virus sequences from samples collected between weeks 40 (week commencing 29 September) 2025 and week 14 (week commencing 30 March) 2026 have been analysed. Analysis of 266 A(H1N1)pdm09 and 1,610 A(H3N2) virus whole genome sequences identified 13 (0.69%) viruses with mutations in the NA gene known to confer reduced or highly reduced inhibition to NAI and 6 (0.32%) viruses with mutations in the PA gene linked to reduced susceptibility to baloxavir (Table 5 and Table 6). Analysis of 28 influenza B/Victoria lineage viruses by whole genome sequencing found no viruses with known markers of resistance to neuraminidase inhibitors (NAI) or to baloxavir.
Table 5. Antiviral susceptibility by influenza subtype in primary care, England, 2025 to 2026 season
| Subtype | Susceptible (Neuraminidase inhibitors) | Highly reduced or reduced inhibition (Neuraminidase inhibitors) | Susceptible (Baloxavir) | Reduced susceptibility (Baloxavir) |
|---|---|---|---|---|
| H1N1pdm09 | 103 | 0 | 91 | 0 |
| H3N2 | 1,018 | Below 5 | 1,009 | Below 5 |
| B Victoria | 9 | 0 | 9 | 0 |
Table 6. Antiviral susceptibility by influenza subtype in secondary care, England, 2025 to 2026 season
| Subtype | Susceptible (Neuramidase inhibitors) | Highly reduced or reduced inhibition (Neuraminidase inhibitors) | Susceptible (Baloxavir) | Reduced susceptibility (Baloxavir) |
|---|---|---|---|---|
| H1N1pdm09 | 158 | 5 | 156 | Below 5 |
| H3N2 | 584 | 7 | 581 | Below 5 |
| B Victoria | 19 | 0 | 19 | 0 |
There were less than 5 influenza A(H1N1)pdm09 viruses identified with the H275Y amino acid substitution and/or H275Y plus S247N, which is linked to highly reduced inhibition by oseltamivir. In all cases these samples were obtained from secondary care surveillance.
In secondary care surveillance, less than 5 influenza A(H3N2) viruses with an E119V amino acid substitution in NA gene, previously reported as conferring highly reduced inhibition (HRI) by oseltamivir and normal inhibition (RI) by zanamivir, were detected. Less than 5 influenza A(H3N2) virus with an R292K amino acid substitution in the NA gene, previously reported as conferring HRI by oseltamivir and reduced inhibition (RI) by zanamivir, were detected.
In primary care surveillance, the K249E amino acid substitution in the NA gene, previously reported as conferring reduced inhibition by oseltamivir and normal inhibition by zanamivir, were detected in less than 5 influenza A(H3N2) viruses. An N329R amino acid substitution in the viral NA gene, previously reported as conferring reduced inhibition by oseltamivir and normal inhibition by zanamivir, was detected in less than 5 influenza A(H3N2) viruses.
Table 7. Characteristics of mutations in neuraminidase (NA) gene affecting susceptibility to neuraminidase inhibitors (NAI) oseltamivir and zanamivir identified by antiviral susceptibility surveillance, 2025 to 2026 season
| Subtype | Amino acid substitution | Interpretation | Detections | Surveillance |
|---|---|---|---|---|
| H1N1pdm09 | H275Y | Highly reduced inhibition (oseltamivir) | Below 5 | Secondary |
| H1N1pdm09 | H275Y plus S247N | Highly reduced inhibition (oseltamivir) | Below 5 | Secondary |
| H3N2 | E119V | Reduced inhibition (oseltamivir) | Below 5 | Secondary |
| H3N2 | K249E | Reduced inhibition (oseltamivir) | Below 5 | Primary |
| H3N2 | R292K | Highly reduced inhibition (oseltamivir) and reduced inhibition (zanamivir) | Below 5 | Secondary |
| H3N2 | N329R | Reduced inhibition (oseltamivir) | Below 5 | Secondary |
Amino acid substitutions in the PA gene associated with reduced susceptibility to baloxavir were detected in viruses from both primary and secondary care surveillance. Less than 5 A(H1N1)pdm09 viruses with I38T in PA were detected in secondary care surveillance. Amino acid substitution I38L in PA was found in less than 5 A(H3N2) viruses in samples obtained from both primary and secondary care. In primary care less than 5 A(H3N2) viruses with E198K in PA were detected.
Table 8. Characteristics of mutations in polymerase (PA) gene affecting susceptibility to baloxavir identified by antiviral susceptibility surveillance, 2025 to 2026 season
| Subtype | Amino acid substitution | Interpretation | Detections | Surveillance |
|---|---|---|---|---|
| H1N1pdm09 | I38T | Reduced susceptibility | Below 5 | Secondary |
| H3N2 | I38L | Reduced susceptibility | Below 5 | Primary and Secondary |
| H3N2 | E198K | Reduced susceptibility | Below 5 | Primary |
Mortality
Influenza-attributable deaths
The FluMOMO model has been used by UKHSA for many years to estimate influenza-related mortality, adjusting for extreme temperature, and is published in annual reports. However, with the COVID-19 pandemic leading to very large mortality levels from late March 2020, and with very little influenza circulation in 2020 to 2021 and 2021 to 2022 winters, models were not run in those years. For the 2022 to 2023 season, a new model was developed to incorporate COVID-19, details of which are given in the 2023 working paper.
In the 2025 to 2026 season the FluMOMO model was run using data from 1 October 2012 to 29 March 2026. Further details of the model for this season, with comparisons to the 2025 model are given in the 2026 working paper. Briefly, the model estimates attributable mortality based on the pattern of all cause deaths by week compared with that seen for influenza activity, extreme cold or heat and COVID-19 death certifications. It allows an estimate of attributable mortality irrespective of whether deaths are recorded as due to these factors.
During the 2025 to 2026 season, influenza circulated above baseline levels from mid-November 2025 to early February 2026. COVID-19 also circulated at low levels throughout the period. There were periods of extreme cold with alerts issued. There were 2 weeks which counted as an extreme low temperature week as they were below the 3°C threshold used in the FluMOMO model.
Figure 54 represents the weekly number of all-age deaths and attribution to influenza, COVID-19 and extreme temperature covering the most recent 4 winters (week 40 2022 to 13 2026). The model demonstrates that the winter of 2025 to 2026 had low levels of excess mortality, with the greatest contributors on top of the baseline (grey) being influenza (red), followed by COVID-19 (blue), and cold weather (green) (Figure 54, Table 9 and Table 10).
Figure 54. Weekly number of all-age deaths and attribution to influenza, COVID-19 and cold weather, England, week 40 2022 to week 13 2026

Influenza-related mortality for winter the 2025 to 2026 season is estimated at about 3,800 which is much lower than the roughly 9,700 seen in the 2024 to 2025 season, and slightly lower than the estimated 4,400 seen in the 2023 to 2024 season. Compared with pre-pandemic years in the model, the 2025 to 2026 season influenza-attributable mortality was generally lower.
For temperature-related mortality, the 1,400 estimate from the 2 cold weeks was similar to the previous 2 seasons. It should be noted that alternative estimates of temperature-attributable mortality are produced by UKHSA using a different statistical model. These models are designed for a distinct analytical purpose and vary in their underlying assumptions while differences in estimates between models are expected, they should be broadly consistent.
Table 9. Estimated number of deaths associated with influenza, by age observed through the adapted FluMOMO algorithm with 95% confidence intervals [note 11], England, 2025 to 2026 season (week 40 2024 to week 13, 2026) [note 12]
| Age | Total estimate | Lower 95% CI | Upper 95% CI |
|---|---|---|---|
| 0-4 years [note 12] | 7 | 2 | 13 |
| 5-14 years | 3 | 1 | 6 |
| 15-64 years | 346 | 301 | 394 |
| 65 years and over | 3,442 | 3,140 | 3,753 |
| Total | 3,798 | 3,488 | 4,108 |
Note 11: confidence intervals do not include uncertainty from model specification.
Note 12: estimates in children should be treated with caution, as the method is not calibrated to estimate such small excesses.
Table 10. Estimated number of all age deaths associated with influenza, COVID-19 and cold weather observed through the adapted FluMOMO algorithm, England, 2012 to 2013 season to 2025 to 2026 [note 13] [note 14] [note 15]
| Season | Number of influenza-associated deaths | Number of COVID-19-associated deaths | Number of cold-associated deaths | Number of unexplained deaths | Total number of deaths |
|---|---|---|---|---|---|
| 2012 to 2013 | 11,418 | 0 | 5,243 | 4,357 | 21,020 |
| 2013 to 2014 | 661 | 0 | 0 | -6,165 | -5,503 |
| 2014 to 2015 | 33,281 | 0 | 1,307 | -4,482 | 30,107 |
| 2015 to 2016 | 12,356 | 0 | 45 | 1,207 | 13,608 |
| 2016 to 2017 | 19,074 | 0 | 464 | 3,266 | 22,805 |
| 2017 to 2018 | 24,742 | 0 | 2,896 | 7,662 | 35,300 |
| 2018 to 2019 | 5,332 | 0 | 1,261 | -2,735 | 3,858 |
| 2019 to 2020 | 9,123 | [x] | 0 | 55,592 | 64,715 |
| 2020 to 2021 | 0 | [x] | 4,126 | 46,864 | 50,990 |
| 2021 to 2022 | 432 | 35,540 | 0 | -7,004 | 28,967 |
| 2022 to 2023 | 14,378 | 17,474 | 5,064 | 6,621 | 43,537 |
| 2023 to 2024 | 4,431 | 7,702 | 1,743 | 2,684 | 16,560 |
| 2024 to 2025 | 9,740 | 4,003 | 1,690 | -969 | 14,465 |
| 2025 to 2026 | 3,798 | 1,842 | 1,387 | -325 | 6,704 |
[x] Data is not available
Note 13: unexplained is negative if the estimated excess from influenza, COVID-19 and cold weather is more than the observed total excess above the baseline.
Note 14: year is week 40 of one year to week 20 of the next except 2025 to 2026 which ends on week 13.
Note 15: deaths from week 12 2020 to week 26 2021 were excluded from the modelling, the unexplained excess in 2019 to 2020 and 2020 to 2021 will be almost all due to COVID-19.
Paediatric mortality
Paediatric mortality offers insight into the severity of an influenza season. Children, particularly those under 5 or with underlying health conditions, are more vulnerable to severe outcomes.
Influenza-related deaths within each season were identified using positive influenza cases from SGSS, ONS all-cause mortality data and death records from the NHS spine. Laboratory confirmed influenza case records were linked to deaths recorded in the NHS spine using demographic batch service tracing and to ONS all-cause mortality records to indicate where a case had died within 28 days of a positive specimen within that season. ONS all-cause mortality data was also used to identify deaths where influenza was mentioned as a cause of death on an individual’s death certificate.
There are significant reporting lags in mortality data. At the time of publication, data is available only up to week 14 for the 2025 to 2026 season, while for previous seasons data is available up to week 20. The date range refers to the date of death and includes individuals who tested positive for influenza up to 28 days prior. Deaths with influenza listed as a cause of death were identified using ICD-10 codes J09, J10, and J11. Note that influenza-related deaths estimates may include deaths that are not attributable to influenza infection, including detections due to live-attenuated influenza vaccine (LAIV). Methods for identifying influenza-related deaths have been updated since the previous annual report, which may lead to small differences in previously reported numbers.
Between 5 October 2025 and 4 April 2026 (week 40 to week 14), an estimated 36 influenza-related deaths occurred in children under 18 years. For comparison, an estimated 66 paediatric influenza-related deaths were reported in the 2024 to 2025 season (6 October 2024 to 17 May 2025), 36 deaths in the 2023 to 2024 season (1 October 2023 to 18 May 2024) and 89 deaths in the 2022 to 2023 season (2 October 2022 to 20 May 2023).
Table 11. Estimated number of deaths associated with influenza in those aged under 18 years, England, 2022 to 2026
| Cause | 2022 to 2023 season | 2023 to 2024 season | 2024 to 2025 season | 2025 to 2026 season |
|---|---|---|---|---|
| Deaths where influenza was mentioned on death certificate | 46 | 14 | 37 | 11 |
| Deaths within 28 days of a positive influenza test | 74 | 35 | 58 | 33 |
| Total influenza related deaths | 89 | 36 | 66 | 36 |
Vaccination
Seasonal influenza vaccine uptake in adults
Although all countries of the United Kingdom (UK) use standardised specifications to extract vaccine uptake data from IT information systems in primary care (GP system suppliers), there are some differences in extraction specifications, so comparisons between nations should be made with caution.
England
In England, the uptake of seasonal influenza vaccine is monitored by UKHSA throughout the season based on weekly and monthly extracts from GP system suppliers via ImmForm for the cohorts primarily delivered via the GP practice.
During the 2025 to 2026 season, for the second time adult groups (excluding pregnant women) were eligible from 1 October, rather than 1 September as in seasons prior to 2024 to 2025. Therefore, data for those aged 65 years and over, and those aged under 65 years in clinical risk groups and frontline healthcare workers, is comparable with the previous season (2024 to 2025), but not directly comparable to seasons prior to that. As in previous seasons, children and pregnant women were eligible from 1 September.
Cumulative uptake on influenza vaccinations administered up to 28 February 2026 was reported from 99.3% (6,126 out of 6,170) of GP practices in England in the 2025 to 2026 season. Comparative data is up to 28 February 2025 where vaccine uptake was reported from 98.7% (6,150 out of 6,229) of GP practices in England in the 2024 to 2025 season.
This season saw a vaccine uptake of 74.5% in those aged 65 years and over (compared with 74.9% in the 2024 to 2025 season). For the first time this season, those aged 65 years and over are also reported as those aged 65 to under 75 years (68.1%) and 75 years and over (81.1%). For those aged 6 months to under 65 years with one or more underlying clinical risk factors (excluding pregnant women without other risk factors and carers), vaccine uptake was 40.6% compared with 40.0% in the 2024 to 2025 season. Vaccine uptake in pregnant women was 38.4%, compared with 35.0% in the 2024 to 2025 season (Table 12).
In frontline healthcare workers, the total vaccine uptake (combined total for trusts and GP practices) was 45.2%, an increase from 37.8% vaccine uptake in the 2024 to 2025 season. In trusts, vaccine uptake was 45.0% (from 88.9% of trusts responding), an increase from 37.5% vaccine uptake in the 2024 to 2025 season (from 92.3% of trusts responding). In GP practices, vaccine uptake was 53.5% (from 9.5% of GP practices responding), an increase from 51.5% vaccine uptake in the 2024 to 2025 season (from 9.6% of GP practices responding). Further information on influenza vaccine uptake data in frontline healthcare workers in England.
Table 12. Vaccine uptake in target groups in the UK: England, 2025 to 2026 season [note 16] [note 17]
| Target group | Number vaccinated | Number eligible | Vaccine uptake (%) |
|---|---|---|---|
| 65 years and over | 8,674,672 | 11,644,058 | 74.5 |
| 65 years to under 75 years | 5,925,040 | 4,037,382 | 68.1 |
| 75 years and over | 5,719,018 | 4,637,290 | 81.1 |
| 6 months to under 65 years and at risk | 3,899,528 | 9,596,589 | 40.6 |
| Pregnant with no risk factors | 205,811 | 558,994 | 36.8 |
| Pregnant with risk factors | 41,526 | 84,724 | 49.0 |
| All pregnant | 247,337 | 643,718 | 38.4 |
| Frontline healthcare workers | 534,701 | 1,183,244 | 45.2 |
Note 16: excludes social care workers for England, Scotland, Wales and Northern Ireland.
Note 17: this is the combined total for NHS trusts and GP practices.
Further information on influenza vaccine uptake data in GP patients in England.
Scotland
The uptake of seasonal influenza vaccine is estimated by Public Health Scotland throughout the season and published weekly on the Public Health Scotland - Vaccination Surveillance Dashboard. Vaccination events are recorded using the TURAS Vaccination Management Tool which is a web-based tool for healthcare staff in Scotland to record real-time patient vaccination data at the point of care. Vaccination events are then stored in the National Clinical Data Store (NCDS) developed by NHS Education Scotland and utilised by PHS to report uptake rates. Vaccination uptake is based on the current, living population of Scotland.
By the end of week 14 2025 (ending 6 April), among adults aged 65 years and older, 74.6% were vaccinated against influenza during the 2025 to 2026 season (compared with 74.1% in the 2024 to 2025 season). Among at risk groups, 38.9% have been vaccinated against influenza (compared with 34.6% in the 2024 to 2025 season). In health and social care workers, the vaccine uptake was 42.0% and 18.5% respectively, an increase from 35.9% and 17.2% in the 2024 to 2025 season. Please note pregnancy influenza vaccine uptake data is not currently available for winter 2025 to 2026.
Northern Ireland
In Northern Ireland, the uptake of seasonal influenza vaccine is monitored by the Public Health Agency (PHA) of Northern Ireland. Influenza vaccine uptake is determined using data extracted from the regional Immunisation Information System developed by the Department of Health (DoH) Digital team, known as the Vaccine Management System (VMS). Eligible groups are not mutually exclusive and individuals may be counted in more than one group. Individuals may have more than one eligibility criteria for vaccination, however most will only have one reason for vaccination recorded on VMS. This will impact estimates of vaccine uptake. Vaccine uptake figures may be subject to revision with improvements in data collection and reporting. Further information on methodology including definitions, caveats and data sources can be found in the Northern Ireland seasonal influenza vaccination surveillance report.
This season vaccine uptake was 74.0% in adults aged 65 years and over, similar to 73.7% in the 2024 to 2025 season. In the population ‘at risk’ aged 18 to 64 years, vaccine uptake was 37.3%. In 2024 to 2025, seasonal influenza vaccination was offered to ‘at risk’ individuals aged 18 to 49 years (28.6%) in addition to all adults aged 50 to 64 years (25.9%). Recording of eligibility criteria in VMS improved in the 2024 to 2025 season. Pregnancy uptake data for 2025 to 2026 is not available at date of the current report.
Influenza vaccine was offered to all healthcare workers. Uptake in all trust-employed healthcare workers, excluding social care, was 36.7%, compared with 23.6% in 2024 to 2025.
Wales
In Wales, data on influenza immunisation for the 2025 to 2026 campaign was collected through the Welsh Immunisation System (WIS). WIS is an all-Wales population vaccination register that was developed during the COVID-19 pandemic. This is the first season influenza vaccinations have been recorded on WIS. Data prior to the 2025 to 2026 season was collected from GP systems via Audit+ Data Quality System and based on automated weekly extracts of Read coded data using software installed in all GP practices. Cumulative uptake data on influenza vaccinations administered were received from 100% of GP practices in 2025 to 2026.
Vaccine uptake was 71.7% in adults aged 65 years and older (compared with 70.3% in 2024 to 2025) and 43.2% for those aged 16 years to under 65 years with 1 or more underlying clinical risk factors, compared with 36.8% in those aged 6 months to under 65 years in 2024 to 2025. Vaccine coverage in pregnant women is measured using a survey of pregnant women giving birth each year during January. Overall uptake in pregnant women was 61.3% compared with 62.1% in 2024 to 2025.
Data for children with a risk condition aged 6 months to 15 years and data for carers were not available for the 2025 to 2026 season.
Influenza vaccine programme for children
England
The influenza vaccine uptake for those aged 2 and 3 year in England is monitored by UKHSA throughout the season, through weekly and monthly extracts from GP system suppliers via ImmForm.
Cumulative vaccine uptake on influenza vaccinations administered up to 28 February 2026 was reported from 99.4% (6,164 out of 6,126) of GP practices in England in the 2025 to 2026 season. Comparative data is up to 28 February 2025 where vaccine uptake was reported from 99.2% (6,177 out of 6,225) of GP practices in England in the 2024 to 2025 season.
The 2025 to 2026 season saw a vaccine uptake of 43.5% among all those GP-registered aged 2 years (an increase compared with 41.7% in the 2024 to 2025 season) and 44.8% in those aged 3 years (an increase compared with 43.5% in the 2024 to 2025 season) in England. The combined uptake for those aged 2 and 3 years was 44.2% compared with 42.6% in the 2024 to 2025 season.
In the 2025 to 2026 season, school-aged children in year groups reception to year 11 (aged 4 to 16 years) were eligible for the influenza vaccine programme. The programme was mainly delivered via a school-based route, with one area (Isle of Scilly) delivering vaccinations through general practice. Vaccine uptake was monitored through manual returns by local teams for their responsible population.
Cumulative vaccine uptake on influenza vaccinations administered up to 31 January 2026 was reported from 99.4% (153 out of 154 local authorities) in England in the 2025 to 2026 season. Comparative data is up to 28 February 2025 where vaccine uptake was reported from 100% (154 of 154 local authorities) in England in the 2024 to 2025 season.
An estimated 4,147,773 out of 7,939,623 eligible children in school years reception to year 11 in England received at least one dose of influenza vaccine between 1 September 2025 and 31 January 2026. The overall uptake was 52.2%, an increase compared with 50.2% in the 2024 to 2025 season. Vaccine uptake in all primary school-aged children (aged 4 to 11 years) was 55.5% compared with 54.5% in the 2024 to 2025 season. Vaccine uptake in secondary school-aged children (aged 11 to 16 years) was 48.0% compared with 44.6% in the 2024 to 2025 season.
Vaccine uptake in children of school age generally decreases with increasing age. This trend has been seen in the previous seasons.
Further information on influenza vaccine uptake data in children of school age in England.
Scotland
During the season, PHS publishes weekly updates on the Public Health Scotland - Vaccination Surveillance Dashboard for those eligible in the following cohorts: 6 months to 2 years at risk, 2 to 5 years not at school, primary, and secondary school pupils.
The estimated uptake in preschool children (2 to under 5 years old, not yet in school) was 50.8%. This compares with 50.3% in the 2024 to 2025 season. For primary school children the estimated uptake was 67.0% compared with 68.1% in the 2024 to 2025 season. In secondary school children there was an estimated uptake of 52.1% compared with 53.1% in the 2024 to 2025 season.
Northern Ireland
Vaccinations administered as part of the schools influenza vaccination programme are recorded on the Northern Ireland Child Health System (CHS) which feeds into VMS. Vaccinations administered by GPs to children are recorded in VMS.
In 2025 to 2026 the childhood influenza vaccination programme continued to include all pre-school children aged 2 to 4 years, all primary school-aged children (years 1 to 7) and post primary school children in years 8 to 12. Pre-school children were offered vaccination through primary care, and primary and post-primary school children are offered vaccination through school health teams.
The vaccination uptake in 2025 to 2026 for pre-school children aged 2 to 4 years old was 29.6% (compared to 30.0% in 2024 to 2025). The vaccination uptake for children in primary school (aged approximately 4 to 11 years) was 59.4% (compared to 64.9% in 2024 to 2025). Vaccine uptake in post-primary school children (years 8 to 12) was 55.0%, compared to 58.5% in 2024 to 2025. These year groups were vaccinated through school clinics and a small number by GP.
Wales
In Wales, immunisations for 2 and 3 year olds were delivered through GPs. National uptake of influenza vaccine in 2 and 3 year olds increased in 2025 to 2026. Uptake of influenza vaccine for children aged 2 years was 45.0% (compared with 43.2% in 2024 to 2025) and for 3 year olds was 47.1% (compared with 44.0% in 2024 to 2025). For the whole group of children aged 2 and 3 years, uptake was 46.1% (compared with 43.6% in 2024 to 2025). Further details will be available on the Public Health Wales influenza vaccination uptake report.
The childhood influenza programme in Wales includes all primary and secondary school children. Uptake in school children decreased compared with last season. Uptake in primary school children was 57.6% (compared with 61.6% in 2024 to 2025). Uptake in secondary school children was 45.4% (compared with 51.9% in 2024 to 2025).
Vaccine effectiveness
Vaccine effectiveness against influenza presenting in primary care
In England, Scotland, Northern Ireland and Wales for the 2025 to 2026 season, influenza VE was estimated using a test-negative study design. VE is presented against influenza in those presenting to primary care with symptoms of acute respiratory infection. Infection data was collected through 4 sentinel GP-based swabbing schemes in England (RCGP), Scotland (CARI), Northern Ireland and Wales (as described in the GP sentinel swabbing section of this report). Vaccination status of study participants was obtained through questionnaire at the time of swabbing (Wales) or data linkage with immunisation databases (England, Scotland, Northern Ireland).
In children aged 2 to 17 years, the overall adjusted influenza VE in the 2025 to 2026 season was 51.6% (95% confidence interval (CI): 43.3% to 58.7%) against all laboratory confirmed influenza (Figure 55). In adults aged 18 to 64 years, the overall VE was 32.2% (95% CI: 22.3% to 40.9%) against all laboratory confirmed influenza. In adults aged 65 years and over, the overall VE was 21.4% (95% CI: 4.8% to 35.2%).
In subtype-specific analyses across the age groups, VE against influenza A(H3N2) was similar to the overall VE; a high proportion of 2025 to 2026 season influenza surveillance cases were A(H3N2). VE against influenza A(H1N1) was moderate in adults aged 18 to 64, but in children aged 2 to 17 and in adults aged 65 and over VE was uncertain; point estimates were low with wide confidence intervals. It was not possible to estimate VE against influenza B due to very low case counts.
Figure 55. Adjusted VE against acute respiratory infection presentation in primary care with laboratory-confirmed influenza, by influenza subtype and age group, England, Scotland, Northern Ireland and Wales, 2025 to 2026 season [note 18] [note 19] [note 20]

Note 18: adjusted for week of sample, age group, sex, nation, clinical risk status.
Note 19: numbers of cases and controls informing this analysis can be found in the supplementary data file.
Note 20: it was not possible to estimate VE against influenza B due to low case numbers.
Vaccine effectiveness against hospitalisation
England
In England for the 2025 to 2026 season influenza VE was also estimated using a test-negative study design against hospitalisation. VE is presented against influenza in those requiring hospitalisation with a diagnosis consistent with acute respiratory infection in England during the period week 40 2025 to week 8 2026. Testing data was collected through SGSS and the Respiratory DataMart surveillance system, hospitalisations data was collected using the NHS Secondary Uses Service (SUS). Vaccination status of study participants was obtained through data linkage with the Immunisation Information System (IIS).
England published very early season VE estimates during November 2025 covering a shorter period at the beginning of the influenza season and using rapidly accessible emergency care data rather than hospitalisation data with diagnostic codes. Owing to differences in data sources and time periods these VE estimates are not directly comparable.
In children aged 2 to 17 years, the overall adjusted VE in the 2025 to 2026 season was 67.9% (95% CI: 64.6% to 71.0%) against all laboratory confirmed influenza. In adults aged 18 to 64 years, the overall VE was 21.7% (95% CI: 16.5% to 26.7%) against all laboratory confirmed influenza. In adults aged 65 years and over, the overall VE was 29.1% (95% CI: 25.9% to 32.2%).
VE was estimated against influenza A subtypes A(H1N1) and A(H3N2). Since only a proportion of influenza A positive samples were further subtyped, there was greater uncertainty in subtype-specific VE analyses, and, in the 2025 to 2026 season, uncertainty was greatest for A(H1N1) due to lower case numbers. Moderate VE was demonstrated against A(H1N1) for children aged 2 to 17 years and adults aged 18 to 64 years, in adults aged 65 and above VE was lower and the confidence interval crosses 0. VE against influenza A(H3N2) was high in children aged 2 to 17 years, but lower in adults aged 18 to 64 years and aged 65 and above. VE against influenza B should be interpreted with caution due to low circulation of influenza B in the study period resulting in wide confidence intervals (Figure 56).
Figure 56. Adjusted vaccine effectiveness against hospitalisation with a diagnosis consistent with an acute respiratory infection and laboratory-confirmed influenza by influenza subtype and age group, England, 2025 to 2026 season [note 19] [note 21]

Note 19: numbers of cases and controls informing this analysis can be found in the supplementary data file.
Note 21: adjusted for week of sample, age group, UKHSA region, clinical risk status.
Scotland
In Scotland, final estimates of VE were produced for the eligible population using a test‑negative study design, adjusted for time during season, age, sex, setting, deprivation , number of clinical risk groups and immnosuppression status. VE is presented against influenza infection among people with an unplanned hospital admission where a respiratory‑related diagnosis was the cause of admission. The analysis used linked data from ECOSS influenza testing, SMR01 hospital admissions, and vaccination records from the National Clinical Data Store (NCDS). The analysis period ran from 28 September 2025 to 31 March 2026 , a time during which the H3N2 subtype of influenza A unusually dominated in Scotland.
Overall adjusted VE against laboratory confirmed influenza was 31.7% (95% CI 25.6% to 37.3%) across all ages. When stratified by age, aVE was 54.4% (95% CI 30.0% to 70.8%) among children aged between 2 and 17 years, 34.4% (95% CI 20.0% to 46.4%) among adults aged 18 to 64 years, and 31.0% (95% CI 23.8% to 37.5%) among adults aged 65 years and over.
Subtype specific analyses against influenza A(H3) showed an overall aVE of 35.8% (95% CI 18.9% to 49.4%). By age group, aVE against A(H3) was 53.6% (95% CI 14.5% to 76.3%) among children aged between 2 and 17 years and 30.1% (95% CI 6.3% to 48.0%) among adults aged 65 years and over. Estimates for adults aged 18 to 64 years were not reliably estimated due to low numbers. We were also unable to accurately measure effectiveness against influenza H1N1 and influenza B due to low numbers of cases as the season was predominantly characterised by circulation of influenza A(H3).
Owing to the unexpected dominance of the H3N2 subtype, Scotland published preliminary VE estimates against influenza A hospitalisation in December which showed an aVE of 78.4% (95%CI 65.4% to 86.5%) in children aged between 2 and 17 years and 36.8% (95%CI 23.0% to 48.2%) among adults aged 65 years and over. Mid-season estimates published in February 2026, showed an overall aVE of 34.2% (95%CI 28.3% to 39.1%) against all influenza A, 61.2% (95%CI 41.3% to 74.1%) in children aged between 2 and 17 years and 34.8% (95%CI 28.0% to 41.2%) among adults aged 65 years and over. As presented here, final influenza VE estimates are typically lower than interim estimates published earlier in the season. As the season progresses, protection can decline due to waning immunity, particularly as many people are vaccinated early. In addition, people who are most susceptible to influenza (because of higher exposure or lower immunity) are more likely to be infected earlier in the season, leaving a lower–risk population later, which can influence VE estimates. Differences between vaccinated and unvaccinated groups early in the season, as well as changes in virus circulation and exposure over time, can further affect results. As a result, end–of–season VE estimates provide a more conservative and complete assessment of vaccine performance across the full influenza season.
Figure 57. Adjusted vaccine effectiveness against hospitalisation with a diagnosis consistent with an acute respiratory infection and laboratory-confirmed influenza by influenza subtype and age group, Scotland, 2025 to 2026 season [note 22] [note 23]
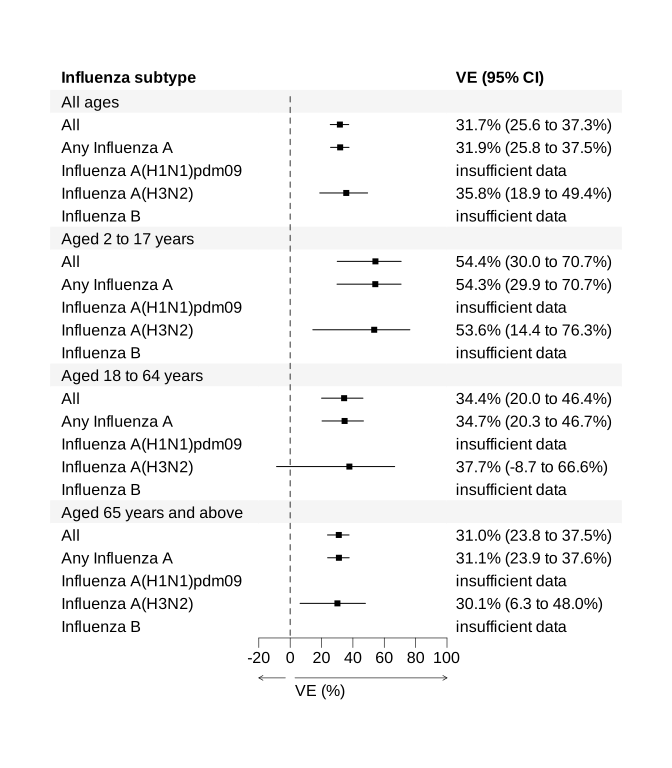
Note 22: adjusted for time during season, age, sex, deprivation and number of clinical risk groups.
Note 23: it was not possible to estimate VE against influenza A(H1N1)pdm09 and influenza B due to low case numbers.
Hospital admissions and deaths prevented through vaccination
The number of hospital admissions and deaths prevented, in England, due to the influenza vaccination programme from the 2022 to 2023 season onwards were estimated by fitting an age and risk-stratified dynamic influenza transmission model to surveillance data. Using vaccine uptake data from ImmForm and estimates for VE against hospital admission, the model was fitted to GP ILI consultation data and virology samples for swabbed patients from RCGP, as well as hospital admissions data from SARI Watch. Mortality rates were calculated using results from the FluMOMO model.
The model distinguished between VE against infection and VE against hospital admission, with the former inferred from the surveillance data and guided by an estimate from the ONS COVID-19 infection survey pilot study for influenza in 2022 to 2023. The possibility of lower VE against infection was explored as a sensitivity analysis.
Once fitted, the model was used to explore how removing the entire vaccination programme would impact hospital admissions and deaths, and to estimate the number of hospital admissions and deaths prevented by vaccination. The model output indicated that an estimated 104,200 (95% CI: 86,900 to 125,100) hospital admissions and 7,100 (95% CI: 5,800 to 8,900) deaths were prevented by the influenza vaccination programme in the 2025 to 2026 season. In the sensitivity analysis, with reduced VE against infection, an estimated 41,800 (95% CI: 28,700 to 61,700) hospital admissions and 2,900 (95% CI: 2,000 to 4,400) deaths were prevented in the 2025 to 2026 season.
Estimates for previous seasons are shown in Table 13 and Table 14. For further details on the model refer to Influenza hospital admissions prevented by vaccination: a transmission dynamic analysis of the 2022 to 2023 and 2023 to 2024 programmes in England.
Table 13. Estimated number of hospital admissions prevented by the influenza vaccination programme in thousands, England, 2022 to 2026, with 95% confidence interval shown in brackets [note 24]
| Season | Main analysis | Sensitivity analysis |
|---|---|---|
| 2022 to 2023 | 67.5 (60.2 to 76.6) | 30.1 (22.8 to 41.8) |
| 2023 to 2024 | 98.6 (91.6 to 108.8) | 86.9 (76.9 to 98.6) |
| 2024 to 2025 | 189.8 (162.5 to 215.9) | 64.9 (48.2 to 93.3) |
| 2025 to 2026 | 104.2 (86.9 to 125.1) | 41.8 (28.7 to 61.7) |
Note 24: results differ to previously reported estimates due to a number of model upgrades including: (i) infection hospitalisation rate priors are now calculated using the ONS COVID-19 infection survey pilot study for influenza in 2022 to 2023 and SARI Watch, (ii) POLYMOD social contact survey data was replaced by the recent Reconnect study.
Table 14. Estimated number of deaths prevented by the influenza vaccination programme in thousands, England, 2022 to 2026, with 95% confidence interval shown in brackets
| Season | Main analysis | Sensitivity analysis |
|---|---|---|
| 2022 to 2023 | 19.7 (17.3 to 22.5) | 9.0 (6.7 to 12.8) |
| 2023 to 2024 | 9.2 (8.4 to 10.1) | 8.0 (7.0 to 9.2) |
| 2024 to 2025 | 26.1 (22.3 to 30.4) | 8.9 (6.8 to 12.6) |
| 2025 to 2026 | 7.1 (5.8 to 8.9) | 2.9 (2.0 to 4.4) |
Avian and other zoonotic influenza
Avian influenza A(H5N1)
From January 2003 to January 2026, a total of 993 human cases of avian influenza A(H5N1) have been reported globally. Of these cases, 477 were fatal, resulting in a case fatality rate of 48.0%. Since 2020, clade 2.3.4.4b of avian influenza A(H5N1) has become widespread in birds, with some occasional spillover to non-avian species and sporadic detections in humans.
No new human cases of avian influenza A(H5N1) have been detected in the UK since January 2025. Avian influenza A(H5N1) continues to circulate in animals in the UK, particularly in poultry and wild birds with occasional spill over into wild mammals, though the risk to the general public continues to be very low.
On 25 March 2024, the US reported an outbreak of avian influenza A(H5N1) clade 2.3.4.4b, genotype B3.13 in dairy cattle, marking the first documented instance of influenza A virus infection in this species, with more than 1,000 dairy cattle herds affected across 19 US states until December 2025. Following the initial identification in dairy cattle, 41 human cases of avian influenza A(H5N1) with epidemiological links to infected dairy cattle herds were identified across 5 US states. However, as of 1 April 2026, no further human cases have been identified since February 2025. Outbreaks of H5N1 in poultry were detected in numerous commercial and backyard flocks across the US between April 2025 to March 2026, but no associated human cases were reported.
Throughout 2025, 18 human cases of avian influenza A(H5N1) clade 2.3.2.1e (formerly clade 2.3.2.1c) were detected in Cambodia. Of these 18 cases, 9 were fatal, resulting in a case fatality rate of 50.0%. Further human cases of avian influenza A(H5N1) continue to be reported in Cambodia in early 2026, with 2 human cases of A(H5N1) reported in 2026 as of 1 April 2026. Clade 2.3.2.1e is known to be circulating in poultry in a number of provinces across Cambodia, and most human cases reported direct contact with infected poultry, with no evidence of human-to-human transmission.
Further sporadic, unlinked human cases of H5N1 reported in April 2025 to March 2026 include: 5 cases, including 1 death, across Bangladesh between May 2025 and February 2026; 2 fatal cases in a child and adult in India, confirmed in April and June 2025; 1 fatal case in a child in Mexico in April 2025 with no known exposure to poultry; 1 case in a child in Vietnam in April 2025 and 1 case in an adult in China in April 2025.
In January 2026, antibodies to avian influenza A(H5N1) were identified in the milk of a single cow in the Netherlands, indicating the cow had previously been exposed to the virus, with reports that the cow had showed symptoms consistent with A(H5N1) infection in cattle, namely mastitis and reduced milk yield, in mid-December 2025. On the same farm, also in December 2025, a cat demonstrated symptoms and tested positive for avian influenza A. Subsequent investigations in January 2026 identified no evidence of active infection with avian influenza A in any of the cows, other mammals or people on the farm.
Other avian influenza subtypes summary
Sporadic human cases of other, non-H5N1 avian influenza A subtypes continue to be identified globally, most commonly A(H9N2) and A(H10N3). However no human cases of non-H5N1 avian influenza have been identified in the UK in recent years.
The first imported human case of avian influenza A(H9N2) in Europe was identified in Italy in March 2026.
Cases of A(H9N2) are frequently reported in China, with 29 cases reported in 2025 and further cases continue to be reported in early 2026. Most cases were non-severe and reported direct contact with poultry. Between December 2015 and 10 April 2026, 159 total human cases avian influenza A(H9N2) have been reported in the Western Pacific region, with 156 from China, 2 from Cambodia and 1 from Vietnam. Of these 159 cases, 2 were fatal (both with underlying conditions), resulting in a case fatality rate of 1.3%. Up to 1 April 2026, there have been 7 cases of avian influenza A(H10N3) reported globally since 2021, with all 7 detected in China. No fatalities associated with H10N3 infection have been reported.
Further sporadic human cases of other avian influenza A subtypes between April 2025 and March 2026 include: 1 fatal case of H5N5 in the US in November 2025; and 1 case of H5N2 in Mexico in September 2025. Both of these cases had known exposure to poultry.
Most human cases of avian influenza viruses are exposed through contact with infected poultry or contaminated environments, including live poultry markets or domestically kept birds. As the viruses continue to be detected in animals and environments, further human cases can be expected. However, the current epidemiological, genomic and virological evidence suggests that these viruses have not acquired the ability to transmit between humans. It is important to ensure that imported cases of suspected avian influenza are detected promptly to ensure public health measures including infection control can be rapidly put in place to minimise any risk of onward transmission.
Swine influenza zoonoses summary
Globally, sporadic human cases of swine influenza, such as influenza A(H3N2)v and A(H1N1)v continue to be reported. Close contact with infected pigs, or visits to settings such as farms and agricultural fairs, remains a recognised exposure risk, however as of 13 April 2026, no additional human cases of swine influenza have been reported in the UK beyond a single case of influenza A(H1N2)v clade 1 B.1.1, identified in England in November 2023.
In September 2025, a confirmed human case of influenza A(H1N1)v was reported in Germany.
In November 2025, a confirmed human case of influenza A(H1N2)v was reported in Vermont, United States of America.
In December 2025, a confirmed human case of influenza A(H1N1)v was reported in Yunnan province, China.
In January 2026, a confirmed human case of influenza A(H3N2)v was reported in Brazil.
In February 2026, a confirmed human case of influenza A(H1N1)v was reported in Catalonia, Spain.
In February 2026, a confirmed human case of influenza A(H1N2)v was reported in Yunnan province, China.
Glossary
Confidence interval (CI)
A measure of the degree of uncertainty in an estimate based on a sample distribution. Here, 95% confidence intervals indicate that if we repeatedly observed the same process under identical conditions, 95% of the intervals would contain the true value. A wider range indicates more uncertainty in the estimate. Overlapping confidence intervals indicate that there may not be a true difference between estimates.
Disease activity
A measure of the current level of disease occurrence or transmission within a population at a specific point in time.
Disease burden
A measure of the impact of a health problem, typically assessed using indicators such as mortality, morbidity and financial cost.
Disease patterns
Refers to the frequency and distribution of disease within a population, typically described by time, place and person.
Vaccine effectiveness
A measure of how well vaccines work in the real world against a specified outcome. This differs from vaccine efficacy, which refers to how well vaccines work in controlled conditions. In test-negative case-control studies, vaccine effectiveness is commonly estimated as 1 minus the odds ratio.
Vaccine impact
The overall public health benefit of a vaccination programme in a population, defined as the overall reduction in disease outcomes associated with vaccination. In this report, vaccine impact is estimated as the reduction in disease outcomes compared with a counterfactual scenario in which vaccination had not occurred.
Data sources and methodology
For additional information regarding data sources please refer to the sources of surveillance data for influenza, COVID-19 and other respiratory viruses.
Further details on the data from Scotland informing this report can be found in the weekly report, and the methodology and metadata supplementary data file. In addition, there are further resources on the CARI sentinel surveillance.
Further details on the data from Northern Ireland informing this report are available in the weekly report as well specific further details on vaccine coverage data.
Further details on the data from Wales informing this report are available in the weekly report.
Further information and contact details
Feedback and contact information
To provide feedback and for all queries relating to this document, please contact respdsr.enquiries@ukhsa.gov.uk
Acknowledgements
Compiled by the Influenza surveillance section, Immunisation and Vaccine-Preventable Diseases Division, UK Health Security Agency with contributions from:
- Public Health Scotland
- Public Health Wales
- Public Health Agency, Northern Ireland
- Royal College of General Practitioners
- Real-time Syndromic Surveillance team, UKHSA
- Respiratory Virus Unit, Colindale, UKHSA
- SARS-CoV-2 Immunity and Reinfection EvaluatioN (SIREN) team, UKHSA
- Acute Respiratory Infections team, UKHSA
Official statistics
Our statistical practice is regulated by the Office for Statistics Regulation (OSR). OSR sets the standards of trustworthiness, quality and value in the Code of Practice for Statistics that all producers of official statistics should adhere to.
You are welcome to contact us directly by emailing respdsr.enquiries@ukhsa.gov.uk with any comments about how we meet these standards.
Alternatively, you can contact OSR by emailing regulation@statistics.gov.uk or via the OSR website.
UKHSA is committed to ensuring that these statistics comply with the Code of Practice for Statistics. This means users can have confidence in the people who produce UKHSA statistics because our statistics are robust, reliable and accurate. Our statistics are regularly reviewed to ensure they support the needs of society for information.