Bulletin - Commentary
Published 15 July 2026

© Crown copyright 2026
This publication is licensed under the terms of the Open Government Licence v3.0 except where otherwise stated. To view this licence, visit nationalarchives.gov.uk/doc/open-government-licence/version/3 or write to the Information Policy Team, The National Archives, Kew, London TW9 4DU, or email: psi@nationalarchives.gov.uk.
Where we have identified any third party copyright information you will need to obtain permission from the copyright holders concerned.
This publication is available at https://www.gov.uk/government/statistics/income-tax-liabilities-statistics-tax-year-2023-to-2024-to-tax-year-2026-to-2027/bulletin-commentary
1. Introduction
1.1 About This Publication
This publication is the annual update of the Income Tax Liabilities Statistics. This commentary presents information from Tables 2.1 to 2.6, providing detailed statistics on the most recent outturn data and projected estimates of individual Income Tax payer numbers, Income Tax liabilities and average rates of Income Tax. The most recent outturn data is for the 2023 to 2024 tax year and is collected from the Survey of Personal Incomes (SPI). The outturn data is presented alongside projected estimates for the three subsequent tax years. The SPI is based on information held by HMRC on individuals who could be liable to UK Income Tax. It is carried out annually by HMRC and covers income assessable to tax for each tax year.
Additional supplementary information is published that accompanies this release, which includes:
- Accompanying statistical data in Tables 2.1 to 2.6
- Supporting Documentation including context and background information, data sources, methodology, quality indicators and a glossary of terms
1.2 New in this release
This release of the Income Tax Liabilities Statistics publication includes the finalised outturn data for the 2023 to 2024 tax year collected from the SPI. In addition, it includes revised projections for tax years 2024 to 2025 and 2025 to 2026 and the first projection estimates for the 2026 to 2027 tax year. The estimates for tax years beyond 2023 to 2024 are projected from the new 2023 to 2024 SPI outturn data using economic assumptions consistent with the Office for Budget Responsibility’s (OBR) March 2026 Economic and Fiscal Outlook.
This release reflects all Income Tax policy changes up to and including the 2026 to 2027 tax year. This includes changes made by both the UK and Scottish Governments following the devolution of Income Tax rates and bands (except the Personal Allowance, which remains reserved) that apply to Scottish Income Tax payers’ non-savings, non-dividend income.
The publication continues to be published in an accessible format in line with government guidance on publishing accessible content.
Tables 2.1 to 2.6 are provided in an open file format, while the Commentary and Supporting Documentation are published in HTML.
2. Table 2.1 – Number of individual Income Tax payers by marginal rate, sex and age
Table 2.1 provides data on the number of Income Tax payers between 1990 to 1991, when independent taxation for all individuals was introduced in the UK, and 2026 to 2027. The Income Tax payer population is broken down by marginal rate of Income Tax, sex, and age. Income Tax payers are classified by their highest marginal rate of Income Tax, which is the rate that an extra pound sterling of income would be charged at. Savers and basic rate Income Tax payers are all considered ‘basic’ rate Income Tax payers as no Income Tax is due at the higher or additional rate. From 2018 to 2019, Scottish Income Tax payers with non-savings non-dividend (NSND) income in the starter rate and intermediate rate are considered ‘basic’ rate Income Tax payers, and the Scottish NSND higher and top rates are grouped with all other Income Tax payers in the higher and additional marginal rate bands respectively, despite having different rates. From 2024 to 2025, Scottish Income Tax payers with NSND income in the advanced rate are considered ‘additional’ rate Income Tax payers. Further details on the marginal Income Tax rate can be found in Annex B of the Supporting Documentation.
Please see Table 2.1a for historic years before 1990 to 1991.
2.1 Income Tax payer population
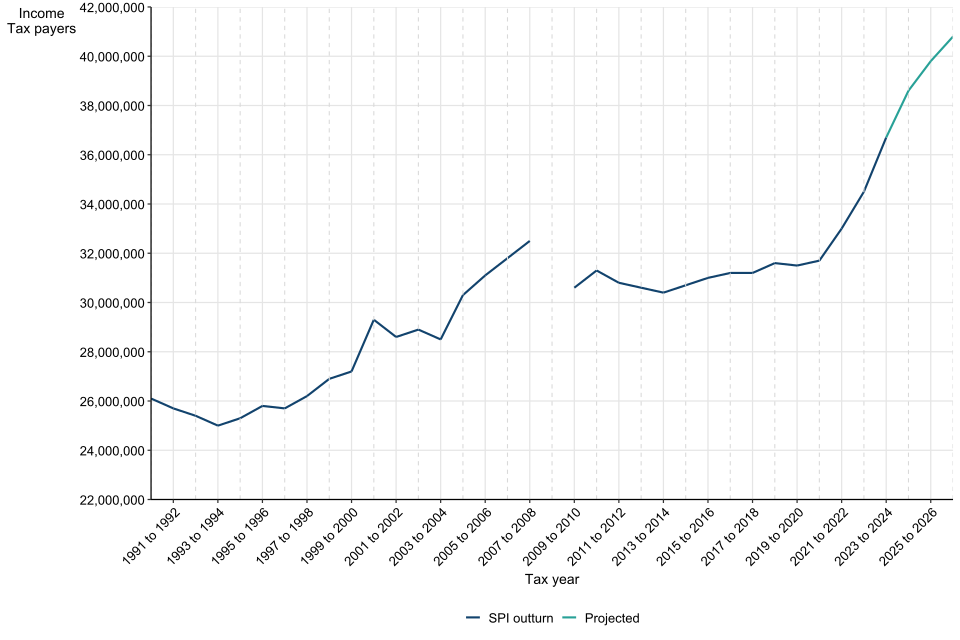
The 2023 to 2024 outturn data shows there was an estimated 36.7 million Income Tax payers in 2023 to 2024. This is an increase of 2.2 million Income Tax payers when compared to 2022 to 2023 which is expected to be driven by the frozen Personal Allowance and income growth that leads to an increase in individuals liable for Income Tax. The total number of Income Tax payers is projected to rise to 40.8 million in 2026 to 2027, mainly due to population and income growth combined with frozen Income Tax thresholds. The Personal Allowance is set at £12,570 in 2021 to 2022 through to 2030 to 2031, due to the extension of the freeze at Autumn Budget 2025. When combined with income growth, this results in an increase of the Income Tax paying population as individuals’ incomes grow to exceed the Personal Allowance, which makes them liable to pay Income Tax. The overall number of Income Tax payers from tax year 1990 to 1991 through to 2026 to 2027 can be viewed in Figure 1. Income Tax payer numbers in 2020 to 2021 and 2021 to 2022 were affected by the economic impacts of COVID-19, which likely have residual impacts for future years.
Figure 1: Number of individual Income Tax payers between 1990 to 1991 and 2026 to 2027
2.2 Income Tax payers by age and sex
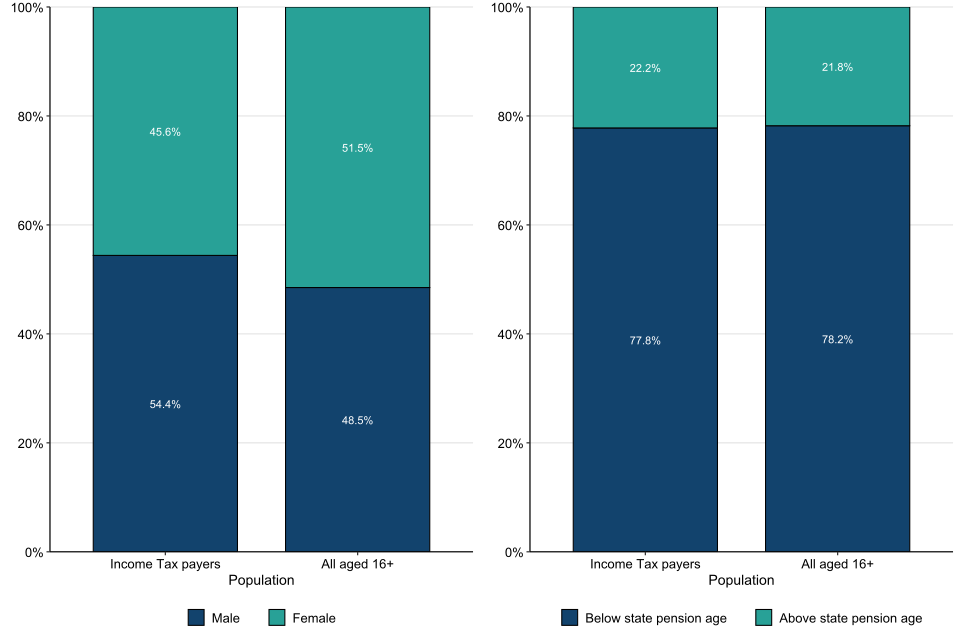
In 2023 to 2024, 16.7 million (45.6%) Income Tax payers were female and 19.9 million (54.4%) were male. Comparatively, for mid-2023 the Office for National Statistics (ONS) population estimate found that just 48.5% of the UK population aged 16 and over were male, suggesting men are overrepresented in the Income Tax payer population whilst women are underrepresented. For the tax year 2026 to 2027, projections show that an estimated 18.9 million (46.3%) Income Tax payers are female, 21.9 million (53.7%) are male, and 9.58 million (23.5%) are above the state pension age. The statistics presented here can be found in Table 2.1, with proportions compared to ONS population estimates demonstrated in Figure 2.
Published estimates for 2023 to 2024 indicate there are 8.16 million Income Tax payers (22.2%) over the state pension age. The ONS population estimate for mid-2023 found that 21.8% of the population who were 16 or over were of state pension age, indicating that this demographic are slightly underrepresented in the Income Tax payer population. For this publication, the state pension age is set as 66 years for both sexes in the 2023 to 2024 tax year, and in the subsequent tax years through to 2025 to 2026 inclusive.
The State Pension age for men and women will now increase to 67 between 2026 and 2028. More information on the phased approach can be found in Table 4 of State Pension age timetable - GOV.UK. For modelling purposes we have set the state pension age in 2026 to 2027 to a decimal value of 66.25.
Figure 2: Income Tax payer populations in 2023 to 2024 by age and sex, compared to mid-2023 Office for National Statistics population estimates
2.3 Income Tax payers by marginal rate
In 2023 to 2024, 652,000 individuals (1.8%) were ‘savers rate’ Income Tax payers, meaning they had no taxable earnings but had taxable savings and/or dividends (see Glossary). In addition, there were 29.4 million (80.1%) basic rate Income Tax payers, 5.76 million (15.7%) higher rate Income Tax payers, and 893,000 (2.4%) additional rate Income Tax payers.
Figure 3: Income Tax payer population by marginal rate of Income Tax
| Tax year | 2023 to 2024 | 2026 to 2027 |
|---|---|---|
| Savers | 652,000 | 415,000 |
| Basic | 29,400,000 | 31,400,000 |
| Higher | 5,760,000 | 7,700,000 |
| Additional | 893,000 | 1,290,000 |
In 2026 to 2027 it is estimated that 415,000 individuals (1.0%) will be savers rate Income Tax payers, down 0.8 percentage points compared to 2023 to 2024. In this same period, while there is a projected rise in the number of basic rate Income Tax payers in 2026 to 2027 to 31.4 million, the proportion of people paying Income Tax at this rate falls by 3.1 percentage points to 76.9%. In 2026 to 2027, the proportion of higher rate Income Tax payers is expected to rise by 3.2 percentage points (from 15.7% to 18.9%) - reaching 7.7 million (a 18.9% increase year-on-year). This shift from basic rate to higher rate taxpayers is largely due to the higher rate threshold being frozen from 2022 to 2023 through to 2030 to 2031 at the 2021 to 2022 level and earnings growth in the middle and higher end of the income distribution pushing taxpayers into the higher range. The impact of the higher rate threshold freeze is slightly offset by the lowering of the additional rate threshold in 2023 to 2024 which still brings some higher rate taxpayers into paying the additional rate. However there is still a year-on-year increase in the proportion of higher rate taxpayers in every tax year from 2023 to 2024 until 2026 to 2027.
There are projected to be 1.29 million (3.2%) additional rate Income Tax payers in 2026 to 2027, an increase of 44% from 2023 to 2024. The additional rate threshold was frozen at £150,000 since it was introduced in 2010 to 2011 until 2022 to 2023 inclusive. As average total incomes increase with the economy, more individuals become liable for additional rate, reflected in the steady increase in additional rate Income Tax payers over that period. From 2023 to 2024 onwards the additional rate threshold was reduced to £125,140 and frozen at this level, meaning a greater number of individuals become liable for the additional rate and explains the continued increase from 2023 to 2024 to 2024 to 2025 of an additional 219,000 Tax payers (0.4 percentage point increase).
From 2017 to 2018 the Scottish Government have had the power to set the rates and thresholds applying to all non-savings non-dividend Income Tax paid by Scottish Income Tax payers (except for the Personal Allowance). The assumptions around how a Scottish Income Tax payer is identified and how their marginal rate is allocated are detailed in Annex B of the Supporting Documentation. The introduction of the advanced rate of Scottish Income Tax in 2024 to 2025 has reclassified some Scottish Income Tax payers. Income Tax payers whose marginal rate is the advanced rate of Scottish Income Tax are classified as additional rate tax payers from 2024 to 2025. Previously their marginal rate was the higher rate of Scottish Income Tax and they were classified as higher rate tax payers. The introduction of the advanced rate contributes to the large increase in the number of additional rate Income Tax payers in Scotland from 2024 to 2025.
Please note the numbers in Table 2.1 may not sum due to rounding.
3. Table 2.2 – Number of individual Income Tax payers by country and region
Table 2.2 is a collection of tables that provide a breakdown of the number of individuals with positive Income Tax liabilities (Income Tax payers) across different UK countries and Government Office Regions. Each table provides the number of Income Tax payers for a given region, subset by marginal rate of Income Tax, sex, and age. Marginal rate is the rate of tax that an extra pound sterling of income that would be charged at.
An Income Tax payer’s country and region are determined by residential postcode. Projections of Income Tax payer numbers by country and region beyond the 2023 to 2024 outturn are based on economic outturn data and forecast assumptions applying to the UK as a whole and should be regarded as indicative. These projections do not account for geographical variations in economic or population trends and the regional splits shown have had UK growth rates applied to them (see the Supporting Documentation for further details).
Please see Table 2.2a for historic years before 1999 to 2000.
3.1 Income Tax payers by country and region
Figure 4 shows the number of Income Tax payers in each country and region in 2023 to 2024 and 2026 to 2027. In 2023 to 2024, the largest proportion of Income Tax payers resided in the South East (14.6% of the total), followed by London (13.2%) and the North West (10.6%). Northern Ireland had the lowest proportion of Income Tax payers (2.5%) of all the countries and regions, followed by the North East (3.7%) and Wales (4.4%). Approximately 1% of Income Tax payers either resided abroad or their address was unknown, and these individuals are not included in Table 2.2.
Figure 4: Number of Income Tax payers by country and region
| Country or region | 2023 to 2024 | 2026 to 2027 |
|---|---|---|
| North East | 1,340,000 | 1,510,000 |
| North West | 3,900,000 | 4,360,000 |
| Yorkshire and the Humber | 2,870,000 | 3,210,000 |
| East Midlands | 2,670,000 | 2,970,000 |
| West Midlands | 3,090,000 | 3,460,000 |
| East of England | 3,580,000 | 3,970,000 |
| London | 4,840,000 | 5,320,000 |
| South East | 5,360,000 | 5,910,000 |
| South West | 3,220,000 | 3,590,000 |
| Wales | 1,620,000 | 1,810,000 |
| Scotland | 2,980,000 | 3,310,000 |
| Northern Ireland | 901,000 | 1,020,000 |
3.2 Higher and additional rate Income Tax payers
In 2023 to 2024, the UK has 6.65 million higher and additional rate Income Tax payers. There were 4 regions where the proportion of higher and additional rate Income Tax payers exceeded the UK average of 18.1%: London, which had 28.9% of the total, the South East which had 22.8%, the East of England which had 20.1% and Scotland which had 20.8%. By contrast, the regions with the least representation of higher and additional rate Income Tax payers were Northern Ireland with 10.7% of the total, Wales with 11.9%, and the North East with 12.0%.
The Scottish higher rate threshold (see Glossary) was increased with Consumer Price Index (CPI) indexation in 2021 to 2022 to £43,662 and has since remained at that level up to and including the 2026 to 2027 tax year. As a result of no indexation increases to the higher rate threshold as well as income growth, the combined number of higher and additional rate Scottish Income Tax payers is projected to increase in each year from 2023 to 2024 until 2026 to 2027.
4. Table 2.4 – Shares of total income (before and after tax) and Income Tax for percentile groups
Table 2.4 shows how the distributions of income and Income Tax liabilities have changed between 1999 to 2000 to the current tax year. Income distribution provides one measure of income inequality, while the shares of total Income Tax liabilities reflect the progressivity of the Income Tax system. The table also shows the income breakpoints for each percentile group, meaning the point at which the next percentile group begins. Table 2.4 does not provide a complete picture of individual income inequality in the UK due to the exclusion of those who don’t pay Income Tax, and because the SPI records only include incomes that are assessable for tax (for example, a range of non-taxable social security benefits, some tax credits and non-taxable savings from ISAs are not included).
Income Tax payers are ranked based on total income assessable for tax (earnings, savings and dividend income) before any deductions and tax allowances (such as pension contributions), and then divided into percentile groups ranged on income. For projection estimates for tax years 2024 to 2025 onwards each income component is grown at the same rate for all individuals in each projection year except for pay, where differential earnings growth across the pay distribution is consistent with past trends and includes the impact of forestalling from previous policy changes (for more details see the section on projection estimates in the Supporting Documentation).
Shares of incomes before and after Income Tax,and shares of total Income Tax liability estimates in 2020 to 2021 and 2021 to 2022 are affected by the economic impacts of COVID-19, which will also likely lead to residual impacts for future years. These shares and future projections of them include impacts from wage growth, as outlined by the OBR’s March 2026 Economic and Fiscal Outlook.
4.1 Income distribution
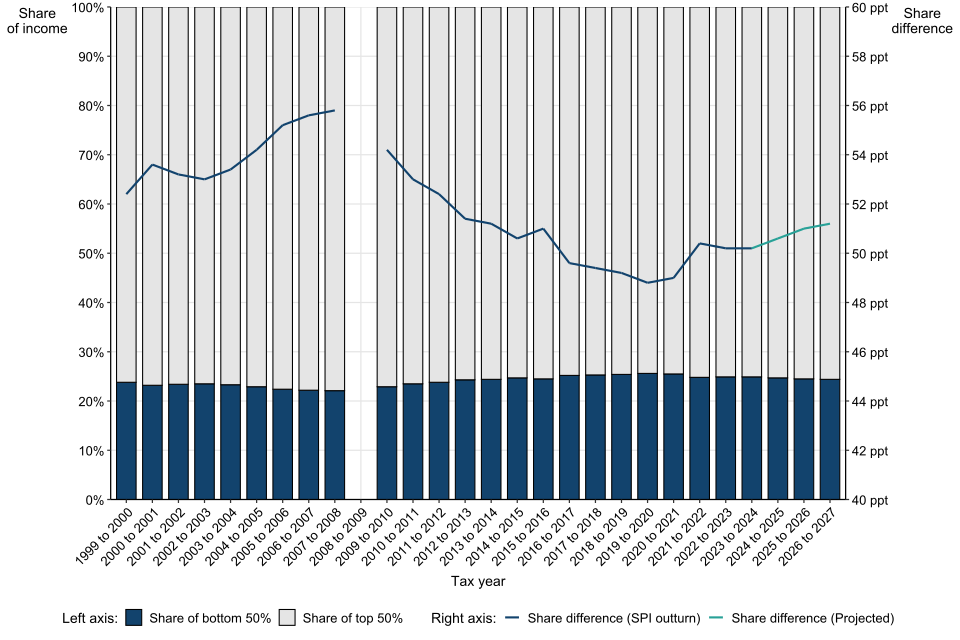
Figure 5 shows that Income Tax payers’ total income before tax grew from £533 billion in 1999 to 2000 to £1.53 trillion in 2023 to 2024 and is projected to reach £1.83 trillion by 2026 to 2027. The top 10% of Income Tax payers accounted for around a third (34.0%) of all income before Income Tax in 2023 to 2024, the top 5% accounted for around a quarter (24.6%), and the top 1% accounted for 12.4%. By contrast, the bottom 10% accounted for just 3.4% of all income before Income Tax, the bottom 5% made up 1.6%, and the bottom 1% made up just 0.3%.
In 1999 to 2000, income inequality between the bottom and top 50% of Income Tax payers was highlighted by a 52.4 percentage point difference in their share of total income before tax: the bottom 50% had 23.8% whilst the top 50% had 76.2%. Inequality by this measure grew in the years leading up to the 2008 recession, showing a 55.8 percentage point difference in 2007 to 2008 (77.9% for the top 50% compared to 22.1% for the bottom 50%). Income inequality (by this measure) then decreased, returning to 1999 to 2000 levels by 2011 to 2012 and declining thereafter up to 2019 to 2020 before beginning to grow in most years from 2020 to 2021.
In 2023 to 2024 there was a 50.2 percentage point difference in share of total income before tax, and this measure of income inequality is projected to increase to 51.2 percentage points in 2026 to 2027. This is in part driven by the wage growth in the top 50% in 2021 to 2022 where income inequality increases 1.4 percentage points from 2020 to 2021. It is important to note that the population of Income Tax payers used in these calculations differ each tax year due to variations in the number of individuals liable to Income Tax, which depends in part on Income Tax policy measures at that time. The freeze in the Personal Allowance in 2022 to 2023 continuing to 2026 to 2027 will have impacted the taxpayer numbers, bringing more people into paying tax. Shares of total income would differ if non-Income Tax payers were included.
Figure 5: Shares of total income for bottom and top 50% of Income Tax payers (ranged on total income)
4.2 Share of Income Tax liabilities
Total Income Tax liabilities were £93 billion in 1999 to 2000, growing to £274 billion in 2023 to 2024 and are expected to reach £347 billion by 2026 to 2027.
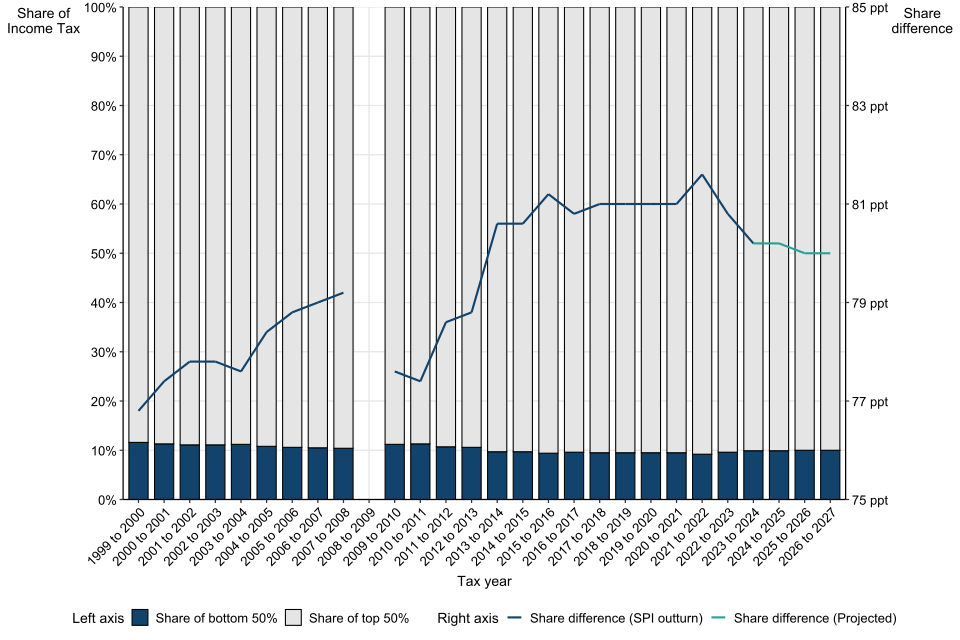
In 2023 to 2024 the bottom 50% of Income Tax payers were liable for 9.9% of total tax, whilst the top 50% were liable for 90.1%. The top 10% of Income Tax payers were liable for around 59.1% of total Income Tax, while the top 1% were liable for around 27.2%. In comparison, the bottom 10% were liable for 0.4% of total Income Tax and the bottom 1% were liable for a negligible share. The shares of total Income Tax for each percentile group can be viewed in Figure 6.
Each of the top income percentile groups (25%, 10%, 5% and 1%) see a year-on-year decrease in their share of Income Tax liability in nearly every year from 2023 to 2024 until 2026 to 2027. The peak in shares of Income Tax liabilities at the top end of the distribution in 2021 to 2022, and subsequent fall in 2022 to 2023 onwards, is also due to the freeze in the higher rate threshold and Personal Allowance. This means there were more Income Tax payers overall in these years, changing the distribution among percentile groups.
In 2026 to 2027 Income Tax payers in each of the bottom percentile groups (those in the 1st, 5th, 10th and 25th income percentile groups) remain liable for about the same percentage of Income Tax as they did in 2023 to 2024. The bottom 50% of Income Tax payers are projected to remain liable for a stable share of total Income Tax, increasing only from 9.9% in 2023 to 2024 to 10.0% in 2026 to 2027. The top 50% of Income Tax payers are projected to be liable for a slightly lower share of total Income Tax in 2026 to 2027 than 2023 to 2024 at 90.0% and 90.1% respectively.
Figure 6: Share of total Income Tax for bottom and top 50% of Income Tax payers (ranged on total income)
4.3 Additional rate impacts
Since its introduction in April 2010, the majority of the additional rate Income Tax payer population is composed of the top 1% of Income Tax payers. The share of total income before Income Tax projected to be received by the top 1% of Income Tax payers decreases by 0.3 percentage points to 12.8% between 2023 to 2024 and 2026 to 2027, while their share of total Income Tax decreases by 0.5 percentage points to 26.6%. The highest share of Income Tax to be paid by the top 1% is projected to have been 30.7% in tax year 2021 to 2022. The reduced Income Tax share in 2026 to 2027 compared to 2023 to 2024 is mainly due to the increase in Income Tax payer numbers largely as a result of the Personal Allowance freeze in 2022 to 2023 continuing to 2026 to 2027.
The share of total income and total Income Tax liabilities for the top 1% income percentile group since 1999 to 2000 can be viewed in Figure 7. The introduction of the additional rate in 2010 on taxable income over £150,000 led to a behavioural response by individuals bringing forward, or ‘forestalling’, income in 2009 to 2010. Income forestalling in this year was estimated by HMRC at around £16 billion to £18 billion or 2% of total Income Tax payer income. Details of these effects were set out in a HMRC report published in March 2012. In April 2013, the additional rate was reduced from 50% to 45% which led to the deferral of income from the 2012 to 2013 tax year to the 2013 to 2014 tax year. This resulted in a ‘below normal’ share of income for the top 1% in 2012 to 2013 (compared to if there was no forestalling) and the subsequent increase of this share in 2013 to 2014. The share of income before Income Tax for the top 1% was expected to have returned to a ‘normal’ level in 2014 to 2015. Finally, from April 2023 the additional rate threshold was reduced from £150,000 to £125,140. This tax change was not expected to cause forestalling in additional rate Tax payers, but was expected to cause forestalling in higher rate Tax payers with an income between £125,140 and £150,000, who are trying to avoid the higher tax rate on income in that band in 2023 to 2024.
Figure 7: Share of total income before Income Tax and total Income Tax liability for the top 1% of Income Tax payers (ranged on total income)
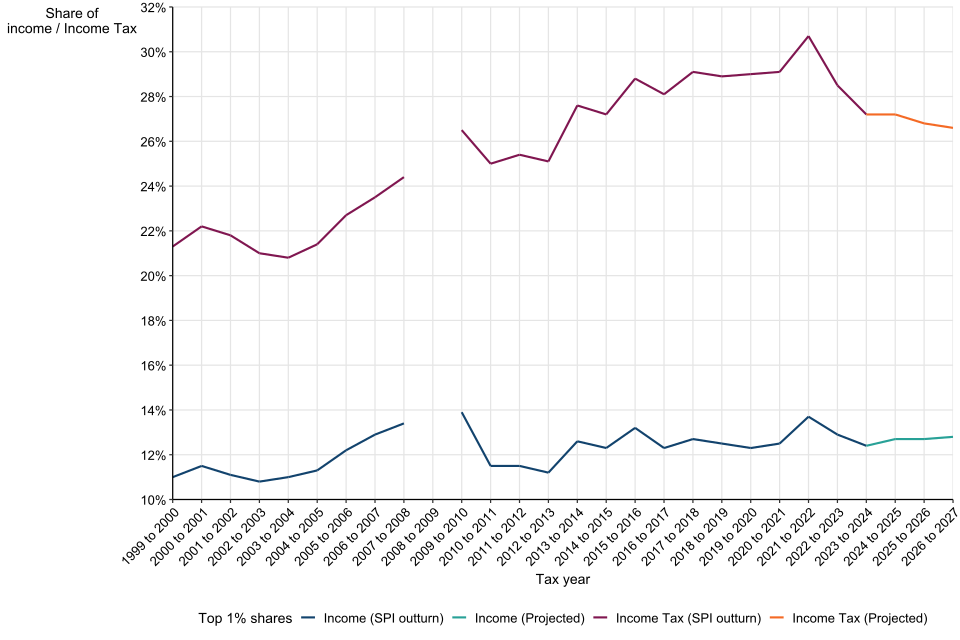
The impact of these behavioural responses means that the share of income before Income Tax for the top 1% percentile group displayed more marked variation in this time period, which is outlined below.
In relation to the introduction of the 50% additional rate in April 2010, the share of income for the top 1% was:
- artificially high in 2009 to 2010
- artificially low between 2010 to 2011 and 2011 to 2012 as forestalling unwinds over these years
Then, when the additional rate was reduced to 45% in April 2013, the share of income for the top 1% was:
- artificially low in 2012 to 2013
- artificially high in 2013 to 2014
- returned to normal in 2014 to 2015
In 2023 to 2024, the additional rate threshold was lowered from £150,000 to £125,140. This is estimated to have led to a small amount of forestalled income into 2022 to 2023. The share of income for higher rate taxpayers with earnings around the new threshold was:
- artificially high in 2022 to 2023
- artificially low in 2023 to 2024
4.4 Dividend impacts
Another policy change that resulted in a behavioural response and forestalling of income was the abolishment of the dividend tax credit in 2016 to 2017, combined with an increase in dividend tax rates and the introduction of the dividend allowance. The outturn data for 2015 to 2016 through to 2021 to 2022 will show the impact of forestalling in these years (where income was brought forward to 2015 to 2016) (see section on dividend adjustment in Annex B of the Supporting Documentation.
The impact of these estimated behavioural responses means that the top 1% share of income is:
- artificially high in 2015 to 2016
- artificially low in 2018 to 2019 through to 2021 to 2022 as the forestalling continues to unwind over these years. The majority of the unwind effect is captured between 2016 to 2017 and 2018 to 2019
A further policy change that is forecast to drive forestalling of income is the 1.25 percentage point increase in dividend tax rates made in 2022 to 2023. The outturn data for 2021 to 2022 and 2022 to 2023 will show the impact of forestalling in this year. Projected estimates for 2023 to 2024 through to 2026 to 2027 have been adjusted to account for estimated income shifting due to the taxation of dividends (see section on dividend adjustment in Annex B of the Supporting Documentation.
The impact of these estimated behavioural responses means that the top 1% share of income is:
- artificially high in 2021 to 2022
- artificially low in 2022 to 2023 through to 2027 to 2028 as the forestalling continues to unwind over these years
4.5 Further notes on the top 1% share
The published years that are unaffected by income forestalling or unwinding are the years leading up to and including 2007 to 2008, and 2014 to 2015. As such, when viewing Figure 6 and Table 2.4 only the tax year 2014 to 2015 can be compared directly with the years preceding the additional rate. For example, the share of total income before Income Tax for the top 1% of Income Tax payers declined from 13.4% in 2007 to 2008 to 12.3% in 2014 to 2015, reflecting the reduction in income inequality between these tax years which are unaffected by forestalling or unwinding.
In contrast, the share of total Income Tax liability of the top 1% of Income Tax payers increased from 24.4% in 2007 to 2008 to 27.2% in 2014 to 2015, indicating that the progressivity of the tax system increased over this period. Factors contributing to this increase in progressivity include:
- the introduction of the additional rate and the Personal Allowance taper
- the lowering of the limits on tax relief on pension contributions
- the above-indexation increase to the Personal Allowance since 2010 to 2011 with the benefits going mainly to basic rate Income Tax payers
Annex B of the Supporting Documentation describes in more detail HMRC’s estimates of behavioural responses to the additional rate of Income Tax.
5. Table 2.5 – Income Tax liabilities by income range
Table 2.5 provides data on the number of Income Tax payers and their Income Tax liabilities by total income and is grouped by marginal rate of Income Tax, which is the rate that an extra pound sterling of income that would be charged at. Income groups are defined as the lower limit for total income before any deductions, allowances and tax credits. Taxable income is net of these deductions and allowances, which explains why there are Income Tax payers within an income range that is higher than their marginal rate Income Tax band limit (for example, there are some basic rate Income Tax payers within an income range higher than the basic rate limit). Scottish Income Tax payers with NSND income in the starter rate and intermediate rate are considered ‘basic’ rate Income Tax payers. From 2024 to 2025, Scottish Income Tax payers with NSND income in the advanced rate are considered ‘additional’ rate Income Tax payers, as well as those paying the Scottish top rate (see Annex B of the Supporting Documentation for further details).
Income Tax liability amounts include those accrued at other rates of tax, for example total liabilities of higher rate Income Tax payers include liabilities due at the basic and other rates of Income Tax. For each income group, the average rate of Income Tax is calculated as the total Income Tax liability expressed as a percentage of total income. Deductions, allowances and tax credits will vary across individuals within each group, contributing to differences in individual tax rates within groups. An individual’s marginal rate of Income Tax places an upper limit on their average rate of tax due on their total income; average tax rates therefore rise with income towards 45% (or 46% for Scottish non-savings non-dividend Income Tax payers between 2021 to 2022 and 2022 to 2023, rising to 47% in 2023 to 2024 and 48% in 2024 to 2025).
Please see Table 2.5a for historic years before 2023 to 2024.
5.1 Number of Income Tax payers by income
In total there were an estimated 36.7 million Income Tax payers in the UK in 2023 to 2024. Of these, an estimated 8.38 million Income Tax payers (22.8%) had total income assessable for tax under £20,000 and 21.0 million Income Tax payers (57.3%) had income from £20,000 to under £50,000. When combined these groups account for 80.2% of all Income Tax payers in 2023 to 2024. In contrast, the number of Income Tax payers with total incomes of £50,000 or more was 7.28 million (19.8%). There were relatively few Income Tax payers with very high incomes, with an estimated 26,000 Income Tax payers with incomes above £1 million, of which 9,000 had incomes above £2 million.
The projected change in the number of Income Tax payers between 2023 to 2024 and 2026 to 2027 across the income range is shown in Figure 8. Income Tax payer numbers are projected to increase across all income ranges over £20,000 by 2026 to 2027, reflecting expected growth in the population, employment rates and incomes. There is a projected increase in the number of Income Tax payers between 2023 to 2024 and 2026 to 2027 with a total income between £50,000 and £100,000 which reflects the wage growth at the higher end of the income distribution. When comparing with the previous published estimate for 2023 to 2024, the current estimates have 0.1 million more total Income Tax payers in 2023 to 2024. Current projections for 2024 to 2025 have 0.6 million more total Income Tax payers than the previous published estimate, whereas current projections for 2025 to 2026 have 0.7 million more taxpayers when compared with the previous published estimate.
Figure 8: Income Tax payers by income range for 2023 to 2024 and 2026 to 2027
| Income range (lower limit) | 2023 to 2024 | 2026 to 2027 |
|---|---|---|
| Personal Allowance | 2,850,000 | 2,900,000 |
| £15,000 | 5,530,000 | 5,520,000 |
| £20,000 | 10,200,000 | 10,100,000 |
| £30,000 | 10,800,000 | 12,700,000 |
| £50,000 | 5,710,000 | 7,490,000 |
| £100,000 | 878,000 | 1,190,000 |
| £150,000 | 294,000 | 373,000 |
| £200,000 | 311,000 | 395,000 |
| £500,000+ | 81,000 | 105,000 |
5.2 Liabilities and average Income Tax rates
When looking across marginal rates, the distribution of total Income Tax liabilities shows that in 2023 to 2024, savers and basic rate Income Tax payers made up 81.9% of the Income Tax paying population but were liable for just under a third (30.3%) of all Income Tax (see Figure 9). By contrast, higher rate Income Tax payers made up 15.7% of the Income Tax paying population but were liable for 32.0% of Income Tax, while additional rate Income Tax payers made up just 2.4% of all Income Tax payers but were liable for 37.7% of total Income Tax liabilities.
Figure 9: Income Tax paying population and share of Income Tax liabilities by marginal rate
| Tax year : Taxpayers or Income Tax | Basic rate | Higher rate | Additional rate | All |
|---|---|---|---|---|
| 2023 to 2024 : Taxpayers | 81.9% | 15.7% | 2.4% | 100% |
| 2023 to 2024 : Income Tax | 30.3% | 32.0% | 37.7% | 100% |
| 2026 to 2027 : Taxpayers | 77.9% | 18.9% | 3.2% | 100% |
| 2026 to 2027 : Income Tax | 27.0% | 33.1% | 39.9% | 100% |
Average rates of Income Tax rose with total income up to £500,000; for income ranges above this the average Income Tax rate was around 40% (see Figure 10). In 2023 to 2024, the average Income Tax rate was 4.8% for those with incomes from £15,000 to below £20,000, increasing to 9.0% for incomes from £20,000 to below £30,000 and 12.3% for incomes from £30,000 to below £50,000. For incomes within the higher rate tax band, the average Income Tax rate rose to 18.9% for individuals earning between £50,000 and £100,000 and then rose to 29.2% for individuals earning between £100,000 and £150,000. For individuals earning between £150,000 up to but not including £2 million, average Income Tax rates rose to the peak of 40.6% for the group earning between £500,000 and £2 million. The average Income Tax rate decreases to 39.3% for incomes of £2 million or more.
Total Income Tax liabilities of those with income between £15,000 and £20,000 is projected to remain stable between 2023 to 2024 and 2026 to 2027 (see Figure 10). However, Income Tax payers with income over £20,000 are expected to have a larger proportion of total Income Tax liabilities in 2026 to 2027 at 98.5%, compared to 98.1% in 2023 to 2024.
The average Income Tax liability across all income ranges is expected to increase by around £1,030, from £7,470 to £8,510 between 2023 to 2024 and 2026 to 2027, largely due to an increase in the amount of Income Tax liable at the upper end of the income distribution. Individuals with income between £15,000 and £150,000 are expected to see an average increase in their Income Tax liability of around £640 over this period, mostly due to an increase in Income Tax payers with higher earnings.
Figure 10: Total Income Tax liabilities and average rate of Income Tax by income range in 2023 to 2024 and 2026 to 2027
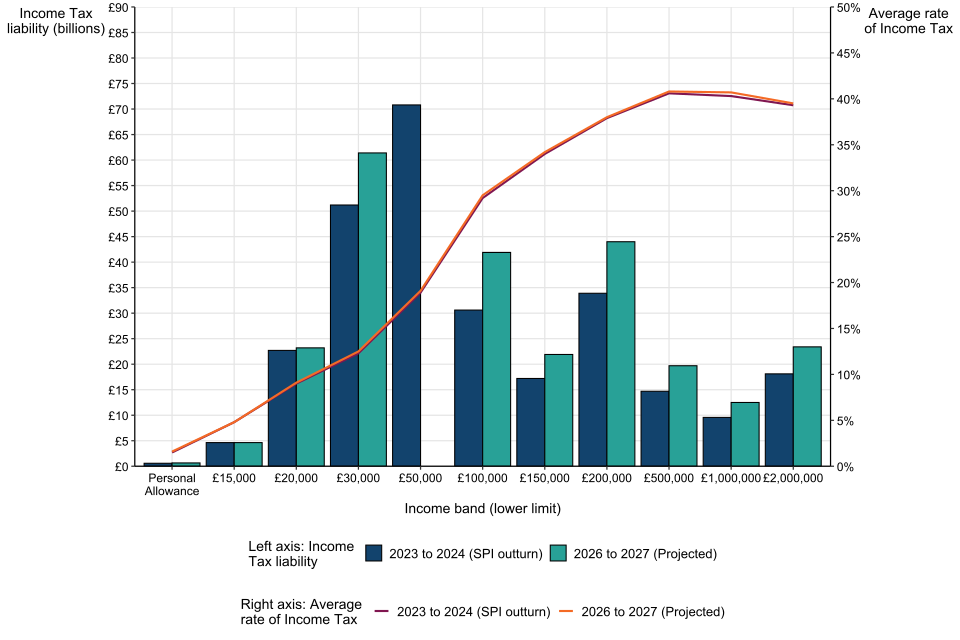
The average rate of Income Tax across all Income Tax payers is projected to increase from 17.9% in 2023 to 2024 to 19.0% in 2026 to 2027. Average rates of Income Tax show increases in 2026 to 2027 compared to 2023 to 2024 across all income groups, except those earning between £15,000 and £20,000 where the average rate remained constant. This is partly due to both the Personal Allowance and higher rate threshold being frozen, and income growth across all bands meaning there are more Income Tax payers moving into higher earning Income Tax bands that drives up the overall average.
Average Income Tax rates for individuals with income below £100,000 are projected to remain relatively stable in 2026 to 2027 compared to 2023 to 2024 with the most marked change in the income groups of £20,000 to £30,000 and £30,000 to £50,000 rising 0.2 percentage points.
For those with incomes between £100,000 and £2 million, average tax rates are projected to increase by between 0.1 and 0.4 percentage points in each income group between 2023 to 2024 and 2026 to 2027. The largest increase is for those with incomes between £100,000 and £200,000, while the smallest increase is for those with incomes between £200,000 and £500,000. The remaining income groups are projected to see increases of between 0.2 and 0.3 percentage points. For these individuals, some of this increase from 2023 to 2024 onwards can be attributed to the reduction of the additional rate threshold from £150,000 to £125,140.
6. Table 2.6 – Income Tax liabilities by income source, tax band and marginal rate
Table 2.6 provides data on total Income Tax liabilities by income source (earnings, savings and dividends) and rate of Income Tax. This is provided for all Income Tax payers and for each marginal rate band, which is the tax band that an extra pound sterling of income would be charged at. Income Tax liabilities are classified into three broad sources of income assessable for Income Tax: earnings, savings interest and dividends. Earnings are defined as including pay from employment, profits from self-employment, private and occupational pensions, retirement annuities, state retirement pensions, foreign income, taxable benefits, income from property, and taxable social security income.
Estimates of total Income Tax liabilities for given tax bands include tax accrued on incomes in that band by all Income Tax payers, for example totals for basic rate tax include the liabilities of basic, higher, and additional rate Income Tax payers.
Please see Table 2.6a for historic years before 2023 to 2024.
6.1 Income Tax liabilities by income source
In 2023 to 2024, Income Tax liabilities totalled £274 billion of which 92.2% were due on earnings, with a further 5.8% from dividends and 2.0% from savings interest. The total Income Tax liabilities for 2026 to 2027 is projected to be £347 billion, with the proportion from earnings decreasing slightly to 91.9%, the proportion from dividends decreasing to 5.7% and the proportion from savings interest increasing to 2.4%.
6.2 Income Tax liabilities by tax band
In 2023 to 2024, 47.6% of total Income Tax liabilities were due at the basic rate of Income Tax (applying to the first £37,700 of taxable income in that year), compared with 28.2% at the higher rate (taxable income above £37,700 and up to £150,000) and 24.1% at the additional rate. The starting rate for savings is 0% so there are no starting rate Income Tax payers.
The composition of how Income Tax liabilities at each rate are expected to change in 2026 to 2027 compared with 2023 to 2024 is shown in Figure 11. Income Tax liabilities at the basic rate (including at savers rate) are projected to decrease by 2.1 percentage points to 45.5% in 2026 to 2027, while liabilities at the higher rate are projected to increase by 0.6 percentage points to 28.8% and those at the additional rate are projected to increase by 1.6 percentage points to 25.7%.
Further, the largest changes to the composition of how much Income Tax is liable at each rate are seen in 2024 to 2025 (shown in Figure 11). There is a large increase in the Income Tax liabilities at the additional rate in 2024 to 2025 compared to 2023 to 2024 of 1.3 percentage points. The increase in liabilities at the additional rate has decreased the share of Income Tax liabilities at the basic and higher rate. Income Tax liabilities at the basic rate (including the savers rate) shows a projected decrease of 0.7 percentage points to 45.9% in 2025 to 2026 compared to 46.6% in 2024 to 2025. Income Tax liabilities at the higher rate are projected to increase by 0.6 percentage points to 28.5% in 2025 to 2026 up from 27.9% in 2023 to 2024.
Figure 11: Proportion of total Income Tax liabilities at basic, higher and additional rate
| Tax year | Liabilities at Basic Rate | Liabilities at Higher Rate | Liabilities at Additional rate |
|---|---|---|---|
| 2023 to 2024 | 47.6% | 28.2% | 24.1% |
| 2024 to 2025 | 46.6% | 27.9% | 25.4% |
| 2025 to 2026 | 45.9% | 28.5% | 25.5% |
| 2026 to 2027 | 45.5% | 28.8% | 25.7% |
The freeze in the Personal Allowance in 2022 to 2023 through the entire period covered by these statistics will contribute to an increase in Income Tax liable at the basic rate. The changes seen at the higher and additional rates suggest a combination of the following:
- the basic rate limit was frozen from 2022 to 2023 onwards, resulting in more Income Tax payers paying the higher rate due to income growth
- the additional rate threshold was fixed at £150,000 since its introduction in 2010 up to and including the 2022 to 2023 tax year, resulting in an increase in the number of additional rate Income Tax payers over time as income grew, meaning more Income Tax was liable at that rate - from April 2023 onwards the additional rate threshold was lowered from £150,000 to £125,140 resulting in the number of additional rate Income Tax payers increasing further from this period onwards
- the introduction of an advanced rate announced in the Scottish Budget 2024 moving more people from paying the higher rate of tax into the additional rate of tax
- the introduction of a dividend rate increase in 2022 to 2023 is estimated to have caused a small amount of dividend income to be forestalled into 2021 to 2022 (see Annex B of the Supporting Documentation) - the first year of the unwind of this impact was in 2022 to 2023, which is expected to reduce Income Tax liabilities at all rates
- the reduction of the additional rate threshold in 2023 to 2024 is estimated to have caused a small amount of dividend income and pay to be forestalled into 2022 to 2023 (see Annex B of the Supporting Documentation) - this reduces the estimated amount of Income Tax liable at the higher rate in 2023 to 2024
6.3 Average rates of Income Tax
As a complement to Table 2.5, average rates of Income Tax by marginal tax rate are also shown in Table 2.6. In 2023 to 2024, average rates of Income Tax are 10.0% for basic rate Income Tax payers, 21.0% for higher rate Income Tax payers, and 37.7% for additional rate Income Tax payers, compared with the tax rates charged on earnings at the basic, higher and additional rates of 20%, 40% and 45%, respectively. The average rates of Income Tax at each marginal rate (meaning the rate applied to the next pound sterling of income) are lower than the tax rate for that tax band because an Income Tax payer is not charged at that rate on all their income (for example, some is charged at a lower rate or is within an allowance and not subject to Income Tax).
For basic rate Income Tax payers, the average rate of Income Tax is projected to progressively increase from 10.0 percentage points in 2023 to 2024 to 10.4 percentage points in 2026 to 2027. The average rate for higher rate Income Tax payers is projected to decrease by 0.2 percentage points from 21.0% in 2023 to 2024 compared to 20.8% in 2026 to 2027. The average rate for additional rate Income Tax payers is projected to decrease by 0.2 percentage points to 37.5% in 2026 to 2027.
Average rates of Income Tax vary over time depending on the number of overall Income Tax payers and the number in each marginal rate band, as well as growth in incomes and changes to Income Tax thresholds and allowances.
7. Related Publications
Users of the Income Tax Liabilities Statistics may also be interested in HMRC’s other publications including the Survey of Personal Incomes (SPI) statistics and Statistics on Income Tax receipts.
8. Contact Information
If you have any queries regarding this publication, please use the contact information below to get in touch.
Statistical contacts: K O’Mara Needs, E Williams, J Linley, J Henderson, C Okoro, personaltax.statistics@hmrc.gov.uk
Media contact: HMRC Press Office, news.desk@hmrc.gov.uk
Publication date: 15 July 2026
Frequency: Published annually
Next publication date: May/June 2027