Why do people come to the UK? (1) To visit
Published 23 August 2018

© Crown copyright 2018
This publication is licensed under the terms of the Open Government Licence v3.0 except where otherwise stated. To view this licence, visit nationalarchives.gov.uk/doc/open-government-licence/version/3 or write to the Information Policy Team, The National Archives, Kew, London TW9 4DU, or email: psi@nationalarchives.gov.uk.
Where we have identified any third party copyright information you will need to obtain permission from the copyright holders concerned.
This publication is available at https://www.gov.uk/government/statistics/immigration-statistics-year-ending-june-2018/why-do-people-come-to-the-uk-1-to-visit
We welcome your feedback
The content and format of the quarterly release and associated data tables is currently being reviewed. This means the release may be subject to change in the future. If you have any comments, or suggestions for the development of this report, please provide feedback by emailing MigrationStatsEnquiries@homeoffice.gov.uk. Please include the words ‘PUBLICATION FEEDBACK’ in the subject of your email.
The Home Office is also running a more general survey on Home Office statistical publications, which covers all Home Office statistical publications.
See section 6 of the About this release section for more details.
Back to ‘Immigration statistics, year ending June 2018’ content page.
This is not the latest release. View latest release.
Data relate to the year ending June 2018 and all comparisons are with the year ending June 2017, unless indicated otherwise.
This section contains data on:
- trends in Visitor visas and arrivals
- Visitor visas by duration
- visits by nationality
Visitor arrivals data are currently based on landing cards completed as people cross the border. See the Home Office’s Response to media reporting on landing cards for more information.
Visitor visa data relate to visas applied for and resolved outside the UK.
More information on non-visitor arrival and visa data by category and nationality is included in ʻWhy do people come to the UK? (2) To work’, ʻWhy do people come to the UK? (3) To study’ and ʻWhy do people come to the UK? (4) For family reasons’.
1. Key facts
In the calendar year 2017 (latest available data by purpose of journey), the number of non-EEA visitor arrivals increased by 3.1 million (30%) to 13.2 million compared to the previous year. This was the highest number of arrivals on record. There have been year-on-year increases in the number of Visitor arrivals since 2012.
There were 2.8 million entry clearance visas granted in the year ending June 2018 and, of these, 2.1 million (77%) were to visit.
The number of Visitor visas granted increased by 5% compared with the previous year. There were notable increases in Visitor visas granted to:
- Indian nationals, up 40,337 (+10%) to 454,658
- Pakistani nationals, up 14,762 (+31%) to 62,987
- South African nationals, up 10,835 (+13%) to 93,096
- Nigerian nationals, up 10,709 (+20%) to 63,825
Chinese (529,327, down 1%) and Indian nationals alone accounted for just under half (46%) of all Visit visas granted.
2. Trends in Visitor arrivals and visas
This section analyses trends of Visit visa applications and outcomes, and trends in arrivals for visit reasons. The latest data on grants of Visit visas are available up to the year ending June 2018. The latest data on arrivals by purpose of journey are available up to the calendar year 2017.
2.1 Visitor arrival trends
In the calendar year 2017 (latest available data by purpose of journey), the number of non-EEA visitor arrivals increased by 3.1 million (30%) compared to the previous year to 13.2 million. This was the highest number of arrivals on record. There have been year-on-year increases in the number of Visitor arrivals since 2012.
Many nationalities, including US nationals, do not normally require a visa to visit the UK. Consequently the number of Visitor visas granted is much lower than the total number of arrivals.
Passenger arrivals are counted each time an individual enters the UK. Where an individual enters more than once in a period, they will be counted each time they enter. This contributes to the overall difference between the total number of Visitor arrivals and Visitor visas granted.
Visitor passenger arrivals1, 2008 to 2017
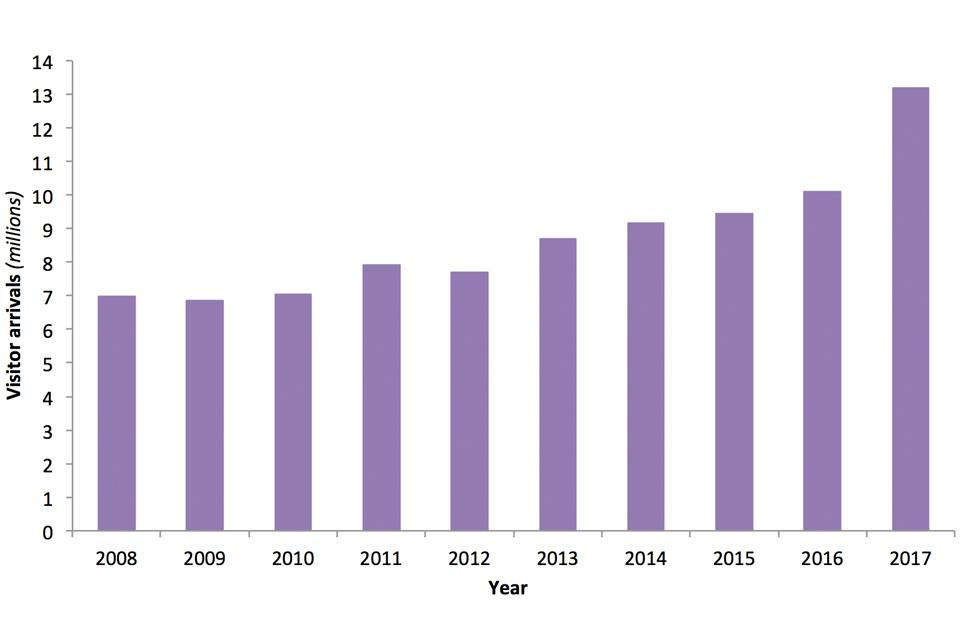
The chart shows Number of Visitor arrivals from 2008 to 2017.
Source:
Table ad 02, (Admissions tables)
Chart note:
- Changes in volumes of Visitor arrivals can be affected by a number of factors. More information can be found in Policy and legislative changes affecting migration to the UK: timeline and the User Guide to Home Office Immigration Statistics.
2.2 Visitor visa trends
In the year ending June 2018, there were 2.8 million entry clearance visas granted and, of these, 77% (2.1 million) were to visit. There were 2.4 million applications for Visitor visas, a 3% increase on the previous year.
Over the same period, there were 2.4 million decisions made on applications. Of these, 2.1 million (88%) were grants.
Visitor visa applications and grants1, year ending June 2009 to the year ending June 2018
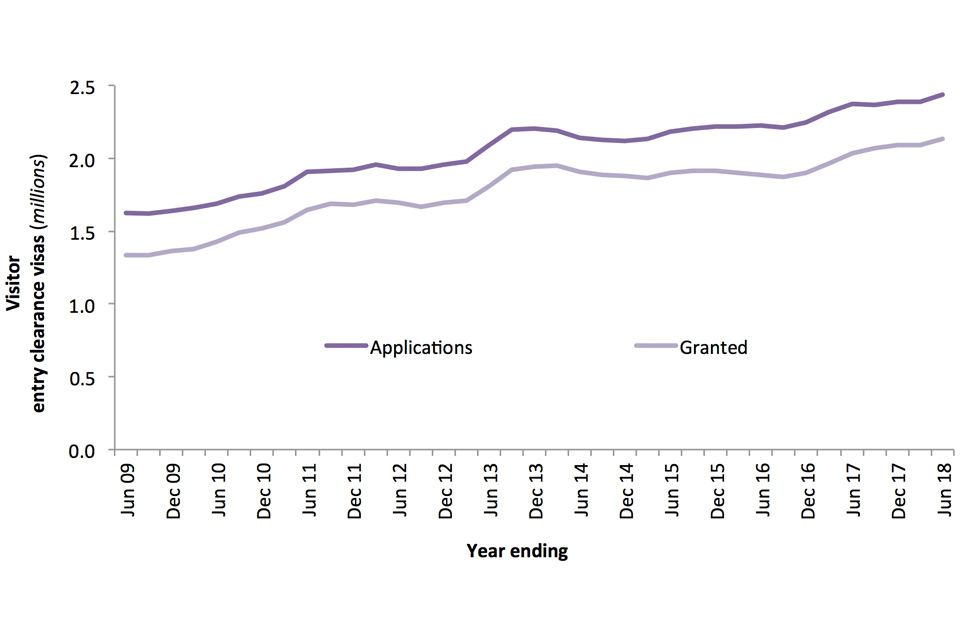
The chart shows Visitor visa applications and grants over the last 10 years.
Source:
Table vi 01 q, (Entry clearance visas tables, volume 1)
Chart note:
- Changes in volumes of Visitor visa applications and outcomes can be affected by a number of factors. More information can be found in Policy and legislative changes affecting migration to the UK: timeline and the User Guide to Home Office Immigration Statistics.
The number of Visitor visas granted has shown a general upward trend over the last 10 years. The 2.1 million visas granted in the year ending June 2018 represent the highest number of grants in the last 10 years. The grant rate of Visitor visas has remained relatively stable over the same period.
3. Visitor visas by duration
Of the 2.1 million Visitor visas granted in the year ending June 2018, 68% (1.4 million) were for up to 6 months, and 32% (0.7 million) were longer-term Visit visas.
Visitor visas are usually issued for up to a maximum of 6 months (or in some cases, up to a maximum of 12 months). Visitor visas that are valid for longer durations (2, 5 or 10 years) can be issued to those who need to visit the UK regularly over a longer period. These allow individuals to stay in the UK for up to a maximum of 6 months on each visit.
4. Visits by nationality
4.1 Visitor passenger arrivals by nationality
This section includes data on arrivals for Visit reasons, broken down by nationality. The latest data on Visit visa arrivals, by nationality, are available up to the end of 2017. All comparisons are with calendar year 2016, unless stated otherwise.
US national arrivals, the largest nationality for visitors to the UK, increased by 1.2 million (47%). US nationals do not need a visa to visit the UK for up to 6 months, which is reflected in their much lower number of Visitor visas granted.
There were notable decreases for Kuwaiti (-40,000), Emirati (-22,300), Qatari (-20,100) and Omani (-6,030) nationals. Nationals from these countries are eligible for Electronic Visa Waivers (EVW) to visit the UK. Decreases for nationalities that are part of the Electronic Visa Waiver scheme may reflect changes in the process for the collection of the data rather than a genuine decrease.
4.2 Visitor visas by nationality
Of the 2.1 million Visitor visas granted in the year ending June 2018, the nationalities that were granted the highest numbers were:
- Chinese (529,327), accounting for 25% of Visitor visas granted (down 1 percentage point on the previous year)
- Indian (454,658), accounting for 21% of Visitor visas granted (up 1 percentage point on the previous year)
- Russian (125,957), accounting for 6% of Visitor visas granted (no change from the previous year)
The following diagram shows the country of nationalities with the largest changes in the number of Visitor visas granted over the last year.

Not supplied by author.
Source:
Table vi 06 q o, (Entry clearance visas tables, volume 3)
The decrease in grants of Visitor visas to Chinese nationals may be partly explained by the introduction of the 2-year Visit visa pilot in January 2016. The increase in longer term Visitor visas is likely to have an effect on the number of reapplications by Chinese nationals, and therefore the number of grants may be lower as a result.
Kuwaiti visitors were able to visit the UK without a visa from February 2016 as part of the Electronic Visa Waiver scheme, which likely accounts for the large decrease in Visitor grants for Kuwaiti nationals seen since.
5. Data tables
Data on visas and passenger arrivals can be found in the following tables:
Entry clearance visas tables volume 1
Entry clearance visas tables volume 2
Entry clearance visas tables volume 3
Admissions tables