Why do people come to the UK? (2) To work
Published 23 August 2018

© Crown copyright 2018
This publication is licensed under the terms of the Open Government Licence v3.0 except where otherwise stated. To view this licence, visit nationalarchives.gov.uk/doc/open-government-licence/version/3 or write to the Information Policy Team, The National Archives, Kew, London TW9 4DU, or email: psi@nationalarchives.gov.uk.
Where we have identified any third party copyright information you will need to obtain permission from the copyright holders concerned.
This publication is available at https://www.gov.uk/government/statistics/immigration-statistics-year-ending-june-2018/why-do-people-come-to-the-uk-2-to-work
We welcome your feedback
The content and format of the quarterly release and associated data tables is currently being reviewed. This means the release may be subject to change in the future. If you have any comments, or suggestions for the development of this report, please provide feedback by emailing MigrationStatsEnquiries@homeoffice.gov.uk. Please include the words ‘PUBLICATION FEEDBACK’ in the subject of your email.
The Home Office is also running a more general survey on Home Office statistical publications, which covers all Home Office statistical publications.
See section 6 of the About this release section for more details.
Back to ‘Immigration statistics, year ending June 2018’ content page.
This is not the latest release. View latest release.
Data relate to the year ending June 2018 and all comparisons are with the year ending June 2017, unless indicated otherwise.
This section contains data for non-EEA nationals on:
- Work-related visas (including Tier 2 (Skilled) work visas)
- Sponsored work visa applications
1. Key facts
There were 167,271 work-related visas granted in the year ending June 2018, 2% higher than the previous year. This included:
- 5,502 Tier 1 (High-value) visas, up 17%
- 96,376 Tier 2 (Skilled) visas, up 4%
- 40,360 Tier 5 (Youth mobility and temporary worker) visas, down 3%
2. Trends in work-related visas
In the year ending June 2018, there were 167,271 work-related visas granted, an increase of 2% compared with the previous year.
Following the introduction of the Points Based System (PBS), which included a range of measures to tighten the immigration system, the number of work-related visa applications and grants fell between the year ending June 2008 and the year ending June 2013 (by 29% and 21% respectively). The numbers began to increase between the year ending June 2013 and the year ending March 2015, and have been relatively stable since. Tier 2 (Skilled) work has steadily increased in recent years.
Over the last 10 years, the overall grant rate for work-related visas has increased from 80% to 95%, which has in part been driven by an increase in sponsored work categories (Tier 2 Skilled work and Tier 5 Youth mobility and temporary workers), which now accounts for 82% of the total.
Work-related visas applications, grants and refusals, year ending June 2009 to the year ending June 2018
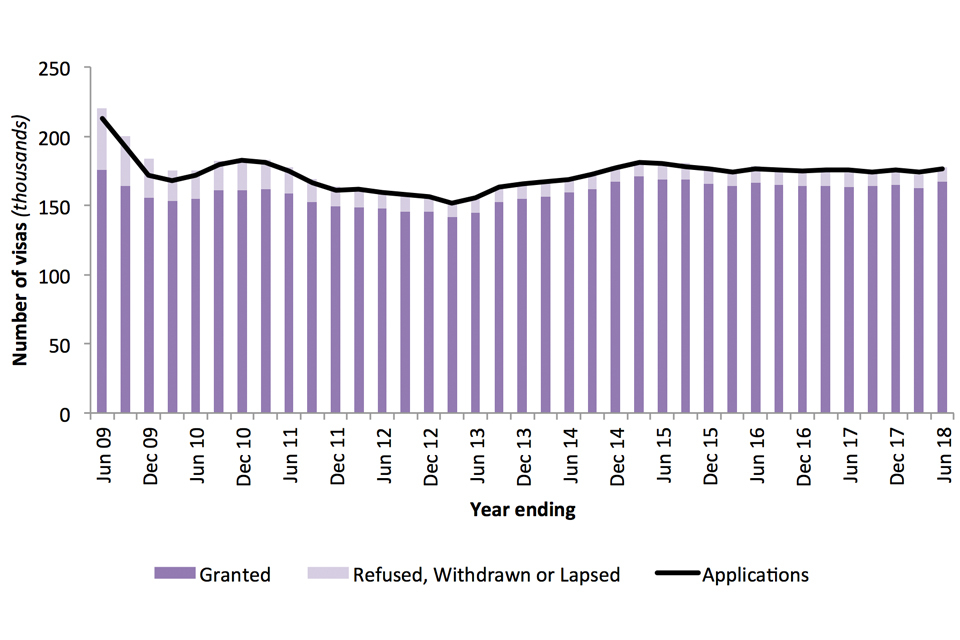
The chart shows the number of work-related visas applications, grants and refusals over the last 10 years.
Source:
Table vi 01 q, (Entry clearance visas tables, volume 1)
2.1 Work-related visas by type of visa
The majority of the 167,271 work-related visas granted in the year ending June 2018 were in the Tier 2 (Skilled) work and Tier 5 (Youth mobility and temporary worker) categories, accounting for 96,376 (58%) and 40,360 (24%) of the total.
Since the year ending June 2013, Tier 2 (Skilled) work visa grants have increased by 32% (23,471) whilst Tier 5 (Youth mobility and temporary worker) visas increased, by 5% (1,963), over the same period.
Over the same period, grants for current Tier 1 categories (including investors and entrepreneurs) increased 18% to 4,673. This excludes Tier 1 General, Tier 1 Post-study (which are now closed) and pre-PBS routes.
Tier 1 General and Tier 1 Post-study accounted for 30,656 grants in the year ending June 2009 and 26,524 in the year ending June 2010 but have been closed to new entrants following operational evidence that these routes were not working as intended.
Work-related visas granted, by category1,2, year ending June 2009 to the year ending June 2018
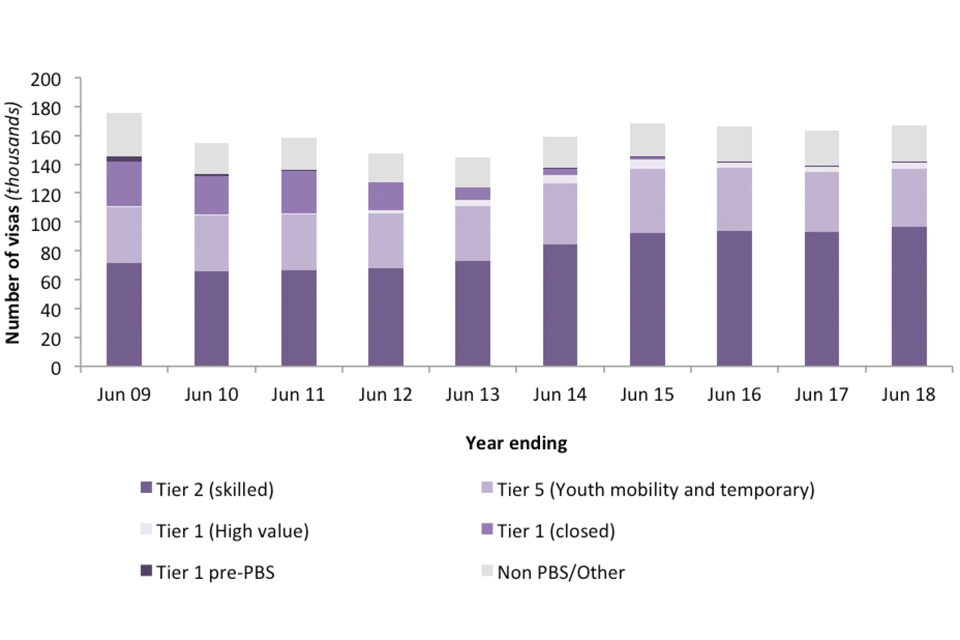
The chart shows the number of work-related entry clearance visas granted by category, over the last 10 years.
Source:
Table vi 01 q, (Entry clearance visas tables, volume 1)
Chart notes:
- Tier 1 (closed) includes the Tier 1 General, and Tier 1 Post-study categories. These categories were closed to new entrants following operational evidence that these routes were not working as intended.
- Tier 2 (Skilled) and Tier 5 (Youth mobility and temporary) include pre-PBS equivalents.
According to estimates from the Labour Force Survey, published in the ONS UK labour market: August 2018 release, the number of people employed in the UK increased by 313,000 (to 32.39m) in April to June 2018 compared with a year earlier. This was driven by increases in non-EU and UK nationals. The number of non-EU nationals in employment increased by 74,000 (to 1.27m), while the number of EU nationals in employment decreased by 86,000 (to 2.28m).
3. Tier 2 (Skilled) work visas
3.1 Tier 2 (Skilled) work visas by nationality
In the year ending June 2018, there were 96,376 Tier 2 (Skilled) work visas granted, up 4% compared with the previous year (92,800). The top 5 nationalities accounted for 76% of all Tier 2 visas granted. Indians accounted for the majority of grants (56%), with the next most common nationality being the US nationals (10%).
Tier 2 (Skilled) work visas granted, by nationality (top 5), year ending June 2018 compared to the year ending June 2017
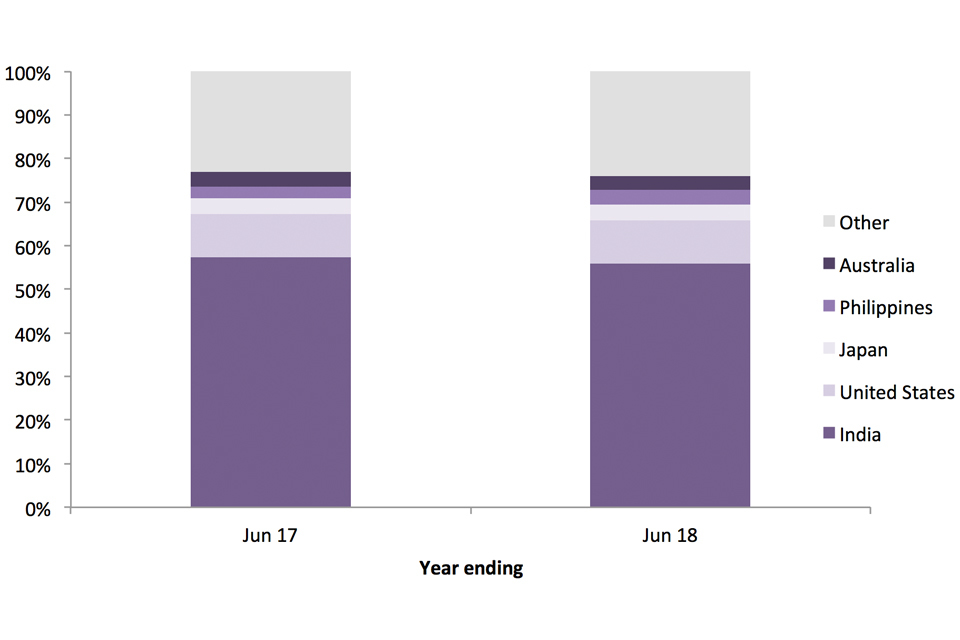
The chart shows the proportion of Tier 2 (Skilled) work entry clearance visas granted by nationality in the latest year compared with a year earlier.
Source:
Table vi 06 q w, (Entry clearance visas tables, volume 2)
3.2 Trends in Tier 2 (Skilled) work visas, by detailed visa type
Tier 2 of the Points Based System is the primary route for economic migration to the UK. Broadly, the route is for skilled workers from outside the European Economic Area (EEA) who have an offer of employment in the UK in an occupation classed as skilled to NQF6 or above.
Tier 2 was implemented in November 2008. There are 4 routes within Tier 2: Tier 2 (General), Tier 2 (Intra-company Transfer), Tier 2 (Minister of Religion) and Tier 2 (Sportsperson).
The majority of Tier 2 visas are ‘Intra-company transfers’ (ICT). The number of ICT Tier 2 grants to main applicants has increased by 22% from 26,553 in the year ending June 2010 to 32,355 in the year ending June 2018.
The number of grants for non-ICT Tier 2 categories (largely accounted for by Tier 2 General, and dependants), excluding pre-PBS equivalents, increased by 11% over the same period.
Tier 2 (Skilled) work visas granted by visa type, year ending June 2010 to the year ending June 20184
| Year ending | June 2010 | June 2011 | June 2012 | June 2013 | June 2014 | June 2015 | June 2016 | June 2017 | June 2018 |
|---|---|---|---|---|---|---|---|---|---|
| Tier 2 visas granted | 66,145 | 66,523 | 67,730 | 72,905 | 84,613 | 92,567 | 93,980 | 92,800 | 96,376 |
| of which: | |||||||||
| Tier 2 - Intra Company Transfers (ICT) | 26,553 | 29,412 | 29,569 | 30,932 | 34,882 | 36,462 | 36,808 | 34,941 | 32,355 |
| Tier 2 - ICT dependants1 | : | 3,031 | 16,964 | 19,734 | 22,774 | 23,880 | 23,604 | 24,527 | 27,235 |
| Tier 2 General | 11,014 | 7,748 | 8,927 | 10,176 | 12,995 | 16,583 | 18,238 | 18,711 | 20,139 |
| Other Tier 2 | 627 | 606 | 517 | 544 | 510 | 567 | 479 | 467 | 508 |
| Tier 2 Dependants2 | 21,194 | 23,220 | 10,755 | 11,142 | 13,298 | 15,023 | 14,746 | 14,047 | 15,948 |
| Pre-PBS equivalents3 | 6,757 | 2,506 | 998 | 377 | 154 | 52 | 105 | 107 | 191 |
Source:
Table vi 01 q, (Entry clearance visas tables, volume 1)
Table notes:
- Prior to Q2 2011, ‘Tier 2 - ICT dependants’ were not separately identifiable from other ‘Tier 2 dependants’. These are included in ‘Tier 2 dependants’ before this period, and as their own category for Q2 2011 onwards.
- ‘Tier 2 dependants’ excludes ‘Tier 2 – ICT dependants’ (which are included in their own category) from the year ending June 2011 onwards.
- Pre-PBS equivalents includes main applicants and dependants.
- : = not available.
4. Sponsored work visa applications
Applicants for visas (and extensions) for Tier 2 (Skilled) work and for Tier 5 (Youth mobility and temporary worker) must obtain a certificate of sponsorship (CoS) from a registered employer. Any organisation that wishes to sponsor a worker must be registered on the Home Office’s Register of Sponsors.
Tier 2 (General) is currently subject to a cap on the number of CoS that can be allocated to employers for newly hired employees earning less than £159,600 per year, or for dependants of Tier 4 students who wish to switch into Tier 2 (General). The sponsor must apply for an allocation for these ‘restricted’ CoS on a case-by-case basis to be considered at a monthly allocation meeting, held by the Home Office. Details of the outcome of the monthly allocation process are published by UK Visas and Immigration.
On 15 June 2018, the government announced that doctors and nurses are to be excluded from the cap on skilled worker visas. This will not have impacted on the statistics published in this edition.
Further information about the CoS allocation process is given in the User Guide and on the UK visa sponsorship for employers section of GOV.UK.
4.1 Sponsored skilled work visa applications by industry sector
In the year ending June 2018, five sectors accounted for the vast majority (87%) of skilled work visa applications, with almost two out of every five accounted for by the IT and communications sector.
- Information and communication (39%)
- Professional, scientific and technical (16%)
- Human health and social work (14%)
- Financial and insurance activities (12%)
- Education (6%)
Data on sponsorship by sector is available from 2010. From the year ending June 2011 to the year ending June 2018, each of these 5 sectors had an increase in the number of applications (up 30%, 28%, 294%, 16% and 123%, respectively).
Tier 2 (Skilled work) visa applications1, by sector, year ending June 2011 to the year ending June 2018
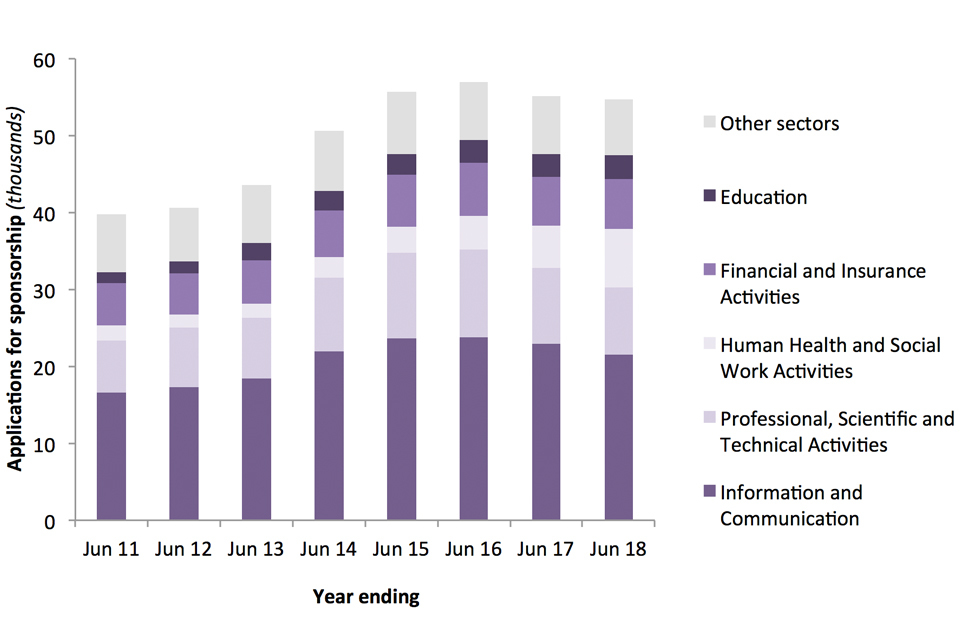
The chart shows the number Tier 2 (Skilled work) visa applications by sector, over the last 8 years.
Source:
Table cs 03 q, (Sponsorship tables)
Chart note:
- Main applicants only.
5. Data tables
Data on immigration for work can be found in the following tables:
Sponsorship tables
Entry clearance visas tables volume 1
Entry clearance visas tables volume 2
Entry clearance visas tables volume 3
Admissions tables
Extensions tables
Settlement tables
European Economic Area (EEA) tables