How many people come to the UK each year?
Published 23 August 2018

© Crown copyright 2018
This publication is licensed under the terms of the Open Government Licence v3.0 except where otherwise stated. To view this licence, visit nationalarchives.gov.uk/doc/open-government-licence/version/3 or write to the Information Policy Team, The National Archives, Kew, London TW9 4DU, or email: psi@nationalarchives.gov.uk.
Where we have identified any third party copyright information you will need to obtain permission from the copyright holders concerned.
This publication is available at https://www.gov.uk/government/statistics/immigration-statistics-year-ending-june-2018/how-many-people-come-to-the-uk-each-year
We welcome your feedback
The content and format of the quarterly release and associated data tables is currently being reviewed. This means the release may be subject to change in the future. If you have any comments, or suggestions for the development of this report, please provide feedback by emailing MigrationStatsEnquiries@homeoffice.gov.uk. Please include the words ‘PUBLICATION FEEDBACK’ in the subject of your email.
The Home Office is also running a more general survey on Home Office statistical publications, which covers all Home Office statistical publications.
See section 6 of the About this release section for more details.
Back to ‘Immigration statistics, year ending June 2018’ content page.
This is not the latest release. View latest release.
Data relate to the year ending June 2018 and all comparisons are with the year ending June 2017, unless indicated otherwise.
This section contains data on:
- the number of arrivals by people entering the UK
- grants of Entry clearance visas to individuals outside the UK; including dependants unless stated otherwise
1. Key facts
There were 139.2 million passenger arrivals in the year ending June 2018, including returning UK residents, an increase of 4.7 million compared to the previous year and a record number. This increase was divided between:
- 1.2 million more arrivals by British, other EEA and Swiss nationals (up 1% to 117.9 million)
- 3.5 million more by non-EEA nationals (up 19% to 21.3 million)
The majority of non-EEA nationals do not require a visa to visit or transit the UK; however they do require a visa to come for other reasons. There were over 2.8 million visas granted in the year ending June 2018, of these, just over 2.1 million (77%) were to visit and 8% were for study.
2. Passenger arrivals
It is estimated that there were 139.2 million passenger arrivals in the year ending June 2018, including returning UK residents, an increase of 4.7 million compared to the previous year and a record number. This increase was divided between:
- 1.2 million more arrivals by British, other EEA and Swiss nationals (up 1% to 117.9 million)
- 3.5 million more by non-EEA nationals (up 19% to 21.3 million)
Passenger arrivals1 to the UK by nationality group and reason for arrival, 2017
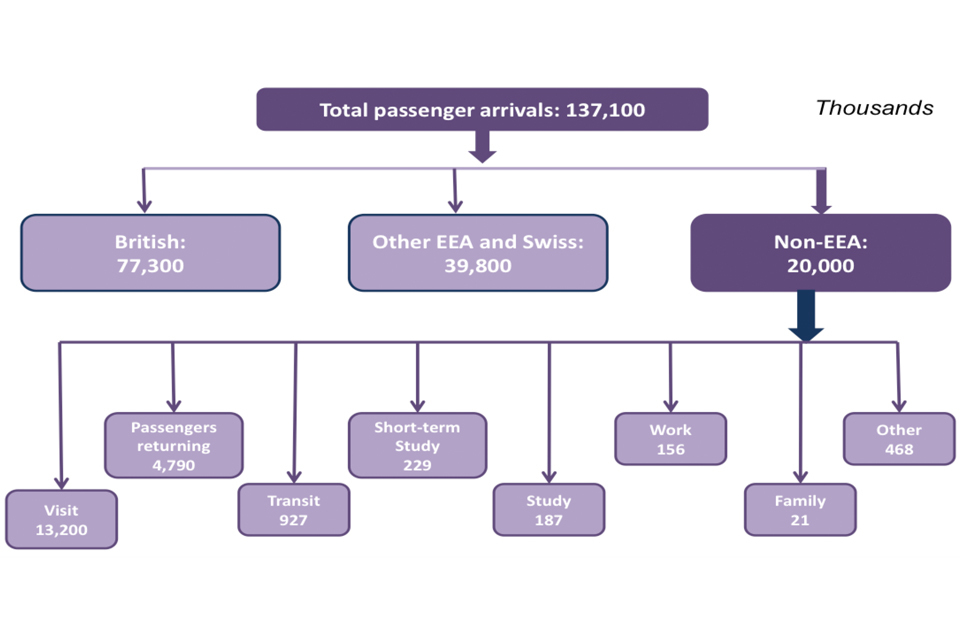
The chart shows the number of passenger arrivals to the UK in 2017 (in thousands).
Source:
Table ad 01 and 02, (Admission tables)
Chart note:
- The data show the number of occasions when a person entered the UK, not the number of distinct individuals.
Passenger arrivals to the UK, by nationality group, 2008 to 2017
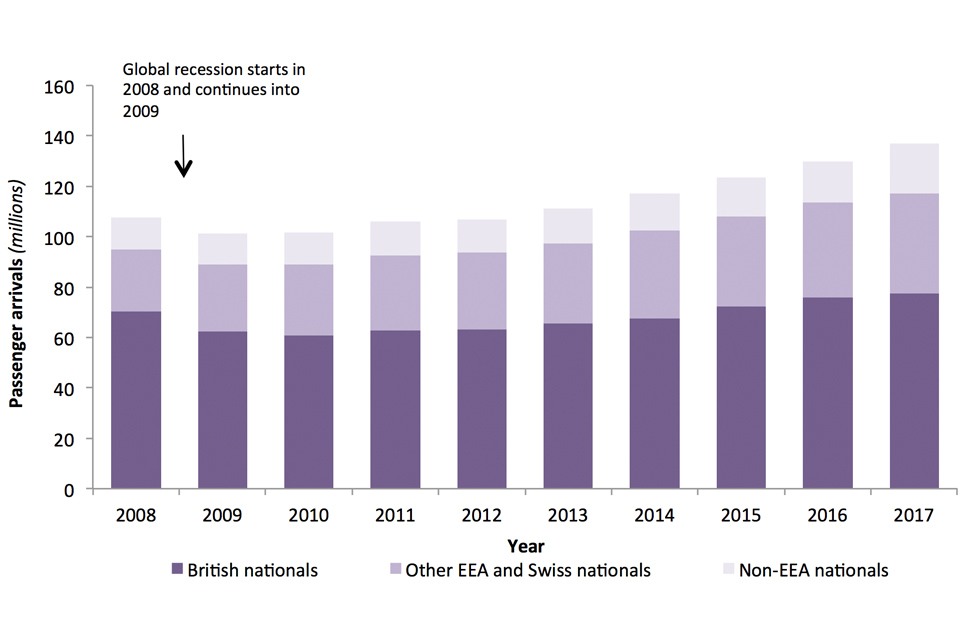
The chart shows the number of passenger arrivals to the UK, by nationality group over the last 10 years.
Source:
Table ad 01, (Admissions tables)
2.1 Non-EEA national arrivals
Data in this section relate to the period 2017. This is the latest period for which data on non-EEA nationals arriving in the UK, broken down by nationality, are available.
Of the 20.0 million non-EEA nationals granted leave to enter the UK in 2017, 35% (7.1 million) were nationals of North American countries and a quarter (5.0 million) were nationals of South and East Asian countries.
The nationalities that were granted the highest numbers of leave to enter the UK in 2017 were:
- US citizens (5.73 million, up 25%)
- Indian (1.46 million, up 26%)
- Australian (1.43 million, up 22%)
- Chinese (1.39 million, up 29%)
- Canadian (1.32 million, up 20%)
These top 5 nationalities accounted for 57% of all non-EEA nationals arriving into the UK in 2017.
Passenger arrivals1 by non-EEA nationals, by purpose of journey, 2013 to 2017
| Thousands | 2013 | 2014 | 2015 | 2016 | 2017 | Change: latest year | Percentage change |
|---|---|---|---|---|---|---|---|
| Total arrivals | 14,000 | 14,600 | 15,300 | 16,300 | 20,000 | +3,690 | +23% |
| Work | 156 | 163 | 171 | 181 | 156 | -24 | -13% |
| Study (excl short term) | 199 | 193 | 185 | 180 | 187 | +8 | +4% |
| Short-term study3 | 263 | 280 | 306 | 251 | 229 | -21 | -9% |
| Family | 23 | 22 | 22 | 20 | 21 | +0.2 | +1% |
| Visitors | 8,690 | 9,160 | 9,440 | 10,100 | 13,200 | +3,080 | +30% |
| Persons in-transit | 1,190 | 1,200 | 1,190 | 743 | 927 | +184 | +25% |
| Passengers returning2 | 3,130 | 3,240 | 3,510 | 4,310 | 4,790 | +480 | +11% |
| Other | 351 | 398 | 462 | 478 | 468 | -9 | -2% |
Source:
Table ad 02, (Admission tables)
Table notes:
- The data show the number of occasions when a person entered the UK, not the number of distinct individuals.
- Passengers returning are people who have previously arrived in the UK on a non-visit visa. They include those settled in the UK and who have been absent for less than two years, and those subject to a limited leave to enter who have returned within the time limit of that leave. Their initial arrival will have been counted in one of the specific arrival categories in the relevant time period.
- The Short-term study category (previously described as ‘Student visitor’) allows individuals to come to the UK for 6 months (or 11 months if they will be studying an English Language course) and cannot extend their stay (further details at Short-term study visa and the Study section). For both visitors and short-term study, non-visa nationals do not require a visa for visits of up to 6 months, so total figures for arrivals are not directly comparable with total visitor or student visitor visas.
3. Entry clearance visas
There were 3,124,717 applications for an entry clearance visa in the year ending June 2018. In the same period 2,760,359 applications were granted which accounted for 88% of all decisions in the period. This continues the upward trend in the number of grants seen over the last 10 years.
Entry clearance visas granted, year ending June 2009 to the year ending June 2018
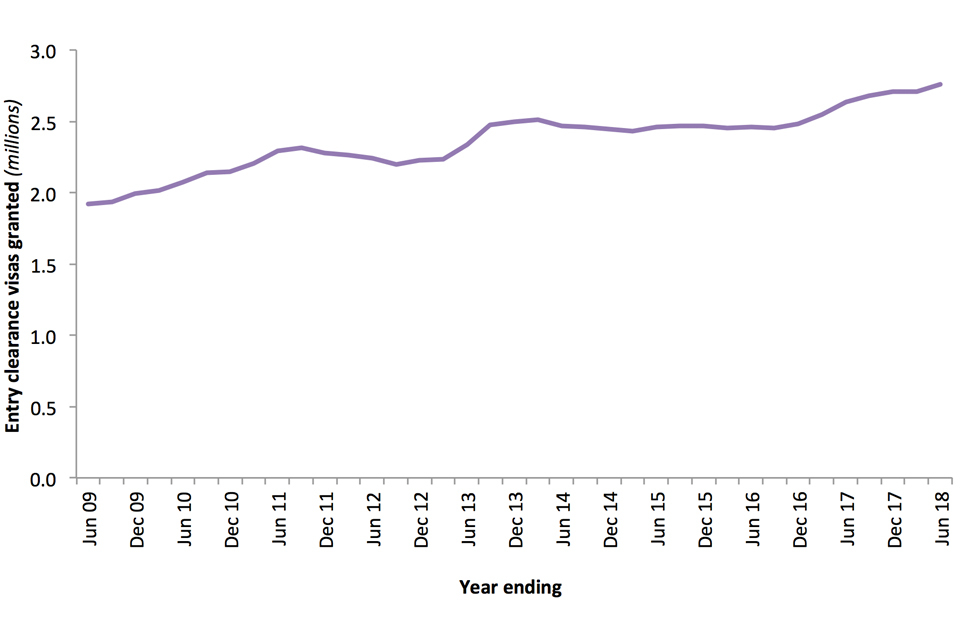
The chart shows the number of entry clearance visas granted over the last 10 years.
Source:
Table vi 01 q, (Entry clearance visas tables, volume 1)
Entry clearance visa applications and outcomes2, by visa type, year ending June 2018
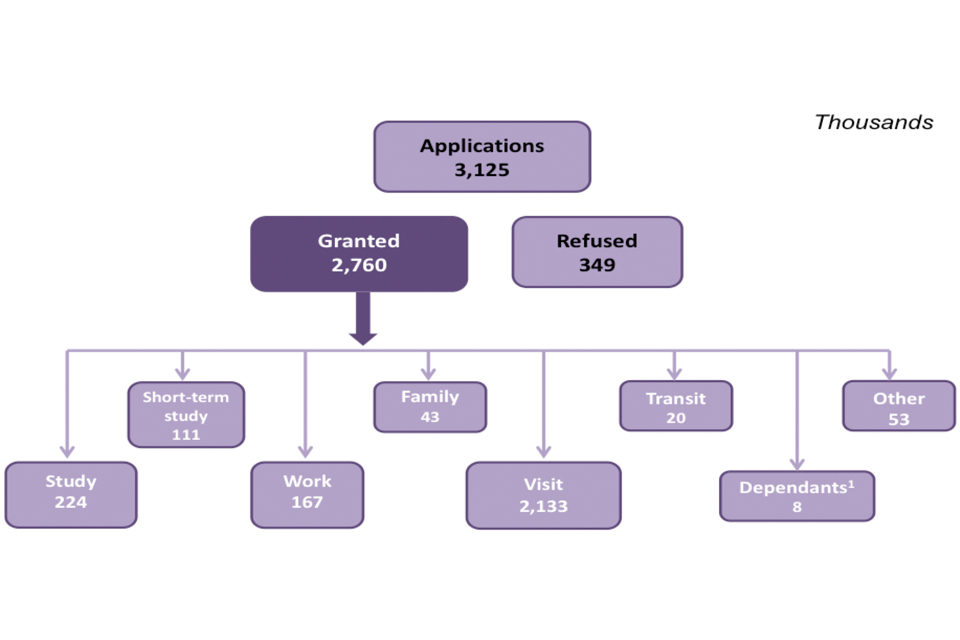
The chart shows the number of entry clearance visa applications and grants in 2017 (in thousands).
Sources:
Table vi 01 q, (Entry clearance visas tables, volume 1)
Table vi 06 q o, (Entry clearance visas tables, volume 3)
Chart notes:
- Dependants joining or accompanying family members.
- The volume of visas granted is lower than the non-EEA national arrivals, as some nationalities do not need a visa (for a visit of 6 months or less) to enter the UK. Individuals may also enter the country multiple times on one visa.
4. Data tables
Further data on arrivals are available in Admissions tables ad 01 to ad 04.
Further data on Entry clearance visas and sponsored visa applications for the Work, Study and Family routes (described further in the Work topic, Study topic and Family topic) can be found in the following tables:
Visas tables volume 1
Visas tables volume 2
Visas tables volume 3
Sponsorship tables