Households Below Average Income: an analysis of the UK income distribution: FYE 1995 to FYE 2023
Updated 27 March 2025

© Crown copyright 2025
This publication is licensed under the terms of the Open Government Licence v3.0 except where otherwise stated. To view this licence, visit nationalarchives.gov.uk/doc/open-government-licence/version/3 or write to the Information Policy Team, The National Archives, Kew, London TW9 4DU, or email: psi@nationalarchives.gov.uk.
Where we have identified any third party copyright information you will need to obtain permission from the copyright holders concerned.
This publication is available at https://www.gov.uk/government/statistics/households-below-average-income-for-financial-years-ending-1995-to-2023/households-below-average-income-an-analysis-of-the-uk-income-distribution-fye-1995-to-fye-2023
The Households Below Average Income (HBAI) report presents information on UK living standards based on household income measures for financial year ending (FYE) 2023. Estimates are provided for average incomes, income inequality, and for the number and percentage of people living in low-income households. The statistics are the UK’s primary source of poverty estimates and, with a larger sample size, are also the main source on household incomes.
The HBAI statistics are commonly referred to as ‘poverty statistics’ which show the number or percentage of people living in poverty. This publication uses terms such as ‘income statistics’ and ‘people living in low-income households’ to describe more precisely what the data reflects. Although low income is a significant aspect of poverty, there are other aspects of poverty too. This publication also includes measures of ‘material deprivation’, which provide an indication of peoples’ ability to access or afford a range of everyday goods and services. Supporting statistics are also provided on household food security levels and prevalence of food bank usage for all individuals in the UK, including those in low-income households.
Comparison of changes in our headline low income and material deprivation statistics between years are made by rounding to the nearest percentage point for each year. This means that changes reported in the narrative do not always match visual differences between the levels displayed in the charts. Where changes are statistically significant, they identified in the commentary and are marked as not statistically significant [ns] or as statistically significant [s] in our accompanying data tables.
Family Resources Survey (FRS) fieldwork during FYE 2023
During the survey years spanning the coronavirus (COVID-19) pandemic, FRS interviewing was conducted by telephone rather than using the established face-to-face method. Fieldwork operations during FYE 2023 gradually returned to the arrangements in place prior to the pandemic.
In Great Britain, survey fieldwork operations used face-to-face interviewing as the preferred method of data collection for the duration of the year. Telephone interviewing was retained as an alternative based on household preference and interviewer availability. In Northern Ireland, a return to prioritising face-to-face interviewing was rolled out fully by interviewers from July 2022. Across the UK, 72% of FRS households were interviewed face-to-face during FYE 2023.
This year, we have enhanced confidence in data quality due to the return of traditional fieldwork methods and the larger achieved sample size of 25 thousand households, some 30% larger than was achieved in FYE 2020, and 50% higher than FYE 2022. As with previous years, we have completed extensive quality assurance of all published estimates, including comparing changes with external data sources, and analysing subgroups in detail. The achieved sample compares well with FYE 2020, and representativeness has improved on what was observed during the pandemic.
We continue to advise users that changes in estimates over recent years should be interpreted being mindful of the differences in data collection approaches across the period and the effect this had on sample composition. Details of this can be found in the technical reports which were issued alongside the FYE 2021 and FYE 2022 statistical releases. In this year’s report we continue to make assessments of observed changes in the data compared with both FYE 2022 and with pre-pandemic trends and estimates.
Annex 5 in the HBAI Quality and Methodology Information Report provides more detail on the use of a mixed mode in the FRS in FYE 2023, how this affected the overall FRS sample, and the degree of impact this had on the HBAI statistics.
1. Main stories
The statistics presented in this release show that:
- there was a decrease in real terms median household income between FYE 2022 and FYE 2023. The decrease was 0.5% before housing costs (BHC) and 1.5% after housing costs (AHC);
- most of the income distribution experienced a fall in real household incomes (BHC), with slightly larger reductions (averaging around 2%) seen in the bottom half of the income distribution, and those in the top 10% of the distribution recording small increases in real terms BHC incomes;
- income inequality (measured by the Gini Coefficient) increased slightly in FYE 2023, both before and after housing costs. The level has remained broadly stable since FYE 2011;
- the percentage of individuals in relative low income increased before housing costs, and both before and after housing costs for absolute low income measures;
- the largest increases in low-income measures are seen for children, with absolute measures showing the most increase. Changes in BHC rates were slightly higher than AHC;
- low-income rates for working age adults are broadly flat compared with FYE 2022, with pensioner BHC rates showing small increases, and pensioner AHC rates flat or falling;
- there was a statistically significant increase in the percentage of pensioners in material deprivation compared to FYE 2020;
- estimates of the percentage of children in combined low income and material deprivation have also increased since FYE 2020, but they are stable for working age adults over the same time period;
- the percentage of individuals in food secure households reduced for all age groups, and reductions were greater for those in low-income households. All estimates are at their lowest levels since their introduction in FYE 2020;
- the percentage of individuals in households who had accessed a food bank in the 30 days prior to their Family Resources Survey (FRS) interview has increased since FYE 2022. Those in low-income households remain more likely to have used a food bank. The largest increases in household food bank usage were recorded for children;
- estimates of the percentage of individuals in households who had used a food bank during the 12 months prior to their interview were more stable.
Note: all FYE 2023 estimates of material deprivation, including when combined with low income, are not directly comparable to FYE 2021 and FYE 2022 due to measurement issues during the coronavirus (COVID-19) pandemic.
Median Household Income - Decrease to £621 (BHC) and £545 (AHC) in FYE 2023
Figure 1: Median Weekly Household Income, FYE 2003 to FYE 2023

Between FYE 2022 and FYE 2023, average (median) household net equivalised disposable income slightly decreased in real terms (i.e. taking account of inflation). The decrease was greater for incomes after housing costs. Weekly FYE 2023 household incomes are estimated at £621 (BHC) and £545 (AHC) respectively, the same as measured in FYE 2021.
Income Inequality – Gini coefficient increase for BHC and AHC
Figure 2: Income Inequality, FYE 2003 to FYE 2023

A standard international indicator used to summarise inequality in individual income is the Gini coefficient. The Gini coefficient ranges between 0% and 100%, where 0% indicates that income is shared equally among all individuals and 100% indicates the extreme situation where one individual has all a country’s income. Therefore, the lower the value of the Gini coefficient, the more equally income is distributed across all individuals.
In FYE 2023, the Gini coefficient increased by 1 percentage point for both BHC and AHC income, to 35% (BHC) and 39% (AHC) respectively. Figure 2 shows that the trend in the measure since FYE 2011 is broadly stable.
Low Income Measures – relative BHC increased and AHC remained stable; both absolute measures have increased.
Figure 3: Percentage of all individuals in relative low income, FYE 2003 to FYE 2023

The percentage of individuals in relative low income has increased this year by 1 percentage point BHC to 17%, while the low income AHC measure remains stable at 21%.
Figure 4: Percentage of all individuals in absolute low income, FYE 2003 to FYE 2023

Both absolute low income BHC and AHC measures increased in FYE 2023 to 14% and 18% respectively – a 1 percentage point increase since FYE 2022.
None of the recorded changes in the measures were statistically significant.
2. What you need to know
The Households Below Average Income (HBAI) statistics are the UK’s primary source of poverty estimates and are the main source on household incomes. Users include central Government, the devolved governments, local authorities, academics, think tanks, journalists and the voluntary sector. It meets DWP’s statutory obligation to publish a measure of relative and absolute low income, and combined low income and material deprivation for children under section 4 of the Welfare Reform and Work Act 2016.
Income measures
HBAI estimates incorporate widely used international standard measures of low income and inequality. The primary measure used in HBAI is disposable household income adjusted for household composition (a process called equivalisation), estimated on both a before and after housing costs basis (BHC and AHC). Our main income measure includes contributions from earnings, state support, pensions, and investment income among others, and is net of tax. See section 14 of this report for an exhaustive list.
HBAI uses this net equivalised disposable household income as a proxy for living standards.
A household is said to be in relative low income if their net equivalised disposable household income is below a threshold set at 60% of median income, while they are in absolute low income if their net equivalised disposable household income is below 60% of the FYE 2011 median income adjusted for inflation. We also publish measures using thresholds at 50% and 70% below the median.
In line with international best practice, the income measures used in HBAI are subject to several statistical adjustments and, as such, are not always directly relatable to income amounts as they might be understood by people on a day-to-day basis. These adjustments, however, allow us to compare measures over time and across households of different sizes and compositions on a consistent basis.
HBAI uses variants of CPI inflation when estimating how incomes are changing in real terms over time. For further information, see the HBAI Quality and Methodology Information Report.
Survey data
Estimates are based on the Family Resources Survey (FRS). The data in this report is from interviews conducted between April 2022 and March 2023. The achieved sample size was 25,000 households compared to around 16,000 households during FYE 2022. During the coronavirus (COVID-19) pandemic sample sizes were smaller and interviewing was conducted by telephone. Prior to the pandemic the typical FRS sample was around 19,000 UK households and only face-to-face interviewing was used.
The mode of interview for the FRS during FYE 2023 returned to face-to-face by default, with telephone used as an alternative by 28% of respondents. This year’s sample was more representative than during the pandemic, with the profile of respondents closer to those who responded to the survey prior to FYE 2021. More information on the FRS fieldwork this year can be found in the FRS Background Information and Methodology report. Annex 5 of the HBAI Quality and Methodology Information document provides further details on the composition of the FRS sample for FYE 2023.
Use of survey data means results in this report are subject to uncertainty which can affect how changes should be interpreted, especially in the short term. Latest estimates should be considered alongside long-term patterns being particularly mindful of the impact of changes to FRS fieldwork operations during the coronavirus (COVID-19) pandemic. The FRS uses a clustered sample design to produce robust regional estimates. Therefore, the FRS is not suitable for analysis below regional level.
Statistical significance is a technical concept that says whether a reported change is likely to have arisen only by chance due to variations in the sampling. We calculate 95% confidence intervals around estimates in HBAI which sets a standard that, where any change is reported as statistically significant, there is less than a 1 in 20 chance that the reported difference is due to sampling variation and there is no real underlying change. Changes are marked as not statistically significant [ns] and statistically significant [s] in our accompanying tables or explicitly noted in this commentary.
The reported change between two years in the supporting tables and charts may not equal the difference between the rounded numbers for those years. This is because we round at the final point in any calculation.
Additional tables and data
A wide range of ODS supported tables are available alongside this release, breaking down the results presented in this report for different demographic characteristics. This includes breakdowns of the statistics by region, ethnic group, family type, and economic status. All tables can be downloaded via the HBAI homepage (see Directory of Tables link on this webpage to locate tables referenced in the following pages and to generally find the desired tables). Results are available for most series back to FYE 1995.
HBAI data is also available between FYE 1995 and FYE 2023 on the Stat-Xplore online tool. You can use Stat-Xplore to recreate measures in our static tables and create bespoke HBAI analysis.
The source data behind these statistics is available for download and further analysis via the UK Data Service.
New for this publication
Cost of Living Support Schemes
During FYE 2023 the UK Government announced and implemented additional support to families with several cost of living support schemes, depending on people’s circumstances. These payments are included in the HBAI estimates of household income.
Most of the schemes were introduced at pace, in a timeframe which made it difficult to adapt the FRS questionnaire to capture them. As each support scheme came with clear eligibility guidelines, receipt of the payments was imputed based on respondent characteristics. Further details on the methodology can be found in the FRS Background Information and Methodology document.
Educational Attainment
Development work to improve reporting on categories of level of education identified a separate issue with the FRS variable EDUCQUAL. This variable is used to present estimates of low income for working-age adults by their level of educational attainment. The estimates have been withdrawn from the FYE 2023 publication, affecting the following tables: 5.3db BHC, 5.3db AHC, 5.6db, and 5.9db. The FYE 2023 breakdown has also been removed from Stat Xplore. We will provide an update on restoring the estimates when validation checks are complete.
For the survey period covering the coronavirus (COVID-19) pandemic, EDUCQUAL was used to adjust our weighting methodology to correct for the over-representation of degree educated working-age people in the FRS sample. Following the reintroduction of FRS face-to-face interviewing for FYE 2023, this additional weighting was no longer required, and the grossing has returned to the FYE 2020 position.
We are investigating how identified issues with EDUCQUAL may have affected previous releases and will update in due course.
Resumption of the material deprivation time series
The measurement of material deprivation was affected by restrictions introduced in response to the coronavirus (COVID-19) pandemic.
For FYE 2023, responses to the survey items asked as part of establishing the level of material deprivation are unaffected by the pandemic. We have resumed our material deprivation time series by calculating the changes in the estimates since FYE 2020, when responses were last comparable.
We have chosen to display this in affected charts by presenting estimates for the pandemic period (FYE 2021 and FYE 2022) as individual data points. We advise users not to make a direct comparison of changes in material deprivation estimates over this period with those published prior to the pandemic.
Other points of note
Following our decision to not publish breakdowns of the FYE 2021 HBAI estimates, all three-year rolling averages calculated and published for any period including FYE 2021 continue to be based on two data points only. Next year the calculation will revert to using three data points.
3. The Overall Income Distribution
Average household incomes decreased in FYE 2023
The distribution of UK household income is skewed with a long right-hand tail of higher incomes.
Figure 5: Income distribution (BHC) for the total population, FYE 2023

See Table 2.1 BHC for full data. AHC data is available in Table 2.1 AHC
Interpretation
Deciles divide the population, when ranked by equivalised household income, into ten equal sized groups, while quintiles divide the population into five groups. The shape of the overall income distribution evolves slowly over time, with relatively small year-on-year changes.
The presence of large numbers of individuals with relatively high incomes results in a skewed or non-symmetric distribution. As a result, the median income is the standard measure of average income as changes in the mean can be driven by extreme values. The median represents the income of the individual in the middle of the distribution.
There are many individuals with household incomes around the 60% of median income mark. Those falling below this line are considered to have relative low income. As a result of the decile clustering around this income level, relatively small movements in the overall distribution can sometimes lead to sizeable movements in this low-income measure.
Main Findings
Figure 5 shows that in FYE 2023, the average (median) household income before housing costs (BHC) was £621 per week (around £32,500 per year). This represented a decrease of 0.5% in real terms, or £3 per week, compared with FYE 2022. Average income after housing costs (AHC) also decreased to £545 per week (around £28,500 per year). This represented a decrease of 1.5%, or £8 per week.
After the introduction of the survey series in FYE 1995, real incomes BHC increased steadily until FYE 2010 (see Figure 1). Following falls in FYE 2011 and FYE 2012 related to the recession, there were rises until FYE 2017 and real incomes peaked in the year prior to the coronavirus (COVID-19) pandemic (FYE 2020). In FYE 2023, median incomes BHC were 1.6% lower in real terms than the FYE 2020 peak, or £10 a week.
Annual CPI inflation averaged 10% over FYE 2023, putting pressure on household incomes. On average, all main components of household income increased at rates below inflation and therefore did not keep pace with rising prices. The official measure of weekly average earnings grew by 6.2%, 3.8 percentage points below annual CPI inflation. Additionally, in April 2022, all working-age benefits and the Basic and New State Pension increased by 3.1%, based on the value of CPI in September 2021.
The high rate of inflation also eroded the value of some other forms of household income too, most notably occupational pensions. Only the average value of incomes from savings and investments improved relative to FYE 2022, a consequence of rising Bank of England interest rates during the year. This mostly benefitted those individuals towards the upper end of the income distribution.
In response, the UK Government announced and implemented multiple schemes to support households with the increased cost of living. These payments helped to offset the falls in household income, leading to only a slight fall in the FYE 2023 BHC median. Eligible low-income households received cost of living payments administered by DWP. These consisted of a £650 payment to eligible households in receipt of an income-related benefit (for example, Universal Credit), which was paid in two instalments. A payment of £150 was also introduced to support those in receipt of disability benefits.
During the autumn and winter of FYE 2023, a £400 energy support scheme payment (£600 in Northern Ireland) was made to all UK households to offset rising energy costs (typically as a credit on their household energy bill). In addition, all pensioner households received a top-up to their existing Winter Fuel Payments of up to £300 depending on their circumstances. Households in receipt of the Guarantee Credit element of Pension Credit or were on a low income and have high energy costs also received a one-off discount on their energy bill under the Warm Home Discount scheme. The rebate increased from £140 to £150 and was discounted automatically from bills. A further £200 was available in Wales for those in receipt of qualifying benefits (through the Wales Fuel Support Scheme). Finally, in early FYE 2023 all households with a council tax band between A and D inclusive received a £150 council tax rebate from their local authority to help with the rising cost of living.
Average incomes after housing costs (AHC) reduced by more than BHC incomes in FYE 2023. This reflects that, for those around the median, average housing costs grew at a faster rate than components of their household income during FYE 2023. The HBAI data shows that mortgage interest payments grew steadily over the year, having been broadly flat in previous periods. This reflects the increases in rates offered by the mortgage market over the period, from historically low levels in previous survey years. Private rent growth was also higher than in recent years and was higher than average growth in social rents. In FYE 2023, AHC incomes were 1.3% lower in real terms than in FYE 2020, or £7 a week.
See Table 2.1ts Decile for full data.
See Table 2.1tr for full data on FYE 2023 economic indicators.
Figure 6: Change in real terms income BHC by percentile, FYE 2022 to FYE 2023

Interpretation
Looking at changes to incomes by percentile since FYE 2022 allows for an assessment of how each section of the income distribution changed in FYE 2023.
None of the measured changes to real incomes were statistically significant.
Main Findings
This year, the incomes for those in the bottom 80% of the distribution recorded negative BHC income growth, with larger reductions in the bottom half of the income distribution. Those in the top 10% and above recorded an increase in real BHC incomes.
The degree of income change was more substantial for those at the extremes of the distribution, some of which may reflect the additional uncertainties around the measurement of these incomes during FYE 2022 given the smaller achieved data sample during the pandemic.
Those at and below 60% of median income saw a fall in their average incomes of around 2%. This reflects the composition of this group, who receive a higher share of income from state benefits. In FYE 2023, state benefits were uprated by 3.1%. Those around the median are more likely to have income from employment, which showed higher nominal growth on average, of 6.2%.
Incomes for those with children reduced the most. This reflects the flat nature of the cost of living and additional support payments, meaning for larger households they are split between more household members. Therefore, these payments offset the falls in other income sources to a lesser extent than smaller (pensioner or working-age adults without children) households.
The distribution of the change in incomes AHC was similar to BHC, with negative income growth for almost all percentiles up to 90%. Those at and below 60% of median income saw less reduction in their AHC incomes compared to those around the median reflecting the tenure composition of this group. They are more likely to reside in the social rented sector, where rents increased by less than average private rents and mortgage interest payments, which saw the highest growth.
Full details are in the publication charts file.
4. Income Inequality
Income inequality increased between FYE 2022 and FYE 2023, with the trend remaining broadly flat since FYE 2011.
Figure 2 shows that the BHC and AHC Gini coefficients also increased in FYE 2023, at 35% BHC and 39% AHC respectively.
Figure 7: The 90:10 ratio measure of inequality, FYE 2003 to FYE 2023

Interpretation
Another measure of inequality is the 90:10 ratio. Percentiles divide the population, when ranked by household income, into 100 equal sized groups. The 90:10 ratio is the income at the 90th percentile divided by the income at the 10th percentile. It is equivalent to the average (median) income of the top 20% (quintile 5) divided by the average income of the bottom 20% (quintile 1). The higher the number, the greater the gap between those with high incomes and those with low incomes.
Main Findings
As with the Gini Coefficient, the 90:10 ratios both increased by 0.1 in FYE 2023 to 4.0 BHC and 5.0 AHC respectively . These measures remain lower than in FYE 2020 where the figures were 4.1 for BHC, and 5.2 for AHC.
See Table 2.1ts and 2.2ts for full data.
Figure 8: Weekly net equivalised disposable household income BHC by percentile, FYE 2023

Interpretation
Percentiles divide the population, when ranked by household income, into 100 equal sized groups. The chart indicates the amount of weekly net equivalised disposable household income an individual requires to sit at each percentile of the UK income distribution.
Main Findings
Income BHC at the 10th percentile is around half of the median (50th percentile) implying that around 10% of the population have less than half of the median household income BHC.
Incomes increase sharply past the 90th percentile BHC. In FYE 2023, income at the 90th percentile was almost double that of the median, whilst the top 3% of the population (97th percentile and above) have around three times the income of the median individual.
Full details are in the publication charts file.
Annual net equivalent disposable household income BHC by household type at different percentiles of the FYE 2023 UK distribution
| Percentile | Single individual | Couple with no children | Couple with two children under 14 |
|---|---|---|---|
| 10th | £10,800 | £16,100 | £22,500 |
| 50th | £21,700 | £32,400 | £45,400 |
| 90th | £42,900 | £64,000 | £89,500 |
| 97th | £66,600 | £99,400 | £139,100 |
Interpretation
To analyse incomes by percentile, the population is ordered according to their net equivalised disposable household income. The annual income required to be at a given point in the distribution is different for different household types. See section 12 for more information on equivalisation in HBAI.
Main Findings
Larger families require a higher level of household income to achieve similar living standards (based on a household income measure) to smaller families.
To lie in the top half of the income distribution in FYE 2023, a single individual needed an annual household income over £21,700, compared to a couple with two children under 14 who required a combined annual household income over £45,400.
A single individual with an annual household income of over £42,900 would sit above the 90th percentile in the distribution in FYE 2023, implying their income exceeded that of 90% of the UK population. A couple with two children under 14 receiving the same level of combined annual household income would lie just below the middle of the income distribution and be considered to have slightly less than average (median) household income.
5. Sources of income
The majority of household income in the UK comes from either earnings or state support. Cost of living payments and additional support schemes were introduced in FYE 2023 to support households with the pressures of high inflation and the rising cost of living. Income from these sources is primarily categorised as state support in the FYE 2023 estimates, except for the £400 Energy Support Scheme payments (£600 in Northern Ireland), the £150 Council Tax Rebate payments which were made to households in bands A to D, and the Warm Home Discount and Wales Fuel Support Scheme. These are classified as miscellaneous income. Please see the HBAI Quality and Methodology Information Report for more information.
Figure 9: Income sources as a percentage of gross income by decile, FYE 2023

Percentiles 1-3 and 98-100 are excluded because of large statistical uncertainty. This means deciles 1 and 10 are not true deciles (covering percentiles 4-10 and 91-97 respectively). Percentages may not always sum to 100% due to rounding.
Interpretation
The charts show the different sources of gross income by decile, ranking the population by income and dividing into 10 equal-sized groups (deciles). Income components are all considered before tax (gross). This is a different definition of income from that used elsewhere in the HBAI report.
Main Findings
Higher income households receive a larger proportion of their income from earnings, a trend which builds moving up the income distribution. Lower income households receive more of their income from state support. In FYE 2023:
-
earnings accounted for just over a third of gross income for individuals in the 1st decile compared to around 80% for individuals in the 10th decile;
-
around 80% of the UK population (those in the third income decile and above) received a higher proportion of their household income from earnings than from state support.
Figure 10: Sources of income for households containing working-age adults, FYE 2023

-
across all deciles, earnings is the main source of gross income for households containing only working-age adults. In the lowest decile, close to 50% of income is from earnings, compared to around 35% from state support. For the highest decile, almost all income is from earnings;
-
the share of income received from different sources does not always follow a step change across the income distribution. For example, those in deciles 3 and 4 receive a similar proportion of their income from earnings and state support.
Figure 11: Sources of income for households containing children, FYE 2023

-
for households containing children, receipt of state support generally makes up a larger proportion of income compared to households containing only working-age adults due to greater eligibility for state support (including Universal Credit and child benefit);
-
these households typically contain younger working-age adults, so receipt of occupational pensions does not feature as an income source.
Figure 12: Sources of income for households containing pensioners and no children, FYE 2023

-
in the bottom half of the income distribution (deciles 5 and below), households containing pensioners and no children receive most of their income from state support (particularly the state pension);
-
there is a slight step change from decile 6 onwards, and a higher proportion of income consists of earnings and investments, steadily increasing across deciles 6 to 9 and accounting for almost half of all income for those in decile 10;
-
the share of income received from occupational pensions steadily increases until decile 5, and then remains broadly consistent across the rest of the income distribution.
Full details are in the publication charts file.
6. Low-income indicators
The percentage of individuals in relative low income BHC, and both absolute low-income measures increased in FYE 2023.
These changes were not statistically significant.
Relative Low Income
Figure 13: Percentage of individuals in relative low income, FYE 2003 to FYE 2023

Interpretation
The relative low-income threshold is set as a proportion (60%) of the UK average (median) net equivalised household income and moves each year as average income changes. It is used to measure the number and proportion of individuals who have income below this threshold. Estimates are also available for below 50% and 70% of the median.
The percentage of individuals in relative low income depends on changes in median incomes, and how changes in the income of those below the low-income threshold compare to changes in the median.
Main Findings
This year, the percentage of the population in relative low income, before housing costs, has increased because average incomes for those around the low-income threshold have fallen more than those with median incomes.
On average, changes in housing costs for those near the low-income threshold have changed in line with those near the median, in relative terms, resulting in no measured change to the relative low income, after housing costs measure.
The percentage of individuals in relative low income BHC is 17%, an increase of 1 percentage point since last year, and 21% for AHC (unchanged since FYE 2022, changes are rounded to the nearest percentage point).
Both the BHC measure and AHC measures are 1 percentage point lower than in FYE 2020. Prior to the pandemic, there was an upward trend in the percentage of individuals in relative low income BHC.
Absolute Low Income
Figure 14: Percentage of individuals in absolute low income, FYE 2003 to FYE 2023

Interpretation
Absolute low income takes the 60% of median income threshold from FYE 2011 and then fixes this in real terms (i.e. the line moves with inflation). This is designed to assess the extent to which low incomes are keeping pace with inflation. It measures the number and proportion of individuals who have incomes below this threshold. We also publish measures using thresholds at 50% or 70% below the FYE 2011 median.
The percentage of individuals in absolute low income will decrease if individuals with lower incomes see their incomes rise by more than inflation.
Main Findings
This year our central estimates for both absolute measures, BHC and AHC, have increased by 1 percentage point since FYE 2022.
The percentage of individuals in absolute low income BHC was 14% in FYE 2023 while the percentage AHC was 18%. Prior to this year, there had been a general downward trend in the percentage of individuals in absolute low income.
See Tables 3.1tr (relative) and 3.2tr (absolute) for full data.
Household Food Security
This publication includes statistics on household food security for all UK individuals and those living in low-income households. Information on household food security at a household level can be found in the FRS publication.
Interpretation
To measure household food security, questions are asked of the person in the household who knows the most about buying and preparing food. In common with the rest of the FRS, the focus is on the period of 30 days leading up to interview. The questions are comparable to those used by other public bodies in the UK, and also internationally. From the questions, a ten-point household score is generated, and the household is given a food security status:
-
High food security (score=0): The household has no problem, or anxiety about, consistently accessing adequate food
-
Marginal food security (score= 1 or 2): The household had problems at times, or anxiety about, accessing adequate food, but the quality, variety, and quantity of their food intake were not substantially reduced
-
Low food security (score = 3 to 5): The household reduced the quality, variety, and desirability of their diets, but the quantity of food intake and normal eating patterns were not substantially disrupted
-
Very low food security (score = 6 to 10): At times during the last 30 days, eating patterns of 1 or more household members were disrupted and food intake reduced because the household lacked money and other resources for food.
Households with high or marginal food security are “food secure”. Food secure households are considered to have sufficient, varied food to facilitate an active and healthy lifestyle. Households with low or very low food security are “food insecure”. Food insecure households have a risk of, or lack of access to, sufficient, varied food. More details are available in the FRS Background Information and Methodology note.
Main Findings
The percentage of individuals living in food secure households decreased in FYE 2023.
Eighty-nine percent of individuals in the UK population lived in a food secure household in FYE 2023, compared to 93% last year.
Falls in household food security were greater for those in low income. Seventy-eight percent of individuals in relative low income BHC, and 76% AHC, lived in a food secure household. In both cases, this was a decrease of 7 percentage points since last year. A similar degree of change was seen amongst individuals in absolute low income.
There has been a larger shift between the proportion of low-income individuals recording high household food security to very low household food security. All measures of household food security for individuals were at their lowest recorded level since they were introduced in FYE 2020.
Food Bank Usage
This publication also includes statistics on food bank usage for all UK individuals and those who are living in low-income households. Information on food bank usage at a household level can be found in the FRS publication.
Note that the figures for food bank usage amongst the UK population are rounded to the nearest 0.1%. This ensures any movements in the numbers using food banks in a large population are accurately reflected in the reported percentages. For lower level breakdowns of the population, figures are still reported to the nearest percentage point.
Interpretation
A new series of questions was added to the FRS for FYE 2022 on the topic of food bank usage. Food bank usage questions are asked of the person in the household who knows the most about food purchasing and preparation. This means that the questions do not directly ask about the food bank usage needs of children, and it cannot be determined which individual or individuals the food parcels are for. Food bank usage in the FRS refers only to visits to a food bank when emergency food supplies (food parcels) were obtained. This excludes visits to the food bank made only for other support (e.g. financial advice or mental health support).
The FRS asks food bank usage questions relating to 2 time periods: 12 months prior to interview, and in the 30 days prior to interview. This means that caution may be needed when making direct comparisons between the FRS results and other research on this subject.
For details on food bank questions please see the FRS Background Information and Methodology note.
Main Findings
The percentage of individuals in households who have accessed a food bank within 30 days of their FRS interview has increased. Over a 12-month period, the percentage is more stable.
Of all UK individuals, 3.4% lived in a household who had accessed a food bank within the 12 months prior to their FRS interview. This is similar to last year.
Those in low-income households were more likely to have used a food bank over the same period. Eight percent of individuals in relative low income BHC, lived in a household where a food bank had been used within the 12 months prior to their FRS interview. Similar levels were recorded for the AHC measure and for individuals in absolute low income. As with the overall population, usage was similar to FYE 2022, with the exception of a small increase for those in absolute low income after housing costs. Compared to FYE 2022, food bank usage over the previous 12 months increased by 1 percentage point to 10%.
Of all UK individuals, 1.5% lived in a household who had accessed a food bank within 30 days prior to their FRS interview. This is an increase compared to FYE 2022, where it was 0.9%.
All measures show an increase in the proportion of individuals in low-income households using a food bank in the previous 30 days. Typically, the increase was 1 percentage point - from 3 to 4 percent of all relative low-income households. It was higher (2 percentage points) for individuals in absolute AHC low-income households, with 5% of these households having accessed a food bank in the previous 30 days.
See tables 9.1ts, 9.2ts (relative) and 9.3ts (absolute) for full data.
7. Children in low-income households
Three of the four low-income measures for children included in section 4 of the Welfare Reform and Work Act 2016 form part of the HBAI publication. These are: a 60% threshold relative low-income measure, a 60% threshold absolute low-income measure, and a combined 70% threshold low income and material deprivation measure. As with individuals, we report four measures of the percentage of children in low income – based on relative and absolute income, and before and after housing costs (BHC and AHC).
Compared to the overall population, children are more likely to live in low-income households.
See Tables 4.1tr, 4.2tr and 4.5tr for full data.
The percentage of children in relative and absolute low income increased in FYE 2023
Relative Low Income
Figure 15: Percentage of children in relative low income, FYE 2003 to FYE 2023

Main Findings
Between FYE 2022 and FYE 2023, relative low income BHC for children increased by 2 percentage points to 22%. The relative AHC measure also increased by 1 percentage point to 30%.
The AHC measure remains below the last set of estimates published prior to the coronavirus (COVID-19) pandemic, for FYE 2020 There was a general upward trend in both measures in the decade prior to the pandemic.
Neither change in the measures was statistically significant.
Absolute Low Income
Figure 16: Percentage of children in absolute low income, FYE 2003 to FYE 2023

Main Findings
Both measures of the percentage of children in absolute low income have increased for the first time since FYE 2018. The increase BHC was 3 percentage points to 18%, and AHC increased by 2 percentage points to 25% compared to FYE 2022.
Both measures have followed a downward trend since they were introduced.
Combined low income and child material deprivation
For the last two survey years, the measurement of material deprivation was affected by restrictions introduced in response to the coronavirus (COVID-19) pandemic.
For FYE 2023, we are resuming all of our material deprivation time series by comparing directly with FYE 2020, when responses to the survey items asked as part of establishing the level of material deprivation were last comparable. We have chosen to display this as a discontinuity in the charts below by displaying estimates for the pandemic period FYE 2021 and FYE 2022 as individual data points.
We advise users not to make a direct comparison of changes in material deprivation estimates this year with those published during the pandemic.
The percentage of children in combined low income and child material deprivation has increased.
Figure 17: Percentage of children in combined relative low income and child material deprivation, FYE 2005 to FYE 2023

Figure 18: Percentage of children in combined absolute low income and child material deprivation, FYE 2005 to FYE 2023

Note: FYE 2021 and FYE 2022 estimates are shown as standalone data points as measurement was affected by COVID-19 restrictions.
Interpretation
For this measure of combined low income and child material deprivation, respondents are asked whether they have access to a list of 21 goods and services. If they can’t afford a given item, this is scored in the material deprivation measure, with items more commonly owned in the population given a higher weighted score. A child is classified as being in combined low income and child material deprivation if they live in a family that has a total score of 25 or more out of 100 and a net equivalised disposable household income BHC below 70% of the median. Measures using other thresholds of low income are available in our supplementary tables. More details are available in the HBAI Quality and Methodology Information Report.
Main Findings
Using both relative and absolute low-income measures, the percentage of children in combined low income and child material deprivation has increased by 1 percentage point since FYE 2020, reaching 13% for relative BHC and 11% for absolute BHC.
Movements seen in the relative measure in the decade prior to the pandemic were small but slightly downwards, although the measure increased in FYE 2020, the last comparable time point. The absolute measure was broadly stable in the years leading up to the pandemic, after a downward trend in the series to FYE 2017.
Household Food Security
The percentage of children living in food secure households has decreased.
Children are less likely to be living in a food secure household compared with working-age adults and pensioners.
Eighty-three percent of children in the UK population lived in a food secure household in FYE 2023, compared to 88% last year.
Falls in household food security were greater for those in low income, Seventy percent of children in relative low income lived in a food secure household. In both cases, this was a decrease of 9 and 8 percentage points for the BHC and AHC low-income measures respectively, since last year. Slightly larger changes were seen for children in absolute low income. These measures are at their lowest recorded level since they were introduced in FYE 2020.
There were larger shifts between the proportions of children who lived in a household with high and very low household food security compared to FYE 2022. For example, 16% of children in relative low-income BHC are now living in households with very low food security, up from 9% last year, and 12% prior to the pandemic.
Food Bank Usage
Children are more likely to be living in a household where a food bank has been accessed compared with working-age adults and pensioners.
The percentage of children in households who have accessed a food bank within 30 days of their FRS interview has increased. Over a 12-month period, the percentage is more stable.
Of all UK children, 5.7% lived in a household who had accessed a food bank within the 12 months prior to their FRS interview. This is similar to last year.
Those in low-income households were more likely to have used a food bank over the same period. Twelve percent of children in relative low income BHC lived in a household where a food bank had been used within the 12 months prior to their FRS interview. Similar levels were recorded for the AHC measure and for individuals in absolute low income. Recorded levels were the same as last year, with the exception of a small increase in 12-month food bank usage for children in absolute low income households AHC. Usage increased by 1 percentage point to 12%, compared to FYE 2022.
Of all UK children, 2.4% lived in a household who had accessed a food bank within 30 days prior to their FRS interview. This is an increase compared to FYE 2022, where it was 1.3%.
All measures also show an increase in the proportion of children in low-income households using a food bank in the previous 30 days. The increase was from 4 to 6 percent of all children in relative low-income households, before housing costs and was greater for children in low income after housing costs, from 3 to 6 percent. The same increases were seen for children in absolute low-income households.
See Tables 9.4ts, 9.5ts (relative) and 9.6ts (absolute) for full data.
8. Working-age adults in low-income households and changes in low income by work status
Working-age adults make up around 60% of the UK population. As such, changes in income for this group drive overall results more than changes amongst children and pensioners (with these groups making up 22% and 18% of the population respectively). Working-age adults also receive a greater proportion of their income from earnings and so changes in their incomes are more sensitive to changes in the labour market.
See Tables 5.1tr, 5.2tr, 5.2ts, 5.7tr, 5.8tr, 5.11ts, and 4.14ts for full data.
The percentage of working-age adults in relative low income is unchanged, and absolute BHC also remains stable. The percentage in absolute low income AHC has slightly increased.
Figure 19: Percentage of working-age adults in relative low income, FYE 2003 to FYE 2023

Figure 20: Percentage of working-age adults in absolute low income, FYE 2003 to FYE 2023

Main Findings
The percentage of working-age adults in relative low income BHC and AHC remained at the same levels as in FYE 2022, 15% and 20% respectively. The relative low-income estimates for FYE 2023 are broadly consistent with the long-term trend.
Absolute low income BHC remained the same as in FYE 2022, while AHC it increased by 1 percentage point to 17%. In the years from FYE 2012 to FYE 2020, there was a broad downward trend in both measures.
None of the changes in the measures were statistically significant.
Percentage and composition of children and working-age adults in low income by work status
Estimates of low income by family work status are not available for FYE 2021 due to coronavirus (COVID-19) pandemic data quality issues. Figures 21 and 22 link the FYE 2020 and FYE 2022 data points.
Figure 21: Percentage of children in relative low income BHC by family work status, FYE 2003 to FYE 2023

Main Findings
In FYE 2023, 59% of children in workless families were in low income.
This figure is the highest in the series since FYE 2007, and continues the upward trend seen from FYE 2015. There was a downward trend in the measure prior to FYE 2015.
In comparison, 17% of children in working families were in low income. This estimate is higher than the 16% recorded in FYE 2022, but lower than the 19% recorded in FYE 2020. Prior to the coronavirus pandemic, there had been an upward trend in the measure.
The smaller sample size for the workless group, particularly in FYE 2022, means that there is more variability in the low-income estimates for this group between years.
Figure 22: Working-age in relative low income BHC by family work status, FYE 2003 to FYE 2023

Main Findings
Working-age adults in workless families are less likely to be in low income than families with children. In FYE 2023, 37% of working-age adults in workless families were in low income. This is both lower than prior to the pandemic and a 1 percentage point decrease since FYE 2022. Prior to the pandemic, the trend in this measure was broadly stable.
In comparison, 10% of working-age adults in working families were in low income in FYE 2023. The trend in this measure has been stable over the timeseries.
Combined low income and working-age material deprivation
For the last two survey years, the measurement of material deprivation was affected by restrictions introduced in response to the coronavirus (COVID-19) pandemic. We advise users not to make a direct comparison of changes in material deprivation estimates this year with those published during the pandemic.
The percentage of working-age adults in combined low income and working-age material deprivation is unchanged in FYE 2023.
Figure 23: Percentage of working-age adults in combined relative low income and working-age material deprivation, FYE 2011 to FYE 2023

Figure 24: Percentage of working-age adults in combined absolute low income and working-age material deprivation, FYE 2011 to FYE 2023

Note: FYE 2021 and FYE 2022 estimates are shown as standalone data points as measurement was affected by COVID-19 restrictions.
Interpretation
The methodology for measuring of combined low income and material deprivation for working-age adults is the same as for children, except measurement is based on a shorter list of 9 goods and services. As with children, we report defining low income as net equivalised disposable household income BHC below 70% of contemporary median income, but measures using other thresholds of low income are available in our supplementary tables.
Main Findings
In FYE 2023, the percentage of working-age adults in combined low income and working-age material deprivation was 9% using relative BHC income and 8% using absolute BHC income. These are both unchanged compared to FYE 2020, using the rounded change between the two data points.
Both measures showed a downward trend in the years prior to the pandemic, with a steeper reduction in the absolute measure over the period since the series began in FYE 2011.
Household Food Security
The percentage of working-age adults living in food secure households has decreased.
Eighty-nine percent of working-age adults in the UK population lived in a food secure household in FYE 2023, compared to 93% last year .
Falls in household food security were greater for those in low income. Seventy-six percent of working-age adults in relative low income BHC lived in a food secure household, and 74% of those in relative low income AHC. This was a decrease of 7 and 8 percentage points since for the measures respectively, since last year. Similar changes were seen for working-age adults in absolute low income. These measures are at their lowest recorded level since they were introduced in FYE 2020.
There were shifts between the proportions of working-age adults who live in a household with high or marginal food security to low and very low household food security. For example, 24% of relative low-income working-age adults BHC are now living in households with low or very low food security, up from 17% last year, and 21% prior to the pandemic (FYE 2020).
Food Bank Usage
The percentage of working-age adults in households who have accessed a food bank within 30 days of their FRS interview has increased. Over a 12-month period, the percentage is similar.
Of all UK working-age adults, 3.4% lived in a household who had accessed a food bank within the 12 months prior to their FRS interview. This is similar to last year.
Working-age adults in low-income households were more likely to have used a food bank over the same period, but the percentage who had used food banks was broadly the same as last year. Nine percent of working-age adults in relative low income BHC lived in a household where a food bank had been used within the 12 months prior to their FRS interview, increasing to 10% for the relative AHC measure which represented a small increase compared to FYE 2022. Similar levels of usage were seen in the absolute low-income measures.
Of all UK working-age adults, 1.4% lived in a household who had accessed a food bank within 30 days prior to their FRS interview. This is an increase compared to FYE 2022, where it was 1.0%.
All measures show an increase in the proportion of working-age adults in low-income households using a food bank in the previous 30 days, but the increase was less than that seen for children. In FYE 2023, 4% of working-age adults in relative low income BHC and AHC lived in a household where a food bank had been used in the last 30 days. The percentage was slightly higher on an absolute low-income basis BHC and AHC, at 5%. Both figures were 1 percentage point higher than in FYE 2022.
See Tables 9.7ts, 9.8ts (relative) and 9.9ts (absolute) for full data.
9. Pensioners in low-income households
Around three-quarters of pensioners live in homes that are owned outright (compared to roughly a quarter of working-age adults), and so face minimal housing costs. This means the percentage of pensioners in low-income households is lower AHC than BHC, unlike for children and working-age adults.
As only a small proportion of pensioners have earned income from employment, trends in low income for this group are influenced more by how the value of state or personal and occupational pensions change relative to inflation and relative to growth in earnings for the population below state pension age.
The percentage of pensioners in relative low income has increased BHC, but decreased AHC. The percentage of pensioners in absolute low income BHC has also increased, with AHC measures stable.
See Tables 6.1tr, 6.2tr, and 6.7tr for full data.
Figure 25: Percentage of pensioners in relative low income, FYE 2003 to FYE 2023

Figure 26: Percentage of pensioners in absolute low income, FYE 2003 to FYE 2023

Main Findings
The percentage of pensioners in relative low income BHC increased by 1 percentage point to 19% and decreased by 1 percentage point to 16% AHC in FYE 2023. These changes were not statistically significant.
The measured changes for pensioners BHC are higher than for working-age adults, and lower than for children. Although pensioner households will have benefitted more from cost of living support schemes, they will have received less of an increase to their incomes through wage growth being higher than increases to State Pension during FYE 2023. There was also a reduction in the real value of occupational pensions over the period.
The degree of change measured is also likely to have been influenced by changes in pensioner sample composition between the two FRS survey years and the move from telephone back to face-to-face interviewing. This broader context should be borne in mind when interpreting the observed changes in pensioner low-income rates, and a comparison to FYE 2020 is recommended.
The relative low income BHC measure remains slightly lower than levels measured in FYE 2020, pre-pandemic, and the AHC measure is 2 percentage points lower. This reflects the higher levels of outright home ownership of pensioners, meaning they were more protected from increases in housing costs seen for non-pensioners over the period (due to inflation and increasing mortgage interest rates). Between FYE 2011 and FYE 2020 there was a gradual upward trend in both relative measures.
Absolute low income BHC for pensioners has increased in FYE 2023, by 1 percentage point to 15%. The BHC figures continue the pre-pandemic trend of absolute figures being broadly flat. For absolute low income AHC the measure remains the same as in FYE 2022 at 12%. The AHC measure is below estimates published in FYE 2020.
Material Deprivation
The percentage of pensioners in material deprivation significantly increased in FYE 2023
Figure 27: Percentage of pensioners in material deprivation, FYE 2010 to FYE 2023

Note: FYE 2021 and FYE 2022 estimates are shown as standalone data points as measurement was affected by COVID-19 restrictions.
Interpretation
Pensioners aged 65 or over are asked whether they have access to a list of 15 goods and services. If they don’t have a given item (because of cost, health, or availability), this is scored in the material deprivation measure, with items more commonly owned in the population given a higher weighted score. A pensioner is in material deprivation if they live in a family that has a final score of 20 or more out of 100. More details are available in the HBAI Quality and Methodology Information Report.
Main Findings
In FYE 2023, the percentage of pensioners in material deprivation was 8%. This is a 2-percentage point increase compared with FYE 2020 and the estimate is at the highest level since FYE 2016. It is the first recorded increase in the measure since FYE 2014.
The change in this estimate is statistically significant.
Household Food Security
The percentage of pensioners living in food secure households decreased in FYE 2023.
Pensioners in relative low income BHC are much more likely to live in a food secure household compared with working-age adults and children in low income BHC.
Ninety-seven percent of pensioners in the UK population lived in a food secure household in FYE 2023, compared to 99% last year .
The percentage is similar for pensioners in low-income households. In FYE 2023, 95% of pensioners in relative low income BHC or absolute low income BHC lived in a food secure household. These figures were also 2 percentage points lower than in FYE 2022.
The proportion who lived in a household with high food security was 90% for both measures, a decrease of 4 percentage points compared with all previous periods back to FYE 2020 when the series began.
For relative and absolute low income AHC, there was a 3 percentage point reduction in the percentage of low-income pensioners in food secure households, to 94%. As with children and working-age adults, this was the lowest estimate since the measures were introduced in FYE 2020.
The proportion that lived in households with a high food security status was 88%, which was a fall of 5 percentage points compared to FYE 2022.
Both BHC and AHC changes in the household food security estimates suggest a small shift from high to marginal and low food security groups for pensioners in low-income households.
Food Bank Usage
Pensioners remain very unlikely to have accessed a food bank.
Of all UK pensioners, 0.8% lived in a household who had accessed a food bank within the 12 months prior to their FRS interview. The estimate was too small last year to make any definitive comment on how it changed in FYE 2023.
In FYE 2023, 1% of pensioners in relative or absolute low income BHC or AHC lived in a household where a food bank had been used within the 12 months prior to their FRS interview. This percentage is unchanged compared to last year and is broadly the same as the overall UK pensioner population.
The estimates suggest a small movement towards more pensioner low-income households having accessed a food bank within the last 30 days in FYE 2023, but definitive conclusions cannot be drawn due to the smaller sample sizes involved.
See Tables 9.10ts, 9.11ts (relative) and 9.12ts (absolute) for full data.
10. People in low-income households, by disability in the family
Over 25 million individuals (or 38%) lived in a family where someone was disabled in FYE 2023. This consisted of 5.4 million children, 13.3 million working-age adults and 6.7 million pensioners.
The percentage of individuals in a disabled family and in low income remained stable before housing costs and has decreased after housing costs.
None of the changes reported in this section were statistically significant.
See tables 7.1tr, 7.3tr, 7.5tr and 7.7tr for full data.
Definitions
Disabled people are identified as those who report any physical or mental health condition(s) or illness(es) that last or are expected to last 12 months or more, and which limit their ability to carry out day-to-day activities a little, or a lot. This is in line with the Equality Act definition.
The means of identifying people with a disability has changed over time however, with different criteria applied for FYE 2003 to FYE 2004; FYE 2005 to FYE 2012; and FYE 2013 to date. As such, changes over time in the number of individuals with disabilities could be affected by the changes in the disability questions.
Further, different individuals may also have different interpretations of health conditions or question wording, meaning that changes to the disability questions may have had a different effect on different groups.
Therefore, comparisons between estimates from FYE 2013 onwards with earlier years should be made with caution.
Figure 28: Percentage of individuals in relative low income BHC, by family disability, FYE 2003 to FYE 2023

Note: Estimates of low income by family disability status are not available for FYE 2021. All charts in this section link the FYE 2020 and FYE 2022 data points. Changes to the FRS fieldwork from face-to-face interviewing to telephone during coronavirus (COVID-19) pandemic affected the composition of the achieved sample, and sample size was significantly reduced, affecting the quality of the estimates for FYE 2021.
Main Findings
Those living in a family with a disabled member are more likely to be in low income than non-disabled families. The percentage of individuals in families where someone is disabled in relative low income BHC is 4 percentage points higher than equivalent families where no-one is disabled.
Figure 28 shows that in FYE 2023, the percentage of individuals in families where someone is disabled and in low income remained stable at 20%. The FYE 2023 percentage is aligned with the longer-term flat trend in the measure seen prior to FYE 2020. Low-income rates have increased slightly for those individuals in families without a disabled member, continuing the upward trend in the figures prior to the pandemic.
Figure 29: Percentage of individuals in relative low income AHC, by family disability, FYE 2003 to FYE 2023

Main Findings
Relative low income AHC for those in families where someone is disabled was 24%, a fall of 2 percentage points on FYE 2022. This estimate is the lowest recorded since the change in disability definition in FYE 2013. This year, the gap between low-income rates for those in disabled and non-disabled families has narrowed.
Figure 30: Percentage of individuals in absolute low income BHC, by family disability, FYE 2003 to FYE 2023

Figure 31: Percentage of individuals in absolute low income AHC, by family disability, FYE 2003 to FYE 2023

Main Findings
In FYE 2023, absolute low income BHC remained the same at 16% for individuals in families where someone is disabled. The AHC measure fell from 21% to 20%, continuing the longer-term downward trend. For individuals in families without a disabled member, there were increases in both low-income measures.
For both relative and absolute measures, there is no direct relationship between the trends for those with and without disabled family members. Different factors could affect the average household income where someone in a family is disabled. We know, for example, that working-age adults with disabilities are less likely to be in employment, and that disability is more prevalent amongst pensioners which can help explain why AHC measures have seen more downward movement in FYE 2023. Changes in low-income rates will also depend not only on changes in the composition of the group but also differences in the growth of income components (such as income from employment) compared to non-disabled households.
Figure 32: Percentage of children, working-age, and pensioners in relative low income BHC where someone in the family is disabled, FYE 2003 to FYE 2023

Figure 33: Percentage of children, working-age, and pensioners in absolute low income BHC where someone in the family is disabled, FYE 2003 to FYE 2023

Main Findings
The charts above show that working-age adults in disabled families showed a sharper decline in their low-income rates, whereas children and pensioners in disabled families showed an increase in low income. While the FYE 2023 children and pensioner estimates are in line with the broader timeseries, the working-age adult relative BHC measure is the lowest this estimate has been across a broadly stable timeseries, at 18% of all those in disabled families. This measure increased by 1 percentage point where there was no disability in the working-age adult’s family.
There were large reductions in rates of low income for pensioners and children in disabled families between FYE 2008 and FYE 2012. From FYE 2013, when disability definitions changed, to FYE 2020, prior to the pandemic, rates for both groups were slightly increasing using the relative measure, and stable using the absolute measure.
The estimated rates of low income for all disabled age groups are below those measured in FYE 2020.
11. Long-term trends (data prior to FYE 1995 are not Accredited Official Statistics)
Work undertaken by IFS to extend HBAI trends back to 1961 shows large increases in inequality over the 1980s
Figure 34: Long term trend in the Gini Coefficient

Figure 35: Long term trend in Relative Low Income

Figure 36: Long term trend in Absolute Low Income

Main Findings
Looking at trends over the past 60 years, incomes across the population have increased dramatically in real terms over time, driving falls in absolute low income. This pattern has held fairly consistently over time, with rises in absolute low income being relatively rare, although the rate of decline in the measures has slowed over the last decade.
During the 1980s, incomes for those further up the income distribution grew more quickly than for those at the bottom, driving large increases in income inequality (Gini) and in relative low income measures. Since the early 1990s, income inequality measures in the UK have remained relatively stable, although analysis by Atkinson, Piketty et al, held at the World Inequality Database suggests that increasing inequality has continued with incomes for those within the top 1% continuing to grow faster than for the rest of the distribution. Changes this far up the distribution will not be captured well in the HBAI data.
Interpretation
The increase in income inequality (and in relative low income) over the past 40 years or so has been driven in part by a significant increase in individual earnings inequality over the same period.
Partial explanations for wider trends are:
-
from the late-1970s there was a large rise in unemployment following the recession, accompanied by increasing inequality in earnings – driven in part by factors like increases in part-time working;
-
from the mid-1980s increasing income inequality was further driven by incomes of those in employment pulling away from those who are economically inactive (including pensioners) as growth in employment income rose faster than for other sources such as benefits;
-
in the late-1980s the widening of the income distribution was driven further by increases in earnings inequality, with increasing differences between wages for different occupations;
-
by the early 1990s the picture began to stabilise with incomes of those economically inactive starting to catch up to those in employment;
-
in the early 2000s falls in low-income measures were driven by increasing relative incomes for families with children and pensioners – driven in part by the introduction of tax credits and increases in the Basic State Pension. From 2002 onwards, the Government was committed to uprating the BSP by the higher of 2.5 per cent and inflation. The “triple lock” was introduced in 2010.
See the IFS publication for full data and Accounting for changes in inequality for detailed decomposition analysis of trends
12. Measuring income in HBAI
HBAI uses data from the Family Resources Survey (FRS) to derive a measure of disposable household income. Adjustments are made to take account of the size and composition of households to make figures comparable.
In FYE 2023, the FRS covered a sample of 25 thousand households in the United Kingdom. This was meaningfully higher than the over 16,000 achieved in FYE 2022 and 30% above levels seen in the years prior to the COVID-19 pandemic (where typically 19 to 20 thousand households were sampled). In general, this means that the degree of uncertainty around this year’s survey estimates is smaller than in the last two years.
Sampling Error - Results from surveys are estimates and not precise figures - in general terms the smaller the sample size, the larger the uncertainty. Confidence intervals help to interpret the uncertainty of these estimates, by showing the range of values around the estimate that the true result is likely to be within.
Non-sampling Error - These results are based on data from respondents to the survey. If people give inaccurate responses or certain groups of people are less likely to respond this can introduce biases and errors. This non-sampling error can be minimised through effective and accurate sample and questionnaire design and extensive quality assurance of the data. However, it is not possible to eliminate it completely, nor can it be quantified.
Income - This is measured as total weekly household income from all sources (including child income) after tax, national insurance and other deductions. Income measures are presented before and after housing costs (rent, mortgage interest payments, buildings insurance etc.) A household income measure implicitly assumes that all members of the household benefit equally from the household’s income and so appear at the same position in the income distribution.
SPI adjustment - Estimates of mean income and some inequality measures are very sensitive to fluctuations in incomes at the top of the distribution. An adjustment to correct for this is made to ‘very rich’ households in FRS-based results using data from HMRC’s Survey of Personal Incomes.
Key Definitions
Household - One person living alone or a group of people (not necessarily related) living at the same address who share cooking facilities and share a living room, sitting room or dining area. A household will consist of 1 or more benefit units or families.
Family or Benefit Unit - A single adult or a couple living as married and any dependent children.
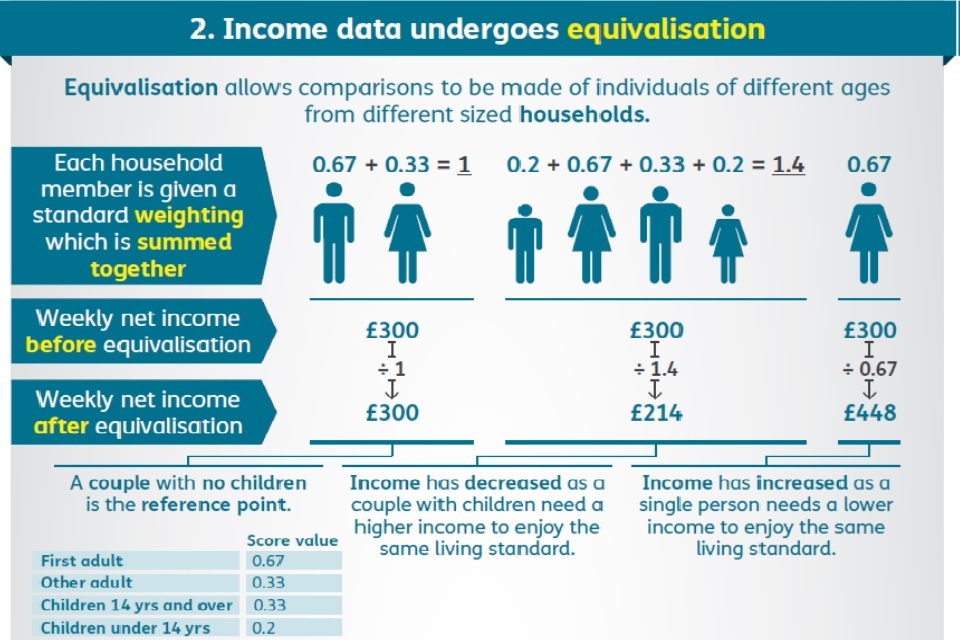
Equivalisation - An adjustment is made to income to make it comparable across households of different size and composition. For example, the process of equivalisation would adjust the income of a single person upwards, so their income can be compared directly to the standard of living for a couple. Different equivalisation scales are applied before and after housing costs, with the BHC example below. AHC scales can be found in our HBAI Quality and Methodology Information Report.
Figure 37: Equivalisation scales used in HBAI (Before Housing Costs)
Inflation is the speed at which the prices of goods and services rise or fall. The use of different inflation measures influences trends in average household income and absolute low-income measures in HBAI.
HBAI uses variants of CPI to adjust for inflation to look at how incomes are changing over time in real terms i.e. if, for example, average incomes rise by 3% in cash terms but inflation is higher at 5%, then we will record a fall in average incomes as the real average purchasing power of incomes has fallen.
13. Strengths and limitations
The main strengths of HBAI include:
-
HBAI has provided the UK’s headline household income statistics since FYE 1995 using a consistent methodology. Hence, HBAI provides data on both current levels and short/medium/long term trends in incomes and the income distribution. The statistics are the UK’s primary source of poverty estimates and, with a larger sample size, are the main source on household incomes .
-
Alongside statistics on low income, HBAI also measures and publishes data on other aspects of poverty. It includes statistics on levels of material deprivation, household food security, and food bank usage, including in combination with low income.
-
The data are subject to extensive quality control and cleaning. Firstly, via the FRS data collection and editing processes operated by the FRS Consortium and DWP. And secondly via the HBAI production process operated by DWP and with additional quality assurance provided by the Institute for Fiscal Studies (IFS).
-
HBAI follows national and international best practice regarding the measurement of household incomes (e.g. regarding income from self-employment and housing costs) and the equivalisation of household incomes (see previous section) across differing household sizes and compositions.
-
HBAI provides headline estimates with an extensive suite of supplementary tables via the HBAI homepage, as well as user-defined breakdown tables via Stat-Xplore and in-depth analysis of case-level datasets via the UK Data Service.
-
Given its coverage of the whole UK private household population and wide range of demographic and socio-economic data, FRS/HBAI data can be used for many purposes beyond income/poverty analysis e.g. for a wide range of policy impact analyses.
The main limitations of HBAI include:
-
As with any survey, the data are subject to both non-response bias and reporting error, despite the best efforts of the survey sample design, data quality control and cleaning. We are seeking to transform the FRS by increasing the use of administrative data from the full range of available sources (for example, from other parts of government). This should help correct for issues like benefit under-reporting and improve the quality of our income estimates. A technical report on FRS transformation, with illustrative results using DWP benefit data, was published in March 2024 alongside the FRS publication. Our development work is continuing so we plan to follow this up, with further results using HMRC PAYE and Self-Assessment data, and other administrative sources, during FYE 2025. Our intention is to include details on how the use of administrative data might affect HBAI low-income estimates. Please see the DWP Statistical Work Programme for updates on the status of this project and planned future releases.
-
Although the source FRS survey is relatively large (with around 19,000 households surveyed before the coronavirus (COVID-19) pandemic), estimates for smaller sub-groups and geographical areas need to be produced by combining multiple survey years together and/or will be subject to wide confidence intervals.
-
Whilst the equivalisation process allows household incomes to be compared across differing household sizes and compositions, the equivalisation factors used are somewhat simplistic e.g. adjusting income in the same way for all people aged 14 and over in a household (beyond the household reference person), regardless of whether the person is a child/working-age adult/pensioner or whether they are disabled or not.
-
The statistics treat all members of each household equally in terms of the overall household income i.e. the equivalised household income is calculated and then all of the household is in low income (‘poverty’) if the household income is below 60% of the median, or all of the household is not in low income if the household income is at or above 60% of the median. In effect, this assumes that all members of the household are equally affected by the overall household income: a more reasonable assumption where household members are related than where they are not e.g. a group of unrelated young adults living together.
-
Due to the amount of data processing and quality assurance required, the statistics are published around 12 months after the reporting year . More details on this process are available in the FRS Background Information and Methodology Report
-
As the survey sampling frame covers private households only, it does not cover those living outside of private households e.g. people living in residential care and nursing homes, university halls of residence, prisons/detention centres or rough sleepers.
14. About these statistics
The income measure used in HBAI is weekly net equivalised disposable income Before Housing Costs measuring income from all sources from all household members, including:
- usual net earnings from employment;
- profit or loss from self-employment (losses are treated as negative income);
- income received from dividends (from FYE 2022);
- state support – all benefits and tax credits, including state pension;
- income from occupational and private pensions;
- investment income;
- all maintenance payments;
- income from educational grants and scholarships;
- the cash value of certain forms of income in kind, including free school meals.
Income is net of:
- income tax and National Insurance contributions;
- domestic rates and council tax;
- contributions to occupational pension schemes;
- all maintenance payments;
- student loan repayments;
- parental contributions to students living away;
- ground rent and service charges.
Income After Housing Costs is derived by deducting housing costs, including:
- rent (gross of housing benefit);
- water rates, community water charges and council water charges;
- mortgage interest payments;
- structural insurance premiums.
Negative incomes BHC are reset to zero, but negative AHC incomes are possible.
Children are defined as individuals aged under 16; or aged 16 to 19 in full-time non-advanced education.
Pensioners are defined as individuals over their state pension age at the time they are interviewed.
These Accredited Official Statistics were independently reviewed by the Office for Statistics Regulation in November 2012. They comply with the standards of trustworthiness, quality and value in the Code of Practice for Statistics and should be labelled ‘accredited official statistics’. Accredited official statistics are called National Statistics in the Statistics and Registration Service Act 2007.
Since the OSR assessment, we have continued to comply with the Code of Practice for Statistics, and have made several improvements including:
-
publications have been made significantly shorter to enable a focus on commentary and analysis;
-
our publication, including charts and images, is now available in HTML format to aid accessibility, and tables have been revised to meet accessibility guidelines;
-
the timeliness of the publication has been improved so that reports are released within 12 months of the completion of the Family Resources Survey, made possible by improvements to the background, publication and checking codes that are used to conduct analysis;
-
by making our data available on Stat-Xplore and UK Data Service, our statistics are more accessible and support new analysis for users not included in the publications themselves;
-
the quality of statistics have improved as variants of the Consumer Price Index (CPI) have replaced the use of Retail Prices Index (RPI) when adjusting for inflation, in line with guidance from the UK Statistics Authority and National Statistician;
-
improved methodology for measuring and reporting uncertainty around key HBAI estimates;
-
The content of the HBAI publication has evolved in response to user needs, and to reflect increased interest in areas such as material deprivation, household food security, and food bank usage, when combined with low income. In the FYE 2021 and FYE 2022 publications we extended our combined low-income and material deprivation measures, so they are now available for both children and working-age adults, on a relative and absolute income basis, and below three different thresholds of low income (50/60/70% of the appropriate median)
Where to find out more
Further outputs and reference tables from HBAI analysis, alongside our HBAI Quality and Methodology Information Report, giving further detail on how we estimate the measures reported here are available on the HBAI homepage.
15. Signposting to related statistics
The OSR review published in May 2021 recommended that income-based poverty statistics should improve the way they reference other data sources via signposting. This section has been expanded with additional links to sources to provide clearer and more detailed signposting to other income-based poverty statistics. This information will be reviewed and updated annually.
Other DWP National and Official Statistics
Details of other National and Official Statistics produced by the Department for Work and Pensions can be found on the DWP website with a schedule of statistical releases over the next 12 months and a list of the most recent releases.
In accordance with the Code of Practice for Statistics, all DWP National Statistics are also announced on the Government Statistics website, and in the DWP statistics release calendar.
Below Average Resources: a new poverty measure in development
DWP are developing a new additional poverty measure named ‘Below Average Resources’ (BAR) based on the approach proposed by the Social Metrics Commission (SMC). The BAR approach provides a more expansive view of available resources (both savings and inescapable costs) than the income measurement adopted under HBAI, and includes some methodological changes proposed by the SMC.
The Office for Statistics Regulation (OSR) Review of Income-Based Poverty Statistics recommended that the DWP assess how the SMC’s proposals can be implemented to enhance the public value of our statistics. The OSR recognised that a basket of main poverty measures is required to meet varying user needs, but that signposting and coherence between different statistics could be improved to help users navigate the varying measures. Once fully developed, the BAR measure will add to the understanding of poverty in the UK alongside HBAI.
The first Official Statistics in Development publication in this series was published in January 2024. We encourage all potential users of these statistics to respond to the accompanying analytical consultation, which closes on 11th April 2024.
Other official income statistics
The UK has two main, official data sources of household income statistics: the Family Resources Survey (FRS) run by the Department for Work and Pensions (DWP) and the Household Finances Survey (HFS) run by the Office for National Statistics (ONS).
The FRS estimates underpin DWP’s Households Below Average Income (HBAI) series, which is the UK’s primary source of poverty estimates. With a larger sample size, it is also the main source on household incomes. HFS data are used to produce ONS’s Household Disposable Income Inequality (HDII) and Effects of Taxes and Benefits (ETB) series, these outputs are the main source for considering the overall financial well-being of households.
The two sources of data are complimentary but there are some important methodological differences between them, which means that their income estimates can be different. For example, the FRS focuses on respondents’ weekly incomes at the time of interview, whereas HFS focuses more on annual income. The treatment of pension contributions also differs, with ONS’s estimate of Gross Household Income being calculated before pension contributions. Further details are available in the income and earnings statistics guide.
The ONS interactive tool is an additional resource which can be used to identify sources of statistics on income and earnings, and their key features. Alongside the HDII and ETB series, two other DWP publications which may be of particular interest to users with an interest in income-based poverty are:
-
Income Dynamics (ID) which looks at changes in household income including a measure of persistent low income, based on Understanding Society data;
-
Children in Low Income Families provides data on the number and proportion of children living in low-income families, Before Housing Costs (BHC), across the United Kingdom by local area.
What do you think?
We are constantly aiming to improve this report and its associated commentary. We would welcome any feedback you might have and would also be particularly interested in knowing how you make use of these data to inform your work. Please contact us via email: team.hbai@dwp.gov.uk.