Technical report: assessment of the impact of COVID-19 on the HBAI statistics for FYE2021
Updated 24 May 2022

© Crown copyright 2022
This publication is licensed under the terms of the Open Government Licence v3.0 except where otherwise stated. To view this licence, visit nationalarchives.gov.uk/doc/open-government-licence/version/3 or write to the Information Policy Team, The National Archives, Kew, London TW9 4DU, or email: psi@nationalarchives.gov.uk.
Where we have identified any third party copyright information you will need to obtain permission from the copyright holders concerned.
This publication is available at https://www.gov.uk/government/statistics/households-below-average-income-for-financial-years-ending-1995-to-2021/technical-report-assessment-of-the-impact-of-covid-19-on-the-hbai-statistics-for-fye2021
What you should know
This document is designed to help users of the HBAI statistics understand and interpret the effect the coronavirus (COVID-19) pandemic had on the sample data and estimates for financial year ending (FYE) 2021. It should be considered alongside analysis and commentary of the statistics.
Previous published statistics up to and including FYE 2020 were not affected by the coronavirus (COVID-19) pandemic. However, fieldwork operations for the FYE 2021 Family Resources Survey (FRS) were changed in response to the coronavirus (COVID-19) pandemic and the introduction of national lockdown restrictions. The established face-to-face interviewing approach employed on the FRS was suspended and replaced with telephone interviewing from April 2020 for the whole of the 2020 to 2021 survey year. This change impacted on both the size and composition of the achieved sample.
While the data for FYE 2021 has undergone extensive quality assurance prior to publication, we recommend that users exercise caution when using the data for FYE 2021, particularly when making comparisons with previous years. This is especially recommended when interpreting larger changes observed in FYE 2021 and reported in the HBAI statistical release. For several of the measures we have chosen to draw attention to the confidence intervals around the central estimates which reflect additional uncertainty around the likely degree of change.
While every effort has been made to minimise the impact of the pandemic on the range of statistics we produce, this year’s statistical release is more limited than in previous years. Discontinuities and additional biases introduced by the changes to data collection during the pandemic become more evident when the statistics are disaggregated into smaller groups. For several of the detailed breakdowns of our headline estimates we have concluded that would be difficult for users to make meaningful statistical assessments of trends and changes in the most recent year compared to the pre-coronavirus level. Due to the need for additional care when presenting and interpreting data collected during the pandemic we have taken the decision not to publish FYE 2021 additional breakdowns either in our suite of tables or via our Stat Xplore tool. Researchers and analysts outside of government will still be able to access the data through the UK Data Service.
We recommend that all users consider using the caveat “data collection for FYE 2021 was affected by the coronavirus (COVID-19) pandemic. Figures for FYE 2021 are subject to additional uncertainty and may not be strictly comparable with previous years.”
Summary of the coronavirus (COVID-19) pandemic related changes to the FYE 2021 HBAI statistics
| Change | Detail | Description |
|---|---|---|
| Methodology | Change to FRS/HBAI grossing regime | To address additional biases in the raw sample, additional grossing controls were introduced to: a) Weight the sample by month of interview to balance the sample size across the year b) Weight by level of educational attainment to boost numbers with education levels below degree level in younger age groups. |
| Methodology | Inclusion of new coronavirus (COVID-19) related income sources | Income received through the Coronavirus Job Retention Scheme (CJRS) is fully included in the estimates. Income received through the Self-Employed Income Scheme (SEISS) is indirectly included in the estimates. Other changes to income due to the coronavirus (COVID-19) have also been included e.g. self-isolation payments and take up of mortgage holidays. |
| Publication detail | The release only contains a limited number of supplementary tables to support the headline statistics and measures contained within the main statistical report. This year’s report does not include the chapter on the percentage of disabled persons in low income households, or information on child low income rates split into working/workless households. |
Published tables include: a) Information on median household income, changes in the income distribution and income inequality; b) Information on material deprivation (including in combination with low income) and household food security; c) Estimates of the percentage of individuals in low income at an overall, UK level, for the key groups of individuals, children, working age adults and pensioners, including confidence intervals. Further breakdowns of the estimates by e.g. economic status, family type, ethnicity, disability and nation/region are not available. |
| Presentational Changes | Additional emphasis on the use of confidence intervals in the main report | Confidence intervals have been displayed around the main estimates in the charts for individual and children low income percentages. They have also been published for the working age and pensioner measures and we recommend users refer to them when interpreting the changes in the FYE 2021 main estimates. |
These changes, and the rationale for them, will be discussed in more detail below. The FRS background document and HBAI methodology document should also be consulted for more details on changes to the grossing methodology and new income sources.
The changes are to be viewed as temporary and will be reviewed as we develop the FYE 2022 publication. It is too early to confirm whether the pandemic and changes to fieldwork will have any impact on the FYE 2022 release.
Main impacts of the coronavirus (COVID-19) pandemic on the FYE 2021 HBAI sample
In FYE 2021, several factors impacted on FRS response rates and the distribution of characteristics among FRS survey respondents, including:
-
change in the mode of interviewing from face to face to telephone
-
changes in the methods used to elicit responses from survey participants as the year progressed
-
changes in people’s behaviours and circumstances during the coronavirus (COVID-19) pandemic which may have made them more or less likely to respond to a household survey
While it is not possible to quantify the impact each of these factors had on the HBAI statistics, summary conclusions based on our extensive quality assurance of the sample and estimates are detailed below. The FRS background information and methodology note should also be consulted by users wishing to understand the specifics of factors (1) and (2). This document will be referred to throughout.
Change in FRS survey mode
The coronavirus (COVID-19) pandemic and imposition of national restrictions necessitated a rapid change in the established survey mode of our source data, the Family Resources Survey (FRS), with established face to face interviews usually undertaken in the home being replaced by telephone interviews.
Ordinarily changes to survey mode would not be introduced without thorough testing to examine the impact on survey and item response rates, alongside assessing impact on non-response bias and sample quality. Given that such testing was not possible, it is unclear to what extent mode changes contributed to the changes in the FYE 2021 estimates.
The change in mode could have introduced a self-selection bias, meaning respondents with certain attributes (higher civic engagement or more available time) were more likely to provide their telephone contact details. We would label such attributes as ‘unobservable’, meaning that they are not directly captured by the data and individuals with such attributes cannot be identified. However, we have sought to minimise their impact by adjusting for observed bias in the sample, some of which may correlate with the unobservable biases. Changes we identified in the composition of the achieved raw sample are detailed below.
Impact on item response accuracy
Whilst there are some nuances, our assessment is that item response accuracy was very similar in FYE 2021 compared with previous years. This is borne out by the distribution of answers to individual questions as well as evidence from the field. The focus of the FRS is the collection of factual information on incomes, which are less affected by modal change than the collection of opinions, for example. In addition, the interviewer was still able to prompt and guide the interview. Although interviewers were unable to visually verify that documents were consulted, levels of reported document checking (payslips, benefit letters, rent and council tax documents etc) were comparable to previous years. Detailed information is available in the FRS background information and methodology note.
Impact on Achieved sample size
The move to telephone interviewing resulted in a reduction in the survey response rate and a smaller achieved FRS sample size of just over 10,000 households compared with 19-20,000 in previous years. The sample size was particularly affected in the first half of the survey year, particularly April 2020, due to the challenges involved in having to rapidly adapt the FRS fieldwork approach in response to government restrictions on household mixing.
In previous survey years, the share of the FRS sample was roughly equal across months of the year. In FYE 2021, additional grossing had to be introduced to balance the sample across the year. This meant that the responses from those who were sampled in April 2020 were given the same weight as those sampled in any other month. It was important to make this adjustment because during FYE 2021 incomes were likely to have fluctuated more in-year than in previous years.
Please note that we grossed the sample to a set target number of households per month and applied no further monthly weights to adjust the composition of the grossed sample per month. For example, the FRS/HBAI grossing regime applies weights to ensure that the sample is representative of the population in terms of age, gender and region, but it does so on an annual basis. If the raw sample for one month has a lower share of a particular age group, then it will continue to do so following grossing.
The FRS sample is drawn using household addresses. In the first half of the year there was a requirement for respondents to proactively provide interviewers with their contact details. In the second half of the year, additional changes to fieldwork approaches were introduced to improve survey response rates by engaging new methods of contacting respondents. These included initiatives such as telematching and Knock to Nudge (KtN), although not all initiatives were introduced in all nations, and the impact in stimulating response or otherwise was variable across the respondent base. Knock to Nudge was used where telephone numbers were not provided or sourced by another route. Further details are provided in the FRS background information and methodology report.
While these initiatives were successful in boosting the sample size, it is possible they may have introduced additional biases by making it more likely that responses were elicited from households or persons sharing certain characteristics. A fieldwork report published by the Office for National Statistics (ONS) on 14 February 2022 assesses the impact similar initiatives had on sample characteristics for other household surveys such as the Survey on Living Conditions (SLC) and the Living Costs and Food Survey (LCF).
It has not been possible to conduct detailed analysis on the impact of such initiatives on the HBAI sample or estimates because we do not have the detail on which household interview was conducted by which route.
Impact on the composition of the achieved sample
Older, more affluent and better educated participants
The composition of the raw FYE 2021 sample was skewed towards older participants, owner occupiers and fewer households with children than in 2019/20. This was an effect witnessed across other government household surveys conducted during the period of the pandemic, many of which also introduced telephone interviewing. The ONS fieldwork report referenced provides a useful summary for five of its surveys, but additional links to the Labour Force Survey and English Housing Survey are also provided.
The impact of the mode change on sample composition is likely to be greater for FRS/HBAI than for surveys such as the Labour Force Survey, which contain a longitudinal element. This means they are already able to recontact a proportion of their sample each quarter. A fresh HBAI sample is drawn every year, and there is no previous relationship with respondents.
Whilst the FRS and HBAI weighting regimes already bring the age and tenure profile in line with the UK population, closer examination of the initial weighted sample revealed it contained a disproportionate number of working age respondents who had been educated to at least degree level. It was important to adjust for this bias because income levels are strongly correlated with the level of education achieved. Therefore, additional grossing controls were introduced to rebalance the educational levels of those in the sample. In previous survey years, the profile of respondents according to their level of education was comparable to the levels and trends seen in the population, reported in the Annual Population Survey (APS). Therefore, it was not considered necessary to make a change to the weighting employed in previous years. More information on the grossing changes introduced in FYE 2021 can be found in the HBAI Quality and Methodology Information Document.
It is difficult to provide evidence which confirms beyond doubt the reasons why the FRS sample contained these initial biases. It is likely that household circumstances may have prevented some households from taking part in the survey during the pandemic. For example, those who were home schooling, or who had caring responsibilities may have been less inclined to take part in the survey. Likewise, those who experienced sudden change in their employment or income status may have not wished to complete a survey on household incomes during a period of uncertainty.
Greater Prevalence of disability among those of working age, less among pensioners
Disabled people are identified in the FRS as those who report any physical or mental health condition(s) or illness(es) that last or are expected to last 12 months or more, and which limit their ability to carry out day-to-day activities a little, or a lot.
There were changes in the prevalence of disability reported in the FYE 2021 FRS data, with the grossed sample showing a 2 percentage point increase in the proportion of working age adults reporting a disability, and a 4 percentage point decline in the proportion of pensioners reporting a disability (see FRS table 4.1). For the working age, some of these changes may be a direct consequence of coronavirus restrictions limiting movement outside of the home. In the early months of the pandemic, those asked by the NHS to shield in the home may have been more responsive to the telephone survey. Some support for this possibility is offered in Figure 1 below which shows there was a notable increase in the proportion of disabled people who classified their impairment as ‘Other’. Many of the conditions covered by the shielding guidance – e.g. conditions causing a weakened immune system - do not fit neatly into the other categories of impairment listed below.
Figure 1: Impairment types reported by disabled people in the FRS, FYE 2019 to FYE 2021, United Kingdom
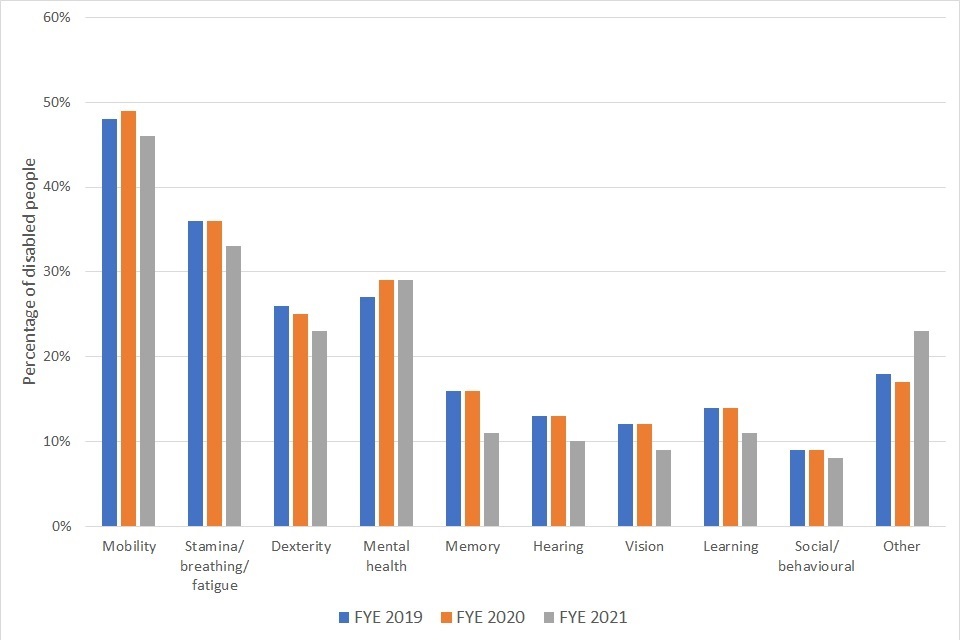
(Percentages in the chart above are taken from the FRS and do not sum to 100% as disabled persons can report multiple impairments)
Our assessment is that while some of the change in disability may have been genuine, we believe a significant portion of it was due to sample bias. This is because we are unable to explain some of the changes in the sample with reference to changes in the real world. For example, although we saw an increase in the number of disabled people, particularly in the ‘other’ category, there were notable decreases in numbers reporting other types of impairment such as in hearing, memory or vision, compared to previous years. This was likely a consequence of the change in mode rather than a real-world reduction in prevalence. It was not possible to further adapt the FRS grossing regime to adjust for this observable bias. The impact this had on the HBAI disability estimates is described later in the document.
Main impacts of the coronavirus (COVID-19) pandemic on FYE 2021 published material
Publication of breakdowns of headline measures
This year it has been challenging to disentangle how much of the change seen in the composition of the sample and estimates reflects genuine change and how much is due to sample bias. During the coronavirus pandemic there was unprecedented change in both household circumstances and incomes which were not comparable to any previous survey period. For examples of publications detailing this, please see the following:
-
the Office for National Statistics’ Personal and economic well-being in Great Britain: May 2021
-
Understanding Society’s research paper A year of COVID: the evolution of labour market and financial inequalities through the crisis Understanding Society, published in November 2021
In addition, this year’s smaller achieved sample has made it more difficult to analyse trends, especially at sub-national levels, or across different family types or employment statuses. For several of the detailed breakdowns of our headline estimates we concluded that users would be unable to make meaningful statistical assessments of trends and changes in the most recent year compared to the pre-coronavirus period. Due to the need for additional care when presenting and interpreting data collected during the coronavirus pandemic we took the decision not to publish FYE 2021 additional breakdowns either in our suite of tables or via our Stat Xplore tool.
We intend to make the dataset underpinning the statistics available for use by researchers and analysts by depositing it in the UK Data Service (UKDS), alongside the FRS, as in previous years. We recommend that users exercise additional caution when using the data for FYE 2021, particularly when making comparisons with previous years and interpreting changes in smaller subgroups. We would encourage users to refer to published confidence intervals where appropriate. We also would like to invite users to inform us directly of any additional issues they identify during in-depth analysis of the dataset so we can assess for any continuing impacts on the FYE 2022 publication.
Impact on Publications which draw on the HBAI data
Several other publications make use of the HBAI dataset to inform their statistics and estimates which cover specific sub-groups of the population. These publications may help provide users with more useful context on changes to incomes during the coronavirus pandemic.
We are content that we can present the 2020/21 statistics to the appropriate level of quality to proceed with full releases for Pensioners’ Incomes (PI) Series and experimental Separated Families Statistics. We are also content to use Households Below Average Income data in the production of the Children in Low Income Families (CILIF) local area statistics, although the release will be focused on local authority and parliamentary constituency comparisons within countries and not comparisons across countries.
The devolved administrations of Scotland, Wales and Northern Ireland are content with this approach and this aligns with their approaches to publishing statistics on income in their countries: Scotland are not publishing their poverty statistics but publishing an analytical report explaining why; Wales and Northern Ireland are planning to publish their poverty statistics with additional narrative to inform users of the limitations.
Wider estimates of uncertainty around the headline estimates
Use of survey data means results in the HBAI publication are subject to uncertainty which can affect how changes in the figures should be interpreted, particularly in the short term. Statistical significance is a technical concept that states whether a reported change is likely to have arisen only by chance due to variations in the sampling. We calculate 95% confidence intervals around estimates in HBAI which sets a standard that, where any change is reported as statistically significant, there is less than a 1 in 20 chance that the reported difference is due to sampling variation and there is actually no real underlying change. In the HBAI publication, changes are not statistically significant unless highlighted by an asterisk (*).
The reliability of the results of sample surveys, including the Family Resources Survey, is positively related to the unweighted sample size achieved. Smaller samples result in wider confidence intervals being generated to reflect the higher degree of uncertainty that the sample we have achieved is representative of the general population. Given the reduced sample size in FYE 2021, confidence intervals around the main estimates are at least 70% wider than in previous years, meaning that the degree of change in the estimates needed to be larger before we can be confident it is statistically significant. Alongside choosing to visually present confidence intervals around some of our estimates this year to illustrate this additional uncertainty, we also publish the full range in our published tables and these are referred to throughout the publication.
Please note that when generating confidence intervals there is no statistical method of further widening them to capture the impact of unquantifiable sampling error or bias, as outlined in this report. We recommend that the content of this document is considered when interpreting any changes in the estimates compared to the pre-coronavirus level.
For the HBAI publication we use a method called ‘bootstrapping’ to generate representative resamples from the HBAI data and produce our confidence intervals. This year, we reviewed options for adjusting the bootstrapping method given the smaller sample sizes. Internal analysis confirmed that any proposed change had only a small impact on the width of the published confidence intervals, so we maintained our existing methodology. Further detail on the current approach can be found in the HBAI quality and methodology document.
Main impacts of the coronavirus (COVID-19) pandemic on the FYE 2021 HBAI estimates
Changes in household composition
Some of the internal quality assurance we have completed on the grossed sample suggested that there were changes in household composition and formation in the population during FYE 2021. There was a small but notable shift in childless single adults changing from living with other childless single adults to living with a couple, see Figure 2 below. For example, this might represent a young adult who was living in a houseshare with other young adults moving back into the parental home. Our sample also contained more households containing working age couples without children who may have chosen to form support bubbles.
Because individual estimates of income in HBAI are dependent on the circumstances of the entire household, changes in household formation and composition will have influenced our estimates of the numbers and types of individuals who have income below the low-income threshold. Changes in living arrangements also affect individual housing costs.
Figure 2: Shift in UK working age household composition in FYE 2021, compared with previous survey periods

Changes in employment levels and benefit receipt
During FYE 2021, the Labour Force Survey reported a fall in the official employment rate which included a reduction in the number of self-employed workers compared to the pre-pandemic period. There was also an increase in the numbers who claimed Universal Credit (UC) over the period.
The FRS asks questions on employment status, so any changes in employment levels seen during FYE 2021 should be reflected in HBAI estimates. We have compared the levels of employment and self-employment reported in HBAI with those reported by the Labour Force Survey (LFS) and have found a similar degree of change across FYE 2021. The main difference was that HBAI captured slightly higher levels of part time work than the LFS, but this is likely due to definitional differences between the two data sources.
The FRS asks respondents about receipt of the full range of state benefits, and amounts received, including Universal Credit. There is a known undercount for a number of these benefits, which means that when grossed to population totals, the FRS still estimates that there are fewer receiving the benefits than is reported by administrative data. This difference can be due to two factors: underreporting by the respondent and sample bias which means the FRS is not capturing those individuals and they remain underrepresented in the sample. Further information on the level of undercount can be found in FRS table M6a.
The HBAI estimates capture the growth in the Universal Credit caseload seen over the whole of FYE 2021, but there was variation in the degree of undercount across the year.
Table 2: FRS Universal Credit undercount in the first and second half of the survey year (grossed sample)
| FYE 2020 | FYE 2021 | Apr 20 to Sept 20 | Oct 20 to Mar 21 | |
| FRS UC undercount | -32% | -35% | -42% | -5% |
|---|
Table 2 shows the difference between the grossed number of recipients of Universal Credit (UC) estimated by the FRS, and the average count of UC recipients recorded in the DWP’s administrative data for the same period, published as National Statistics. It compares the percentage difference between these two figures for multiple time periods.
The table shows that during the initial months of the survey year (April to September 20), the UC undercount was higher, but was much lower in second half of the year to bring the annual level of undercount back similar levels as recorded in FYE 2020 (i.e. an annual undercount of about a third). The in-year changes introduced to the FRS fieldwork (telematching and knock to nudge) are likely to have helped to improve the undercount in the second half of the year, but because we do not have the data on which sampled cases were contacted using which method, it is impossible to be sure.
The degree of UC undercount directly influences low income rates so became a crucial consideration when validating some of the results for smaller groups. The impact this had on the HBAI low income estimates, particularly for smaller groups, is discussed below.
Variation in in-year child low income rates
We identified that in FYE 2021, low income rates were more variable across the year compared with previous years, largely affecting non-pensioner groups. To an extent this might be expected due to household incomes changing over the course of the pandemic in response to the wider context of legal restrictions, and associated changes to employment and unemployment. However, the patterns that we saw in the data were not always in the direction we expected, at the times we expected.
The changes in in-year low income rates were most prevalent when looking at the percentage of children in low income households by month (example below).
Figure 3: Percentage of children in absolute low income BHC by month, FYE 2021
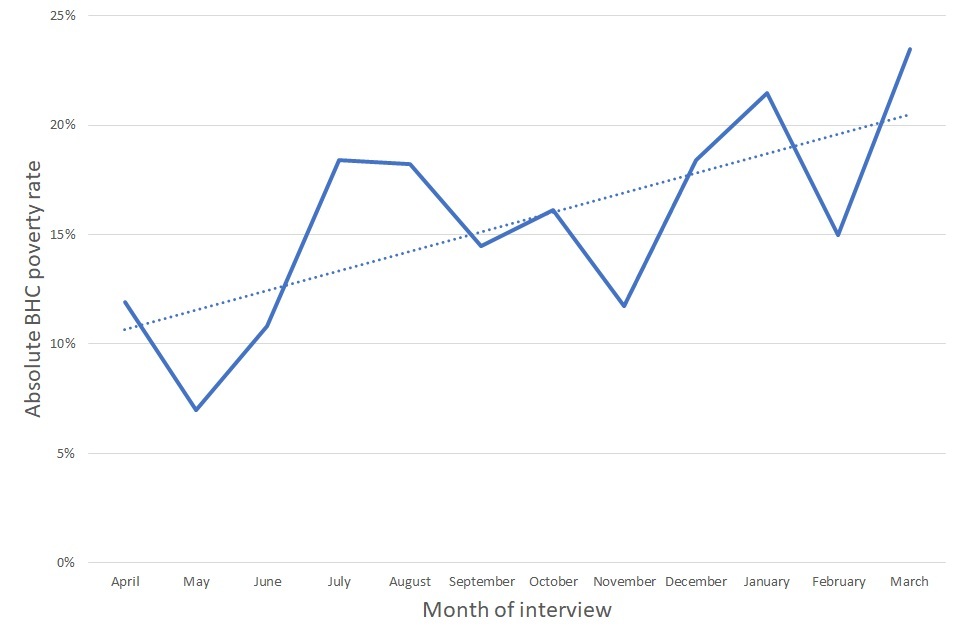
In Figure 3 we can see that child low income rates are much lower than we would expect in the initial months of the year, but higher than we would expect in the later half of the year. Prior to completing the analysis, we had expected the opposite pattern, with higher rates of low income in the initial months of the pandemic, when research suggests there was the most abrupt changes to household incomes and circumstances. Conversely, we may have expected lower rates in the second half of the year reflecting economic recovery and less severe restrictions on trading and movement. Our conclusion was that the changes we saw in the data were likely related to variation in the UC undercount, as shown in Table 2.
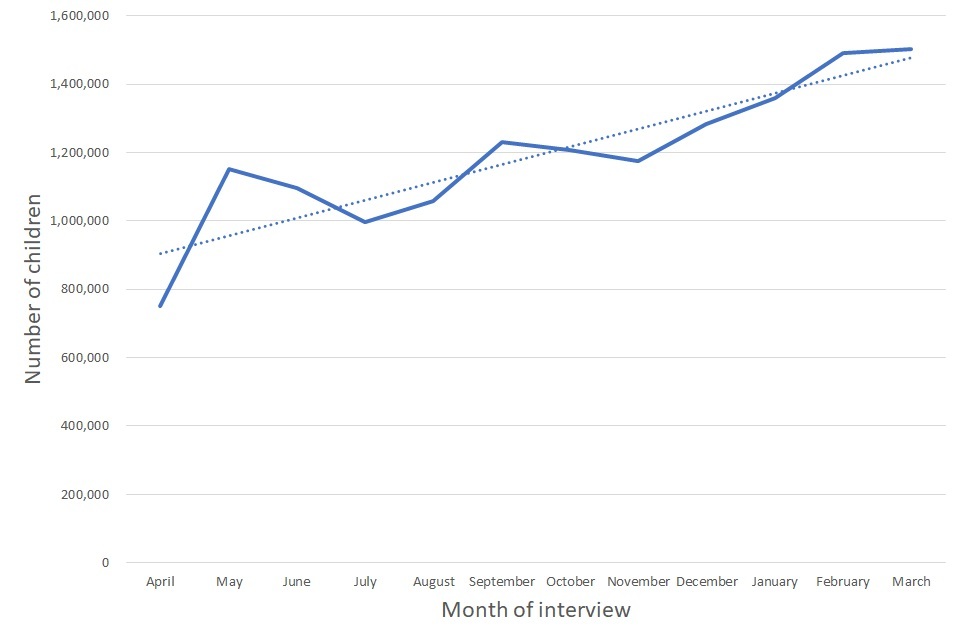
For groups most affected by the UC undercount, consideration was given to the extent to which these patterns offset each other over the course of the year, and the reliability of the annual low income estimates. While the low income rates are much lower in the initial months, they are also weighted less because there were fewer children captured in the grossed sample in the early months, with the opposite being true in the later months of the year (see Figure 4).
Figure 4: Grossed number of children in the FRS sample by month, FYE 2021
Our assessment was that when considering the published child low income estimates for the entire year, at UK level, the results are reliable. However, we are more uncertain of the degree of change, and for this reason advise extra caution when interpreting the statistics and encourage users to refer to the confidence intervals we have published alongside the measures.
Change in in-year child low income rates for specific groups
The picture presented above becomes more volatile when the child low income rates are disaggregated further into subgroups such by family type, work status and region .
We looked in detail at the groups and breakdowns most affected by patterns outlined above, with several showing movements in their child low income estimates which were difficult to explain. This assessment was made more challenging given greater degrees of sampling variation due to smaller sample sizes. We concluded that for many groups it was not possible to make meaningful statistical assessments of trends and changes in FYE 2021 compared to the pre-coronavirus level.
We appreciate that researchers and analysts using the HBAI dataset may wish to analyse changes in low income rates for subgroups of interest. We advise additional caution when interpreting any changes in the measures and to consider these estimates alongside long-term trends. For other users of the data, we recommend using the FYE 2020 figures which still remain available on our web page.
More detail on some of the specific affected groups is provided below. It is not exhaustive. It has not been possible for us to validate all breakdowns at all levels, so there may be wider impacts we have not identified. We invite users of the HBAI dataset to inform us of any additional data insights which may be useful to us as we begin to prepare and analyse the FYE 2022 data.
Single parent households in low income
Our internal analysis suggested that single parent households on UC were most impacted by the variation in the UC undercount, with much lower than expected single parent households on UC taking part in the survey in the early months, and accounting for a higher than expected proportion of the sample in the later months.
It is possible that single parent households were less available in the early months of the pandemic, but more responsive to the introduction of initiatives like knock to nudge. The small number of single parent households the FRS sampled in the earlier months were less likely to receive UC, and hence this reduced low income rates for those months.
Child low income rates by region and country
There were important differences in how much the undercount changed during the year when looking at child low income rates split by country and region. This had the largest impact on the Scotland sample. While the English regions and Wales showed the expected recovery in the UC undercount in the second half of the year, this was not true of Scotland, where the Knock to Nudge initiative was not introduced. Therefore, we did not consider the estimated FYE 2021 child low income rate to be a representative or reliable indicator of true child low income rates in Scotland during the pandemic.
For Wales and the other regions, we did not find evidence of the same degree of bias, but sample size issues affected the estimates, particularly for smaller regions like the North East and Wales. Although in the HBAI publication we normally advise users to apply a three year average to the regional figures to smooth out these types of variation, in the time available we were unable to validate all of the results to be assured that they were of sufficient quality to publish.
Change in earnings from employment
During FYE 2021 many households experienced variation in their earnings within the survey year due to changes in employment and hours worked and/or receipt of support grants through schemes such as the Coronavirus Job Retention Scheme (CJRS) or the Self Employment Income Support Scheme (SEISS). From May 2020, the FRS questionnaire incorporated questions to specifically ask about receipt of CJRS and from June 2020, this was extended to SEISS.
For employees, receipt of CJRS (aka ‘furlough’) and any resulting impact on levels of pay is fully reflected in the HBAI estimates. Employees who are furloughed have been classified as employed, but temporarily away from work. This will mean that, all things being equal, furloughed workers will not reduce the number of people in employment (or the employment rate). The calculation of ‘income from employment’ uses wages which are treated as income rather than state support, irrespective of any support payments from CJRS that the respondent’s employer was receiving in respect of their employment.
Change in earnings from self-employment
For the self-employed, it is difficult to calculate current-year income, and in line with international standards, the FRS questionnaire asks for profit data for a previous tax year and/or regular self-employment income over the past twelve months. While this is less of an issue when incomes are broadly stable, it became more of a challenge in FYE 2021 given the sharp changes in self-employed incomes over the course of the pandemic. Although from June 2020 the FRS specifically asked about receipt of SEISS grants and amounts, questions were not asked about receipt of income from continued trading which was permissible under the terms of the scheme. It was therefore not possible to adapt our methodology to estimate in-year income more accurately, taking account of both SEISS and non-SEISS sources.
This means that the HBAI estimates indirectly, rather than explicitly, include information on the amount of SEISS received. This is because we pull through information on previous trading profits, upon which the SEISS grants are based. For those in the sample who responded averaging their income over a twelve-month time horizon, those sampled towards the end of the year will report more income over the period of the pandemic. While there was an option to ‘add in’ the SEISS amounts received for this group, there was a risk of double counting, as there was evidence that some respondents had already included income from SEISS in their responses.
Overall, the HBAI estimates pointed to a significant reduction in real terms self-employed income over the course of FYE 2021. This led to an increase in the proportion of self-employed individuals with income below the low-income threshold. While this was in line with the limited external data sourced on changes to self-employed hours during the pandemic, there is considerable uncertainty on the degree of change. Our assessment is that there was some offsetting in the estimates, whereby we may have overestimated the incomes of those reporting profit data and underestimated it for those reporting in-year data. However, given the imperfection of the methodology any estimates based on this group should be treated with additional caution. Our methodology will be reviewed again for the FYE 2022 estimates.
Sensitivity analysis completed internally showed that, as in other years, changes to self-employed incomes had only a marginal impact on the overall estimated proportions of the population in low income.
Change in income from benefit receipt
In FYE 2021 there were several policy changes announced in response to the pandemic which affected the amounts of benefit received. Most notably, from April 2020, both new and existing Universal Credit claimants and existing Working Tax Credit claimants received a temporary additional £20 per week on top of annual uprating, also known as the ‘UC Uplift’. Resultant changes in benefit income due to the UC uplift and all other policy changes, including annual uprating, are included in the HBAI estimates.
Change in low income rates for individuals where somebody in the family is disabled
Changes in the prevalence of disability, and biases towards certain types of impairment, would not have been of concern if the incomes of disabled persons who responded to the survey in FYE 2021 were similar to those who responded in FYE 2020, or if the reductions in low income rates were similar to non-disabled persons.
However, this year’s HBAI estimates reported statistically significant reductions in the low-income rates for those who lived in a family unit where at least one person was disabled, with some of the reductions in specific sub-groups being particularly large. We were concerned about the under-representation of those reporting certain impairments in the disabled population (memory, hearing and vision), who in previous years were more likely to have higher proportions in low income (see Table 3, below). Similarly, those who reported ‘other’ impairments were less likely to have incomes below the low income threshold.
Table 3: Change in the FRS disabled population by impairment and FYE 2020 percentages in absolute low income
| Impairment reported | FYE 2020 HBAI low income rate (Absolute, BHC) | Change in the number of disabled people reporting the impairment (FRS FYE 2021, millions) |
|---|---|---|
| Mobility | 16% | -0.2 |
| Stamina/breathing/fatigue | 15% | -0.3 |
| Dexterity | 17% | -0.2 |
| Mental health | 17% | 0.2 |
| Memory | 19% | -0.7 |
| Hearing | 19% | -0.5 |
| Vision | 19% | -0.4 |
| Learning | 16% | -0.3 |
| Social/behaviour | 22% | -0.1 |
| Other | 16% | 0.9 |
Closer examination of the under- and over-representation by impairment type revealed that it affected both working age and pensioner disability groups. In addition, the under-represented groups had the largest estimated reductions in disability low income rates. As we were unable to explain these trends with reference to external evidence or policy change, we concluded that the composition of the disabled FRS population was too different in FYE 2021 to make any meaningful comparisons with previous years. We felt that the grossed sample also contained elements of bias towards certain impairments, possibly introduced by the move to telephone interviewing. For this reason, we took the decision to remove the disability chapter and supporting tables from the HBAI publication.
We would strongly advise researchers using FYE 2021 HBAI disability estimates to exercise additional caution when interpreting any trends as the characteristics of the disabled households who responded to the survey were different to previous years and estimates may not be strictly comparable.
Impact of the coronavirus (COVID-19) pandemic on the FYE 2021 HBAI material deprivation estimates
In the HBAI publication, we publish estimates of the percentage of benefit units with children who are materially deprived, including in combination with a series of low-income thresholds, and also an estimate of the percentage of pensioner households who are materially deprived.
We measure material deprivation by asking respondents a series of questions about their household circumstances and access to a range of goods and services, which, if lacked, contribute towards a deprivation score for that household. Those households who score above a set threshold are materially deprived. Please see the HBAI quality and methodology note for detailed information on the approach.
In FYE 2021, several of the questions asked as part of the measure were affected by government restrictions introduced in response to the coronavirus pandemic. This meant that it was not possible for those sampled to access a number of social opportunities or services during periods of lockdown, regardless of deprivation or financial constraint. These included opportunities such as school trips, socialising with friends or family, attending organised activities or pursuing hobbies, going on holiday and getting a haircut. Some of those in the sample may have responded to these questions with their ordinary circumstances in mind. Others may have responded according to their actual circumstances, and it has not proved possible to separate this out in the FRS data. The implications this had for the measures of material deprivation are set out below.
For FYE 2021, it should be noted that all estimates of material deprivation are not comparable with previous years. We do not recommend that FYE 2021 estimates are directly compared with previous years, as it cannot be concluded that the change in recorded material deprivation during FYE 2021 represented a real change in household circumstances.
Child material deprivation
In the methodology, any person who responds with “does not apply” is treated as NOT being deprived of the item in question. In Figure 5, below, we have provided information on the proportion of ‘does not apply’ responses to all questions asked of the child compared to previous years.
Figure 5: Proportion of ‘does not want/need/does not apply’ responses to all children questions in the child material deprivation measure, FYE 2019 to FYE 2021

There was a notable increase in “does not apply” responses to many of the questions, most of which we have assessed to have been directly affected by government restrictions during FYE 2021. This meant that lower levels of deprivation were recorded for those questions, compared to past non-pandemic circumstances.
These were: ability to hold celebrations on special occasions, having a one-week holiday away from home, pursuing a hobby, regularly having friends round for tea, going on school trips, attending playgroups, and attending organised activities at least once a week.
We also ask questions of whether the parent had access to a number of items and services, which are combined with the children questions in the overall measure. These were less affected by pandemic as the questions focus on ability to afford items, replace goods or pay bills. For more information on each question, please see the full breakdown of item responses in HBAI tables 1.4e (BHC), 1.4e (AHC), 1.4f (BHC) and 1.4f (AHC).
It is difficult to quantify how much of the reduction in material deprivation we recorded in FYE 2021 was a result of lockdown constraints and how much was genuine change, or whether different responses to the questions would have resulted in higher levels of material deprivation. Some households will have already accumulated enough points from other questions to be considered materially deprived. Others will have remained below the threshold even if they would ordinarily have answered ‘yes’ to a small number of the questions. The likelihood of a household accumulating enough points to cross the material deprivation threshold depends not just on their responses to individual questions, but groups of questions, and the importance each question makes to the overall deprivation score is also weighted according to the prevalence of access to that item in the population.
In Annex 1 we have provided the results of some internal modelling which estimated a maximum likely impact of the increased rate of “does not apply” responses on material deprivation prevalence in FYE 2021.
Pensioner material deprivation
Unlike the child deprivation measure, it was not possible for pensioner households to initially respond ‘does not apply’ to the questions. Instead, if the pandemic limited their ability to experience an opportunity or access a service, they would answer “no – I cannot access this” and provide more detail on the reason why from a predefined list including health and financial reasons. Although there was not a specific option to capture coronavirus (COVID-19) related reasons, for those questions affected by the pandemic there was an increase in the proportion of respondents who gave ‘other’ as the primary reason.
In Figure 6, below, we have provided information on the proportion of no responses to all pensioner material deprivation questions asked compared to previous years. Full detail of the responses to the questions asked on pensioner material deprivation is provided in HBAI 1.6d (BHC) and 1.6d (AHC), alongside the most common reason for being unable to access each item.
Figure 6: Proportion of no responses to all questions in the pensioner material deprivation measure, FYE 2019 to FYE 2021

The questions assessed as being directly affected by government restrictions during FYE 2021 were: ability to socialise once a month, ability to see friends and family once a month, having a holiday away from home, and having a regular haircut. For the pensioner measure, if an item cannot be accessed for any reason other than they do not want or need it, they are treated as being deprived of the item. This the different to the child measure, where the ‘does not apply’ responses do not contribute towards the material deprivation score. This meant that higher levels of deprivation were recorded for those questions, compared to past non-pandemic circumstances.
Once again, it is difficult to quantify what the responses to the affected questions would have been in ‘normal’ circumstances, and how that would have impacted on the recorded levels of pensioner material deprivation in the FYE 2021 publication. It is important to note, however, that for most the questions we judged to be unaffected by the pandemic - e.g. ability to replace the cooker, pay bills, or access a telephone - lower levels of deprivation/fewer ‘no’ responses were recorded compared to previous periods.
Annex 1
The maximum likely impact of increased “Child(ren) do not want/need this/does not apply” responses on the level of child material deprivation
Methodology
There are 21 questions which contribute to the child material deprivation score, two of which do not allow for “does not apply” answers. For each of the remaining 19 questions the proportion of “does not apply” answers was plotted as a trend from 2010/11 (when the current child material deprivation questions were introduced) to 2019/20 and then the trend was forecast forward 1 year to give a “does not apply” rate for 2020/21. This forecasted rate for 2020/21 was compared to the actual rate in 2020/21 and any questions that had a higher actual rate than the projected rate were targeted for imputation, this applied to 13/19 questions.
For each of the 13 questions targeted, the difference between the actual and forecast rate was calculated and “does not apply” answers were changed to “Child(ren) would like to have this but we cannot afford this at the moment” for the number of children equal to the difference in rates. These children were picked randomly from the group with “does not apply” answers and each child in the same family (benefit unit) were treated the same. This switches the answer outcome from being treated as not materially deprived to being treated as materially deprived. This allows the maximum impact of the increase in “does not apply” rates to be estimated.
For each of the 13 questions new prevalence weightings were calculated to allow new child material deprivation scores and flags to be calculated. Where there was no “does not apply” answer or the children weren’t randomly selected to be changed the original answers were used with the new prevalence weightings. Finally, a new UK child material deprivation score was calculated. To account for the randomness in which children were selected to have their “does not apply” answers changed, the process was run 100 times and the median UK child material deprivation score was taken.
Results
In 2020/21 the child material deprivation score fell by 2 percentage points from 17.9% to 15.9% compared to 2019/20. The median adjusted child material deprivation score for 2020/21 was 17.0%, suggesting the maximum likely impact of the increase in “does not apply” answers would account for roughly half the fall in child material deprivation.
Table 4: Modelled estimate of the likely level of child material deprivation in FYE 2021 assuming changes in the profile of “does not apply” responses
| Child material deprivation score | |
| 2019 to 2020 | 17.9% |
|---|---|
| 2020 to 2021 | 15.9% |
| 2020 to 2021 adjusted | 17.0% |
Example of how modelled responses were generated for each item
Figure 7: P roportion of ‘does not apply’ responses to ‘my child is able to attend an organised activity once a week’ in FYE 2021 (actual) and FYE 2021 (modelled)
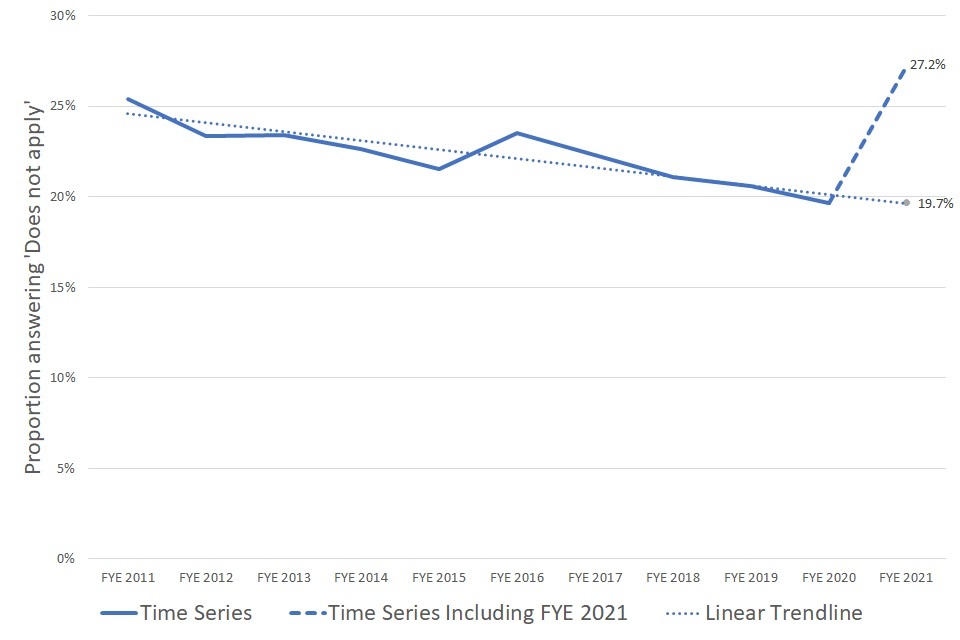
The question asking about whether children attend an organised activity once a week saw the “does not apply” rate jump up from 19.7% in 2019/20 to 27.2% in 2020/21. However, using a simple forecast we might expect the rate to have remained at 19.7% in 2020/21, a difference of 7.5 percentage points which equates to approximately 300 sample cases. From the group of “does not apply” answers, a subset of 300 was chosen at random to be changed to “Child(ren) would like to have this but we cannot afford this at the moment”. A new prevalence weight was calculated and this was repeated for all 13 questions with higher “does not apply” rates.
The process was repeated 100 times, each with a new selection of 300 sample cases chosen to account for randomness in the selection. Children could only be selected once in each subset of 300 but in multiple subsets across the 100 iterations.