Households below average income: an analysis of the income distribution FYE 1995 to FYE 2021
Updated 24 May 2022

© Crown copyright 2022
This publication is licensed under the terms of the Open Government Licence v3.0 except where otherwise stated. To view this licence, visit nationalarchives.gov.uk/doc/open-government-licence/version/3 or write to the Information Policy Team, The National Archives, Kew, London TW9 4DU, or email: psi@nationalarchives.gov.uk.
Where we have identified any third party copyright information you will need to obtain permission from the copyright holders concerned.
This publication is available at https://www.gov.uk/government/statistics/households-below-average-income-for-financial-years-ending-1995-to-2021/households-below-average-income-an-analysis-of-the-income-distribution-fye-1995-to-fye-2021
The Households Below Average Income (HBAI) report presents information on UK living standards based on household income measures for Financial Year Ending (FYE) 2021. Estimates are provided for average incomes, income inequality, and for the number and percentage of people living in low income households. The statistics are the UK’s official source of poverty estimates and are also the main and recommended source on household and individual incomes.
The HBAI statistics are commonly referred to as ‘poverty statistics’ which show the number or percentage of people living in poverty. This publication uses terms such as ‘income statistics’ and ‘people living in low income households’ to describe more precisely what the data reflects. Although low income is a significant aspect of poverty, there are other aspects of poverty too. This publication additionally includes data on ‘material deprivation’, which provides an indication of peoples’ ability to access or afford a range of everyday goods and services. Information is also included on household food security, which measures the percentage of households considered to have access to sufficient, varied food to facilitate an active and healthy lifestyle.
In this report, comparisons between years are generally made using percentages rounded to the nearest percentage point for each year. This year, none of the changes reported in the headline measures between FYE 2020 and FYE 2021 were statistically significant.
Impact of the coronavirus (COVID-19) pandemic on these statistics
Fieldwork operations for the Family Resources Survey (FRS) FYE 2021 were rapidly changed in response to coronavirus (COVID-19) pandemic and the introduction of national lockdown restrictions. The established face-to-face interviewing approach employed on the FRS was suspended and replaced with telephone interviewing for the whole of the FYE 2021 survey year. This change impacted on both the size and composition of the achieved sample.
While the data for FYE 2021 has undergone extensive quality assurance prior to publication, we recommend that users exercise additional caution when using the data for FYE 2021, particularly when making comparisons with previous years. This is especially recommended when interpreting larger changes observed in FYE 2021 and reported in this statistical release. For several of the headline measures in the publication, we have chosen to emphasise or display confidence intervals alongside the central estimates to reflect additional uncertainty.
A technical report providing detail of the impact of the coronavirus (COVID-19) pandemic on the sample and estimates is available and should be considered alongside interpretation of these statistics.
While every effort has been made to minimise the impact of the coronavirus (COVID-19) pandemic on the range of statistics we produce, this year’s statistical release is more limited than in previous years. Discontinuities and additional biases introduced by the changes to data collection during the pandemic become more evident when the statistics are disaggregated into smaller groups. For several of the detailed breakdowns of our headline estimates we have concluded that would be difficult for users to make meaningful statistical assessments of trends and changes in the most recent year compared to the pre-coronavirus (COVID-19) pandemic level. Due to the need for additional care when presenting and interpreting data collected during the coronavirus (COVID-19) pandemic, we have therefore taken the decision not to publish FYE 2021 additional breakdowns either in our suite of supplementary tables or via our Stat Xplore tool. The source data behind these statistics will still be made available for download and further analysis via the UK Data Service (UKDS), and we would welcome any feedback or additional data insights from our external users.
For more information on the specific changes to this year’s publication, please see the ‘New for this publication’ section below.
1. Main stories
The statistics presented in this release show that:
-
there was a reduction in median household income between FYE 2020 and FYE 2021, both before housing costs (BHC) and after housing costs (AHC). The reduction represented a decrease in real terms of 1.7% (BHC) and 1.4% (AHC)
-
growth in household income (BHC) varied across the income distribution:
-
the household incomes of individuals in the bottom quarter of the income distribution recorded positive real terms income growth
-
those between the 30th and 80th percentiles recorded a reduction in real incomes
-
there was a more mixed picture for the highest income quintile
-
-
there was a 1 percentage point reduction in income inequality (Gini Coefficient) in FYE 2021, both before and after housing costs, with the trend remaining broadly stable since FYE 2011
-
the percentage of individuals in relative and absolute low income decreased both before and after housing costs in FYE 2021. The pattern was similar for individual groups (children/pensioners/working age adults), with the only measure not to decrease being absolute low income BHC for working age adults
-
relative low income measures showed larger decreases than their absolute low income equivalents
-
the changes in the low income measures are subject to more uncertainty in FYE 2021 due to the impact of the coronavirus (COVID-19) pandemic on survey data collection. None of the changes since FYE 2020 were statistically significant
-
a fall in material deprivation was recorded for pensioners, and in the measures of combined low income and material deprivation for children. However, the introduction of coronavirus (COVID-19) pandemic restrictions impacted on the measurement of material deprivation which means that recorded levels are not directly comparable with previous years
Median Household Income - Decrease to £539 (BHC) and £472 (AHC) in FYE 2021
Figure 1: Median Household Income, FYE 2003 to FYE 2021
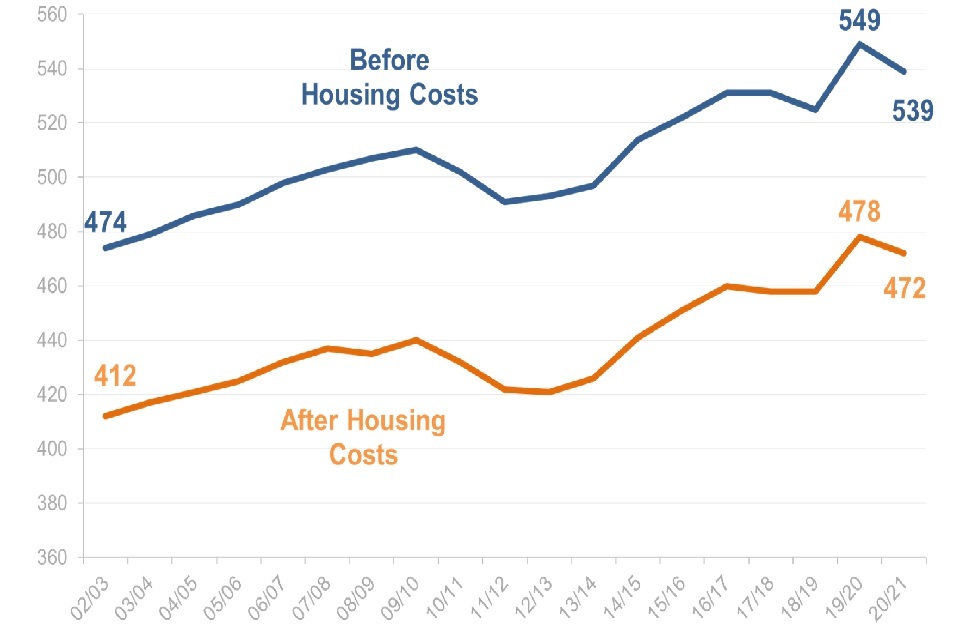
Between FYE 2020 and FYE 2021, average (median) household net equivalised disposable income decreased in real terms (i.e. taking account of inflation) to £539 (BHC) and to £472 (AHC) respectively.
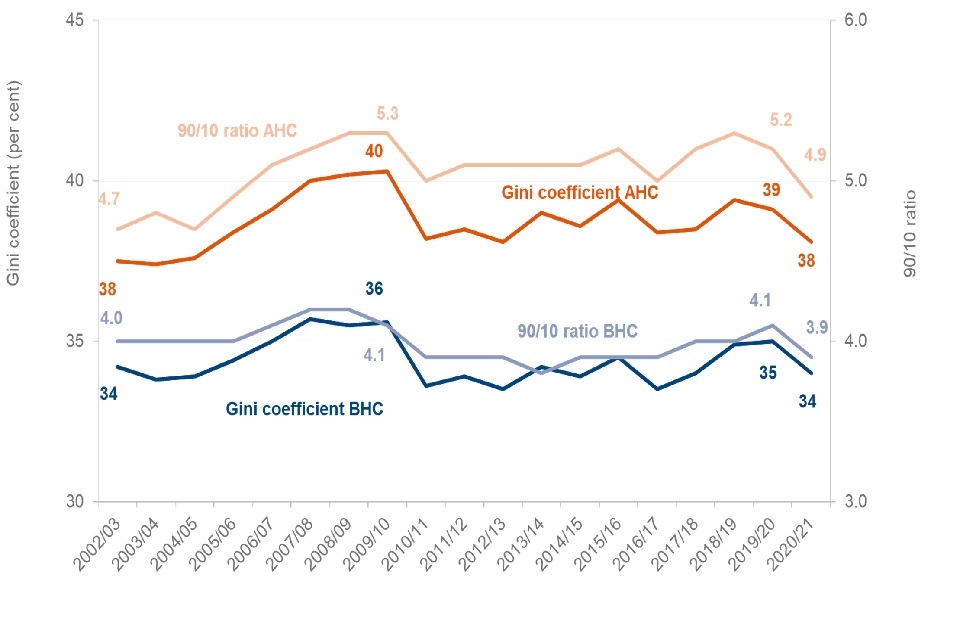
Income Inequality – Gini decrease BHC and AHC
Figure 2: Income Inequality, FYE 2003 to FYE 2021
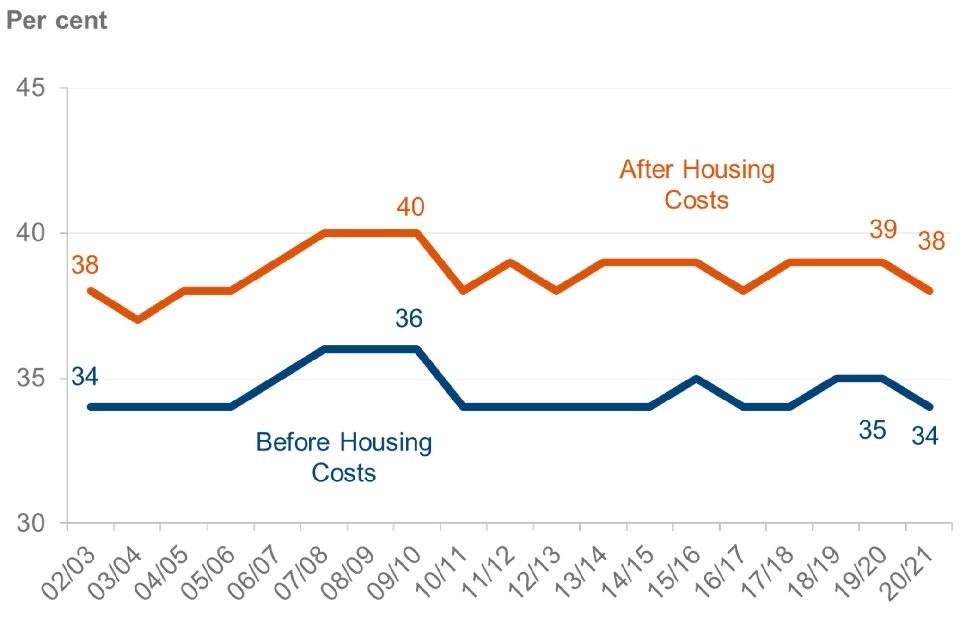
The Gini coefficient, ranging from 0% (low) to 100% (high), measures income inequality. In FYE 2021, the Gini coefficient decreased slightly for both BHC and AHC income, both down by 1 percentage point to 34% (BHC) and to 38% (AHC) respectively.
Low Income Measures – All measures decreased in FYE 2021
Figure 3: Low Income Measures, FYE 2003 to FYE 2021
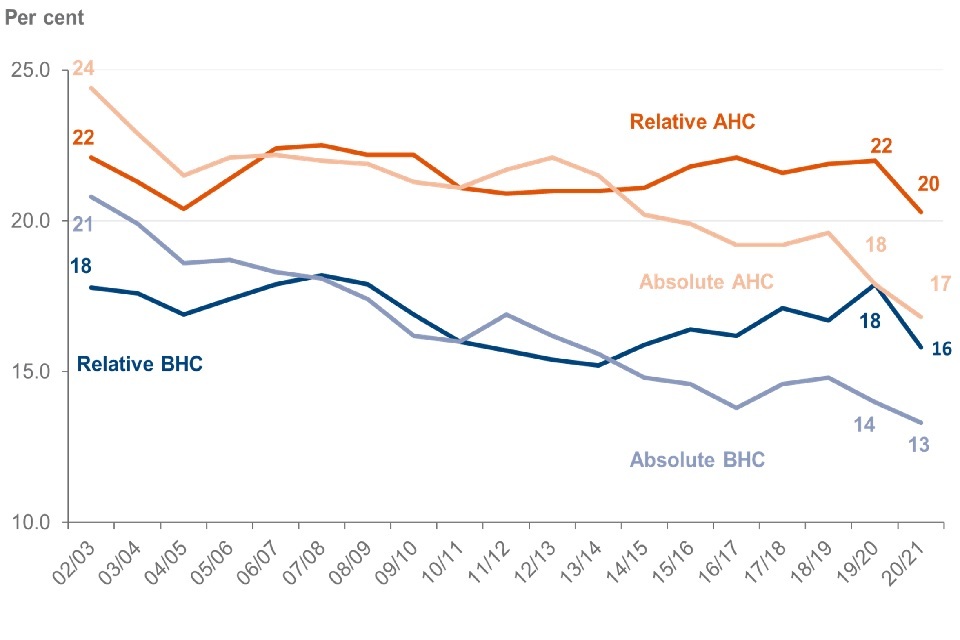
The percentage of individuals in relative low income has fallen for both BHC and AHC, with both measures falling by 2 percentage points this year (BHC decreased from 18% to 16% and AHC decreased from 22% to 20%).
Absolute low income BHC and AHC has also fallen over the same period, but to a lesser extent, with both measures showing decreases of 1 percentage point (BHC decreased from 14% to 13% and AHC decreased from 18% to 17%).
It should be noted that none of the changes in these measures were statistically significant but carry additional uncertainty due to the changes in survey data collection arising from the coronavirus (COVID-19) pandemic. In Chapter 6 of this publication, we display confidence intervals around each of the above estimates and present the 95% confidence interval in which we would expect the true value to fall.
2. What you need to know
The Households Below Average Income (HBAI) series is the UK’s official source of poverty estimates and is also the main and recommended source on household and individual incomes. Users include central Government, the devolved governments, local authorities, academics, think tanks, journalists and the voluntary sector. It meets DWP’s statutory obligation to publish a measure of relative and absolute low income, and combined low income and material deprivation for children under section 4 of the Welfare Reform and Work Act 2016.
Income measures
HBAI estimates incorporate widely used international standard measures of low income and inequality. The primary measure used in HBAI is equivalised disposable household income adjusted for household composition (called equivalisation), estimated on both a before and after housing costs basis (BHC and AHC). Our main income measure includes contributions from earnings, state support, pensions, and investment income among others, and is net of tax.
HBAI uses this net equivalised disposable household income as a proxy for living standards.
A household is said to be in relative low income if their net equivalised disposable household income is below a threshold set at 60% of median income, while they are in absolute low income if their net equivalised disposable household income is below 60% of the FYE 2011 median income adjusted for inflation. We also publish measures using thresholds at 50% and 70% of the median.
In line with international best practice, the income measures used in HBAI are subject to several statistical adjustments and, as such, are not always directly relatable to income amounts as they might be understood by people on a day-to-day basis. These adjustments, however, allow us to compare measures over time and across households of different sizes and compositions on a consistent basis.
HBAI uses variants of CPI inflation when estimating how incomes are changing in real terms over time. For further information, see the HBAI Quality and Methodology Information Report on the HBAI homepage.
Survey data
Estimates are based on the Family Resources Survey (FRS), which in FYE 2020 conducted face-to-face interviews with over 19,000 UK households. However, due to the national lockdown and restrictions caused by the coronavirus (COVID-19) pandemic from late-March 2020, interviewing in FYE 2021 was conducted solely by telephone. This resulted in a smaller achieved sample size of just over 10,000 households in FYE 2021. In addition, respondents were more likely to be older, owner-occupiers and better educated compared with previous years. Whilst the FRS and HBAI grossing regimes bring the age, tenure and education profile in line with the UK population, there remains some residual bias which cannot be corrected by the grossing regime. For further information please see the technical report detailing the impact of the coronavirus (COVID-19) pandemic on the HBAI statistics.
Use of survey data means results in this report are subject to uncertainty which can affect how changes should be interpreted, especially in the short term. Statistical significance is a technical concept that says whether a reported change is likely to have arisen only by chance due to variations in the sampling. We calculate 95% confidence intervals around estimates in HBAI which sets a standard that, where any change is reported as statistically significant, there is less than a 1 in 20 chance that the reported difference is due to sampling variation and there is actually no real underlying change. Changes are not statistically significant unless highlighted by an asterisk (*). Due to the reduced sample size in FYE 2021, confidence intervals around estimates for FYE 2021 are at least 70% wider than in previous years. In general, latest estimates should be considered alongside long-term patterns.
The reported change between two years in the supporting tables and charts may not equal the difference between the rounded numbers for those years. This is because we round at the final point in any calculation.
Additional tables and data
Due to the need for additional care when presenting and interpreting data collected during the coronavirus (COVID-19) pandemic, we have taken the decision not to publish additional FYE 2021 breakdowns either in our suite of tables or via our Stat Xplore tool. We have issued a more limited range of data tables to support the publication, and the source data behind these statistics will still be made available for download and further analysis via the UK Data Service (UKDS).
Any analysis of the changes in the estimates below UK level and across a range of family types, economic groups, disabilities and ethnicities should be undertaken with additional caution as the combination of smaller sample sizes and additional bias means it may not be possible to make meaningful statistical assessments of trends and changes for these groups.
For years up to and including FYE 2020, a much wider range of ODS supporting tables are available via the HBAI homepage, breaking down results presented in this report by different demographic characteristics. Results are available for most series back to FYE 1995 - see Directory of Tables link on this webpage for a full list of available tables.
UK-level HBAI data is available between FYE 1995 and FYE 2020 on the Stat-Xplore online tool. You can use Stat-Xplore to create your own HBAI analysis for this period.
New for this publication
New combined low income and child material deprivation statistics
This year we have extended our combined low income and material deprivation measures for children. Up to and including FYE 2020, we published two measures combining child material deprivation with relative low income defined as being below i) 50% and ii) 70% of the annual median income, before housing costs (BHC). In this release, we have included an additional measure combining child material deprivation with relative low income defined as being below 60% of the annual median income BHC, as recommended by the Office for Statistics Regulation (OSR). We have additionally published the same suite of three measures on an absolute income, BHC basis. See Tables 1.4c and 1.4d for full data.
In Chapter 7, we have provided a new chart and commentary on combined absolute low income and child material deprivation measure (using the below 70% of annual median income threshold), to align with our reporting of the equivalent relative measure.
This year DWP has also published an experimental series of combined working age absolute low income and material deprivation estimates covering FYE 2011 to FYE 2021. The release is accompanied by a technical paper which describes the ongoing work to develop these experimental statistics, including the current material deprivation review.
Changes due to the coronavirus (COVID-19) pandemic
In FYE 2021, several factors impacted on FRS response rates and the distribution of characteristics among FRS survey respondents, including:
-
change in the mode of interviewing from face to face to telephone
-
changes in the methods used to elicit responses from survey participants as the year progressed
-
changes in people’s behaviours and circumstances during the coronavirus (COVID-19) pandemic which may have made them more or less likely to respond to a household survey
While it is not possible to quantify the impact each of these factors had on the HBAI statistics, summary conclusions based on our extensive quality assurance are discussed in the technical report detailing of the impact of the coronavirus (COVID-19) pandemic on the HBAI statistics.
To address additional biases in the raw sample, new grossing controls were introduced to a) weight the sample by month of interview to balance the sample size across the year, and b) weight by level of educational attainment to boost numbers of working-age adults with education levels below degree level. This removed some, but not all, of the observed bias.
Two major new sources of income were introduced in FYE 2021 to support jobs and businesses affected by the coronavirus (COVID-19) pandemic – the Coronavirus Job Retention Scheme (CJRS) for employees, and Self Employment Income Support Scheme (SEISS) grants. While questions on both sources of income were included as part of the FRS questionnaire, there were particular challenges with calculating current-year income from self-employment. Both income sources are taken into account in the FYE 2021 estimates, although for SEISS this is a consequence of estimating income using previous years profit data, rather than directly using reported amounts of SEISS grants received.
More information on changes to our grossing methodology and how new income sources introduced in FYE 2021 are treated in the estimates can be found in the technical report detailing the impact of the coronavirus (COVID-19) pandemic on the HBAI statistics.
Changes made to this report to address OSR recommendations
The Office for Statistics Regulation (OSR) published its review of income-based poverty statistics on 19 May 2021. This included background information on why the review was commissioned as well as the findings and recommendations for statistics producers. Recommendations focussed on key areas including accessibility and guidance, understanding poverty, data gaps, data quality, and trustworthiness.
This statistical release contains changes to address the following recommendations:
- Recommendation 4: Producers should look to provide clearer and more detailed signposting to other income-based poverty statistics in their bulletins (recommendation 4)
Work was taken forward by the Government Statistical Service (GSS) Coherence Team at the Office for National Statistics (ONS), who carried out a review of signposting across income and earnings statistics and made several recommendations. As a result of this review, we have made some changes to the signposting in section 15 of this publication, including clearer information on the recommended use of official sources of household income statistics. The ONS have also developed a new interactive tool which can be used to identify sources of statistics on income and earnings, and their key features
- Recommendation 7: DWP and ONS should ensure they are clear about the strengths and limitations of household surveys, particularly with regards to missing groups, and clearly set out the implicit and explicit assumptions that underline them
An assessment of the strengths and limitations of the HBAI data is set out in section 13 of this release.
- Recommendation 11: Increase the consistency in the way [DWP] reports material deprivation, as it currently reports material deprivation of children in households with less than 50% and 70% of median income but not at 60%
This information is now provided in HBAI tables 1.4c and 1.4d alongside the equivalent absolute measures.
Please also refer to the DWP Statistical Work Programme for further information on DWP’s response to the OSR review.
3. The Overall Income Distribution
Distribution of UK household income is skewed with a long right-hand tail of higher incomes.
The shape of the overall income distribution evolves slowly over time, with relatively small year-on-year changes.
Figure 4: Income distribution (BHC) for the total population, FYE 2021
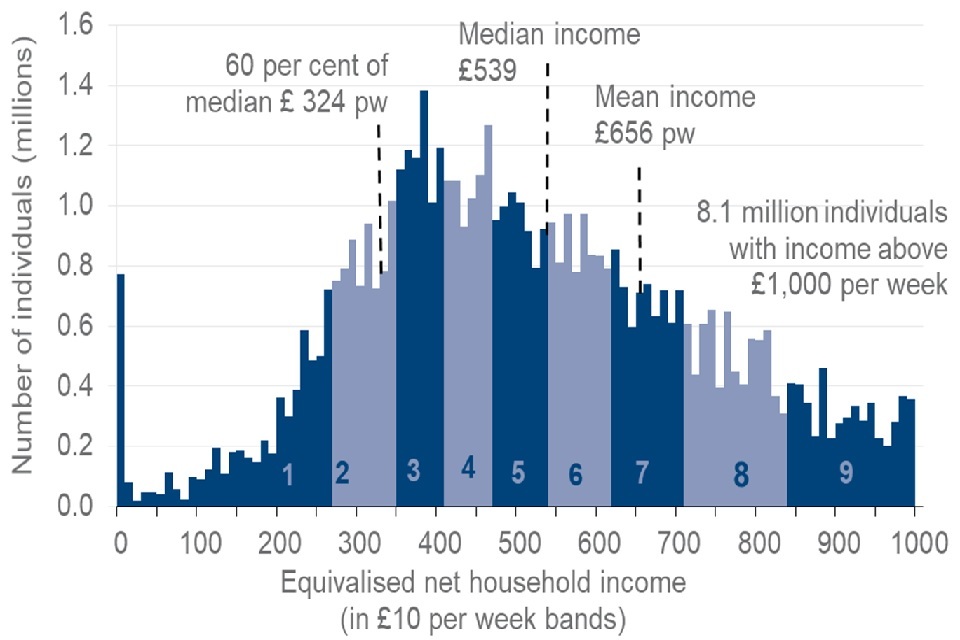
See Table 1.2c (BHC) for full data. AHC data is available in Table 1.2c (AHC)
Interpretation
The presence of large numbers of individuals with relatively high incomes results in a skewed or non-symmetric distribution. As a result, the median income is the standard measure of average income as changes in the mean can be driven by extreme values. The median represents the income of the individual in the middle of the distribution.
There are a large number of individuals with household incomes around the 60% of median income mark. Those falling below this line are considered to have relative low income. As a result of the decile clustering around this income level, relatively small movements in the overall distribution can sometimes lead to sizeable movements in this low income measure.
Deciles divide the population, when ranked by equivalised household income, into ten equal sized groups, and are indicated by 1 to 10 on the above chart, while quintiles divide the population into five groups. The shape of the overall income distribution evolves slowly over time.
Main Findings
Figure 4 shows that in FYE 2021, the average (median) real terms household income before housing costs was £539 per week (around £28,100 per year). This represents a reduction of 1.7%, or £9 per week, compared with FYE 2020. Average income after housing costs also reduced to £472 per week (around £24,600 per year). This represented a reduction of 1.4%, or £7 per week.
Figure 1 shows that after the introduction of the survey series in FYE 1995, there were generally steady increases in real terms income until FYE 2010. Following falls in FYE 2011 and FYE 2012 related to the recession, there were rises until FYE 2017. This year’s reduction in median income follows a statistically significant increase in the median in FYE 2020.
See Table 1.2b for full data.
The coronavirus (COVID-19) pandemic and the restrictions introduced in response to it had a significant impact on the labour market and household incomes during FYE 2021. Over the course of the year, there were falls in the employment rate and an increase in numbers receiving Universal Credit. Although across FYE 2021 there was slight growth in the official measure of weekly average earnings of 2.2%, HBAI measured a slight reduction in average earnings.
This economic context put downward pressure on average household incomes compared to FYE 2020. For some of those in the bottom half of the income distribution this was offset by policy changes designed to protect those on low incomes. Most notably, from April 2020, both new and existing Universal Credit claimants and existing Working Tax Credit claimants received a temporary additional £20 per week on top of annual uprating, known as the ‘UC Uplift’. In addition, growth in pensioner incomes was driven by State Pension uprating using the triple lock. In April 2020, State Pensions were uprated by 3.9%, which was greater than FYE 2021 growth in other forms of income including earnings, and greater than inflation.
See Table 1.2a for full data on economic indicators.
4. Income Inequality
Income inequality fell between FYE 2020 and FYE 2021, with the trend remaining broadly flat since FYE 2011.
Figure 5: Measures of inequality, FYE 2003 to FYE 2021
Interpretation
The Gini coefficient is an international standard technical measure of how incomes are distributed across all individuals. It ranges from 0% (when everyone has identical incomes) to 100% (when all income goes to only one person).
Percentiles divide the population, when ranked by household income, into 100 equal sized groups.
The 90:10 ratio is the income at the 90th percentile divided by the income at the 10th percentile. It is equivalent to the average (median) income of the top 20% (quintile 5) divided by the average income of the bottom 20% (quintile 1). The higher the number, the greater the gap between those with high incomes and those with the low incomes.
Main Findings
The BHC and AHC Gini coefficients both fell slightly between FYE 2020 and FYE 2021, by 1 percentage point each to 34% BHC and 38% AHC.
See Table 1.2b for full data.
Figure 6: Change in real terms income BHC by percentile, FYE 2020 to FYE 2021
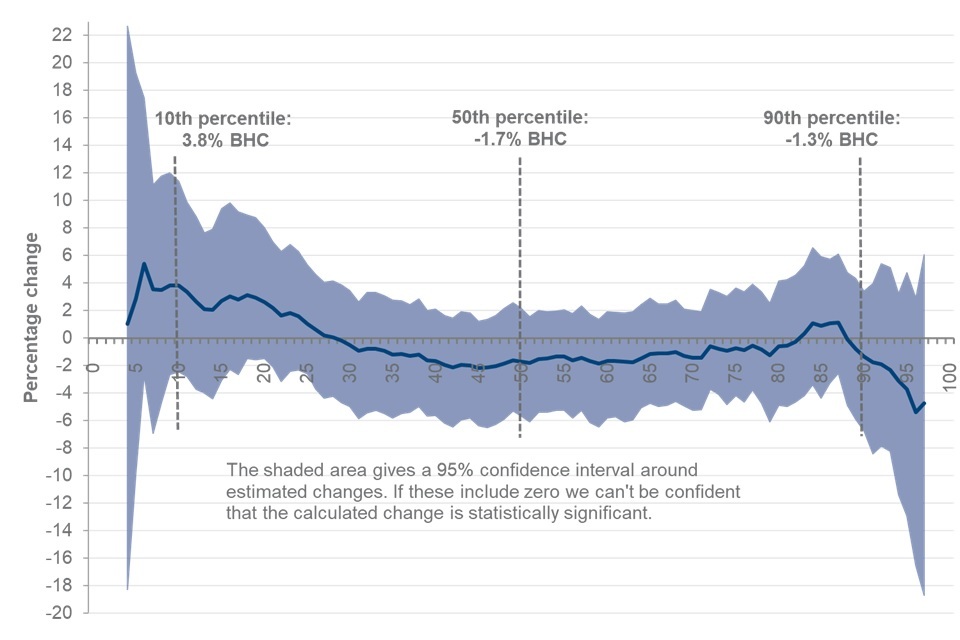
Interpretation
Looking at changes to incomes by percentile between FYE 2020 and FYE 2021 allows us to assess how each section of the income distribution has changed during the period of the coronavirus (COVID-19) pandemic.
Please note that at all levels of the distribution there is greater uncertainty around the estimates and none of the measured changes to real incomes are statistically significant.
Main Findings
This year saw a shrinking of the income distribution, with the incomes for those in the bottom 25% of the distribution recording positive real terms BHC income growth, those between the 30th and 80th percentiles recording a reduction in real terms BHC incomes, with a more mixed picture in the highest income quintile.
The largest rise in real terms BHC incomes was seen between the 5th and 20th percentiles, with increases of between 3 and 4%. Outside of these percentiles, most other income percentiles saw reductions in real terms BHC income of between 1 and 2%. Larger reductions in real terms BHC incomes were recorded for the top 10% of the income distribution, ranging between 2 and 5%.
Those below the 10th percentile saw an increase in income compared to FYE 2020, and those above the 90th percentile saw a decrease. These changes resulted in a fall in the 90:10 ratio, for real terms BHC, from 4.1 to 3.9 and AHC from 5.2 to 4.9.
See Chart 1.1 and Table 1.2b for the 90:10 ratio (Ratio of top to bottom quintile medians) for full data.
Figure 7: Weekly net equivalised disposable household income BHC by percentile FYE 2021
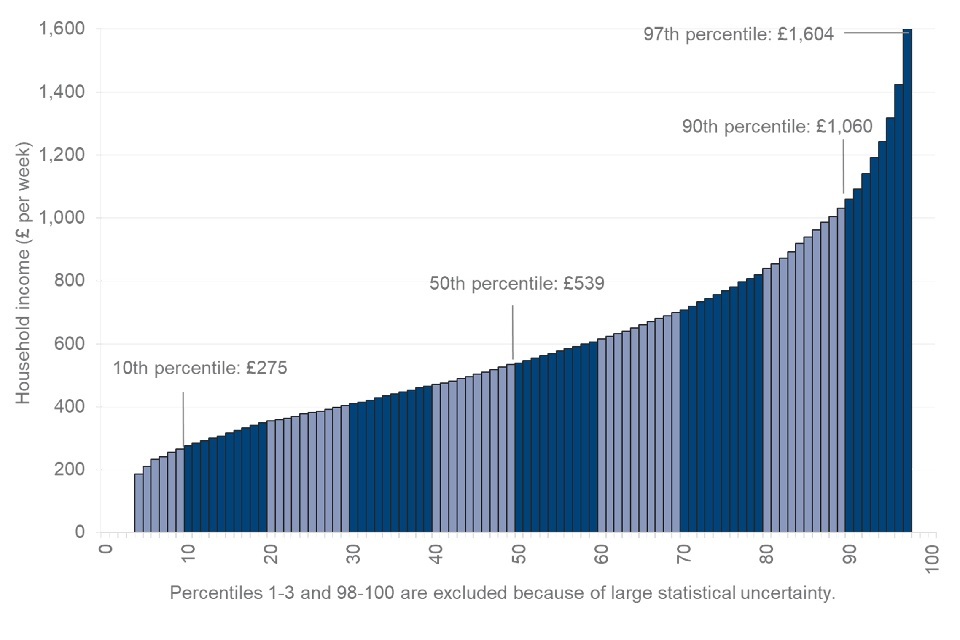
Interpretation
Percentiles divide the population, when ranked by household income, into 100 equal sized groups. The chart indicates the amount of weekly net equivalised disposable household income an individual requires to sit at each percentile of the UK income distribution.
Main Findings
Income BHC at the 10th percentile is around half of the median (50th percentile) implying that around 10% of the population have less than half of the median household income BHC.
Incomes increase sharply past the 90th percentile BHC. In FYE 2021, income at the 90th percentile is about double that of the median, whilst the top 3% of the population (97th percentile and above) have around three times that of the median.
See Chart 1.2 for full data.
Annual net equivalent disposable household income BHC by household type at different percentiles of the FYE 2021 UK distribution
| Percentile | Single individual | Couple with no children | Couple with two children under 14 |
|---|---|---|---|
| 10th | £9,600 | £14,300 | £20,100 |
| 50th | £18,800 | £28,100 | £39,400 |
| 90th | £37,000 | £55,300 | £77,400 |
| 97th | £56,000 | £83,600 | £117,100 |
Interpretation
To create income analysis by percentiles, the population is ordered according to their net equivalised disposable household income. The annual income required to be at a given point in the distribution is therefore different for different household types. See Chapter 12 for more information on equivalisation in HBAI.
Main Findings
Larger families require a higher level of household income to achieve similar ‘living standards’ (based on a household income measure) to smaller families.
To lie in the top half of the income distribution in FYE 2021, a single individual needed an annual household income over £18,800, compared to a couple with two young children who required a combined annual household income over £39,400.
A single individual with an annual household income of over £37,000 would sit above the 90th percentile in the distribution in FYE 2021, implying their income exceeded that of 90% of the UK population. A couple with two children receiving the same level of combined annual household income would lie just below the middle of the income distribution and be considered to have slightly less than average (median) household income.
5. Sources of incomes
The majority of household income in the UK comes from either earnings or state support. Two main new sources of income were introduced in FYE 2021 to support jobs and businesses affected by the coronavirus (COVID-19) pandemic – the Coronavirus Job Retention Scheme (CJRS) for employees, and Self Employment Income Support Scheme (SEISS) grants. Income from these sources is categorised as earnings in the charts below. Please see the technical report detailing the impact of the coronavirus (COVID-19) pandemic on the HBAI statistics for more information on how these income sources are treated in the HBAI estimates.
There was more variability in the estimates of income sources by percentile in this year’s estimates, reflecting the smaller achieved sample sizes for each group in FYE 2021. We have therefore chosen to present our analysis by income decile, rather than by percentile, in order to draw meaningful conclusions.
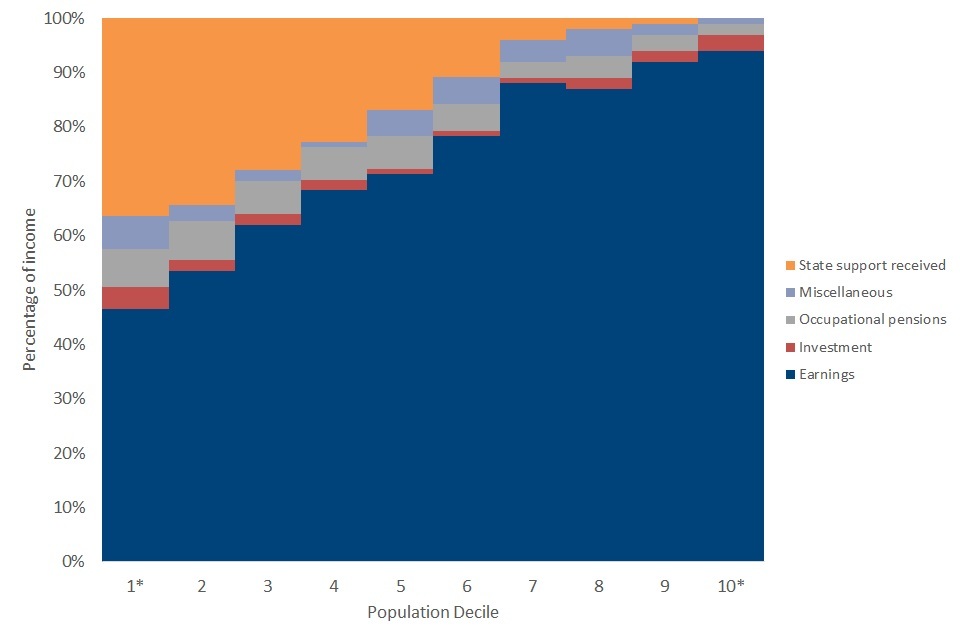
Figure 8: Income sources as a percentage of gross income by decile, FYE 2021
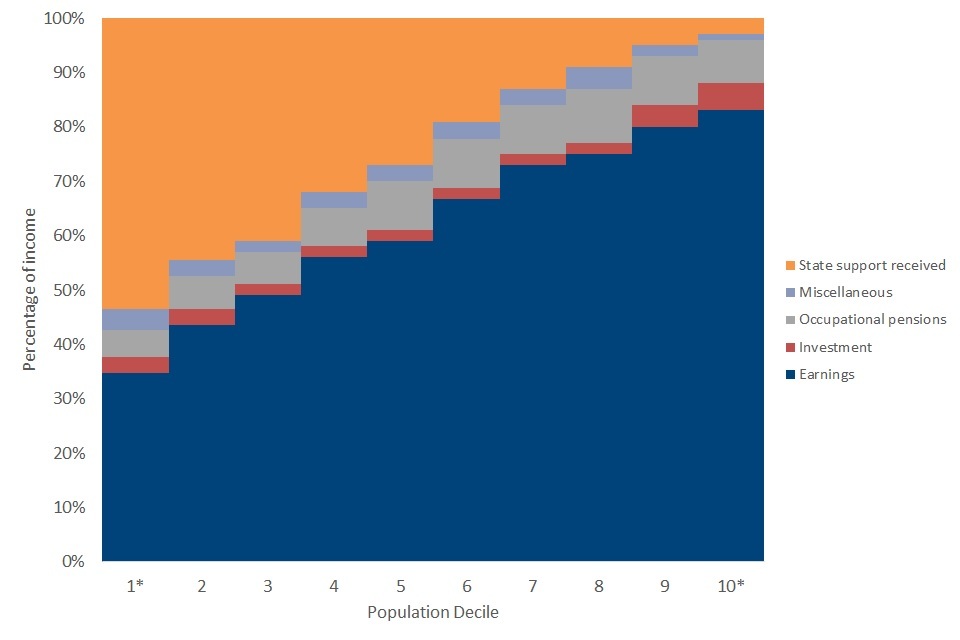
Percentiles 1-3 and 98-100 are excluded because of large statistical uncertainty. This means deciles 1 and 10 are not true deciles (covering percentiles 4-10 and 91-97 respectively). Percentages may not always sum to 100% due to rounding.
Interpretation
The charts show the different sources of gross income by percentile, ranking the population by income and dividing into 10 equal-sized groups (deciles). Income components are all considered before tax (gross). This is therefore a different definition of income from that used elsewhere in the HBAI report.
Main Findings
Higher income households receive a larger proportion of their income from earnings, a trend which builds moving up the income distribution. Lower income households receive more of their income from state support. In FYE 2021:
-
earnings account for around a third of gross income for individuals in the 1st decile compared to around 80% for individuals in the 10th decile
-
around 70% of the UK population (those in the third income decile and above) received a higher proportion of their household income from earnings than from state support
-
those with household incomes around the median (between the 4th and 6th deciles) saw the largest decline in the proportion of their household income from earnings, and an increase in the proportion received through state support, compared to FYE 2020
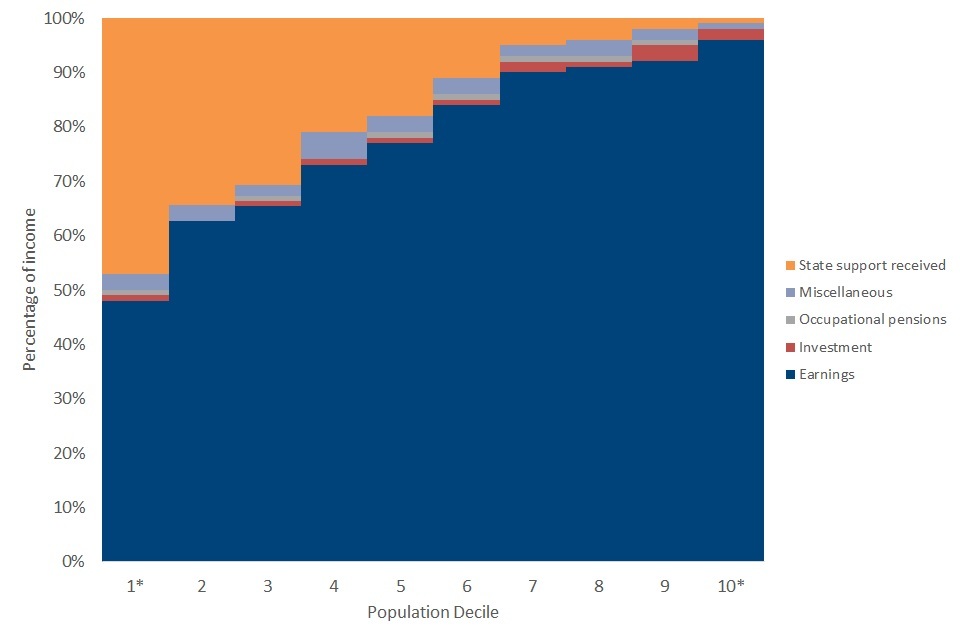
Figure 9: Sources of income for households containing working-age adults, FYE 2021
- across all deciles, earnings is the main source of gross income for households containing only working-age adults. For example, in the lowest decile, around 45% of income is from earnings, compared to 35% from state support. For the highest decile, almost all income is from earnings
Figure 10: Sources of income for households containing children, FYE 2021
- households containing children have similar income sources as households containing working-age adults only, but receipt of state support generally makes up a larger proportion of income due to greater eligibility for state benefits for this group (including child benefit and tax credits)
Figure 11: Sources of income for households containing pensioners and no children, FYE 2021
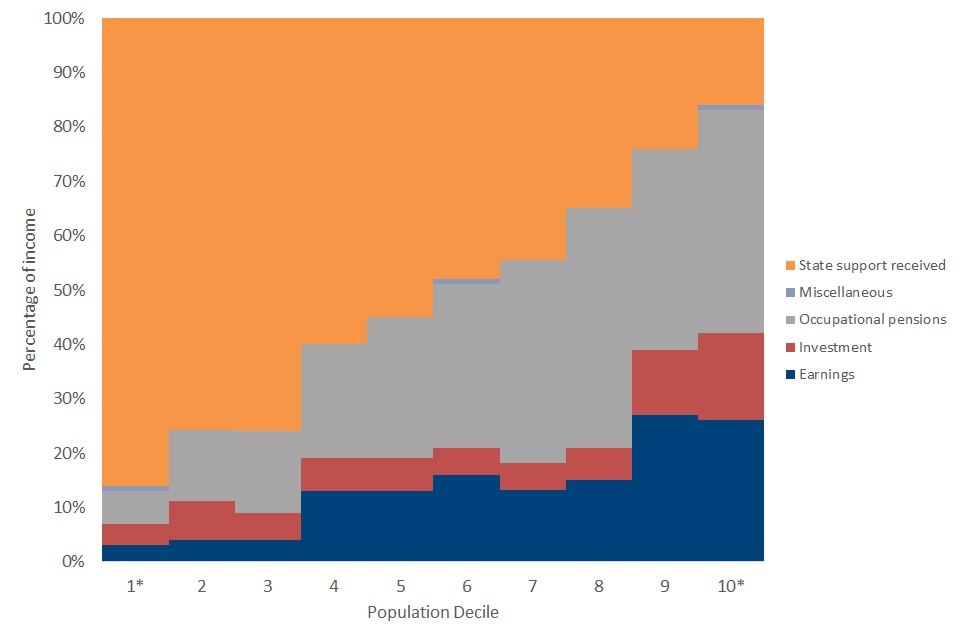
- in the middle of the income distribution (deciles 4 to 8), households containing pensioners and no children receive around 75% of their income from state support (particularly the state pension) and occupational pensions combined. They account for a slightly higher proportion in the bottom 3 deciles. Earnings and investments make up around a third of the income of those in the top income deciles
See Charts 1.3, 1.4, 1.5 and 1.6 for full data.
6. Low Income Indicators
The percentage of the overall population in low income reduced in the latest year, across all four measures – based on both relative and absolute income, and before and after housing costs. None of these changes were statistically significant.
Relative low income
Figure 12: Percentage of individuals in relative low income BHC, FYE 2003 to FYE 2021
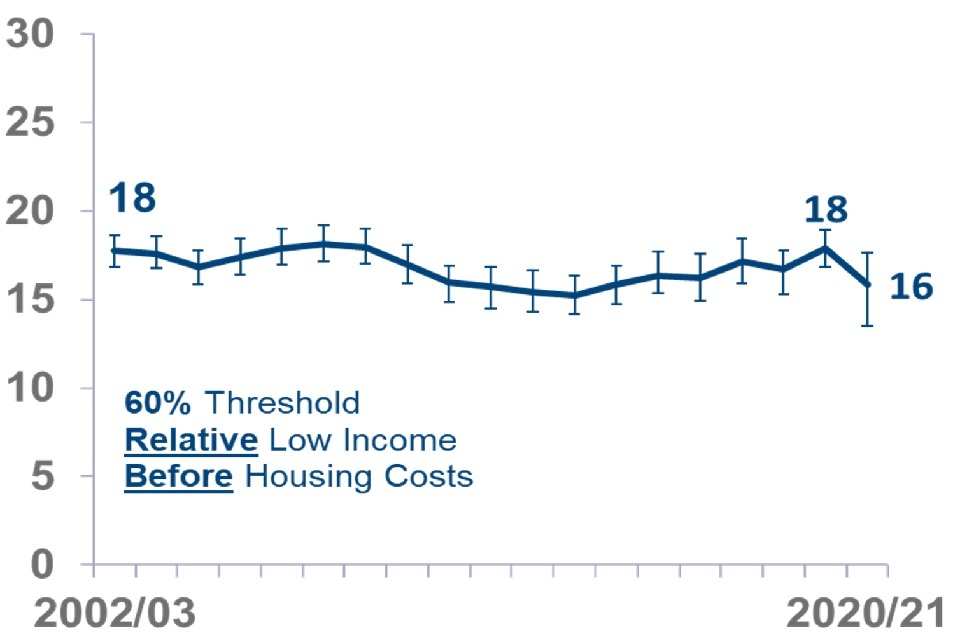
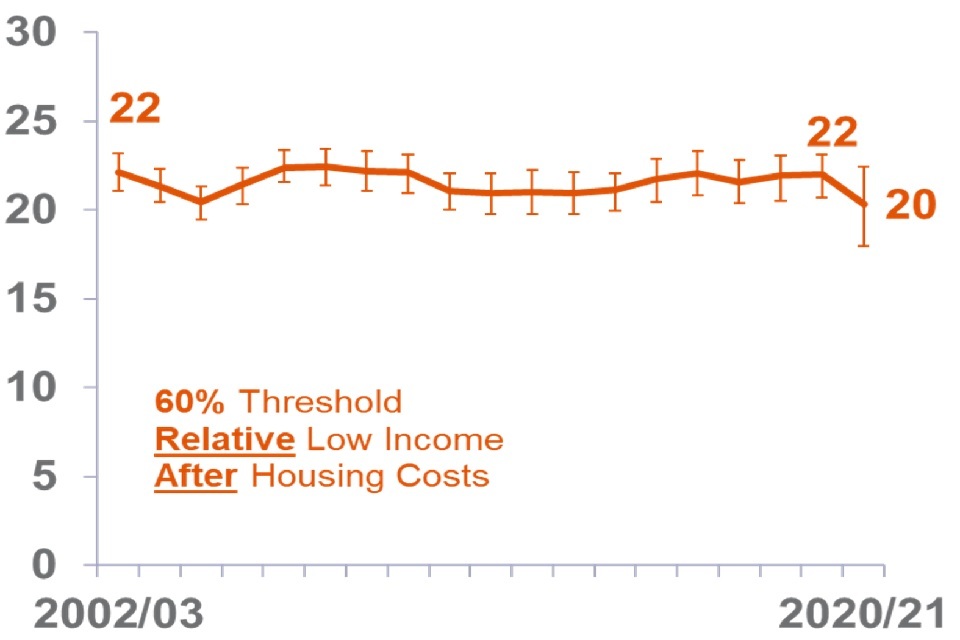
Figure 13: Percentage of individuals in relative low income AHC, FYE 2003 to FYE 2021
Interpretation
The relative low income threshold is set as a proportion of the UK average (median) net equivalised household income and moves each year as average income changes. It is used to measure the number and proportion of individuals who have income below this threshold. Estimates are available for below 50%, 60% and 70% of the median.
The percentage of individuals in relative low income depends on changes in median incomes, and how changes in the income of those below the low income threshold compare to changes in the median.
Main Findings
This year, the percentage of the population in low income has decreased because average (median) incomes have fallen, but individuals with lower incomes have seen their incomes rise, as seen in Figure 6.
Our central estimates for both relative measures, BHC and AHC, have fallen by 2 percentage points between FYE 2020 and FYE 2021. The percentage of individuals in relative low income BHC fell to 16% between FYE 2020 and FYE 2021, and relative low income AHC fell to 20%.
These larger changes are not statistically significant, as the estimates carry greater uncertainty due to the impact of the coronavirus (COVID-19) pandemic on the FRS fieldwork. We have chosen to display 95% confidence intervals around our central estimates this year. These indicate that for the BHC measure, the true percentage sits between 13% and 18%, and for AHC the range is between 18% and 22%. The degree of change in these measures are usually relatively modest, year to year. We would recommend interpreting the FYE 2021 changes in the relative measures alongside these longer-term trends.
Absolute low income
Figure 14: Percentage of individuals in absolute low income BHC, FYE 2003 to FYE 2021
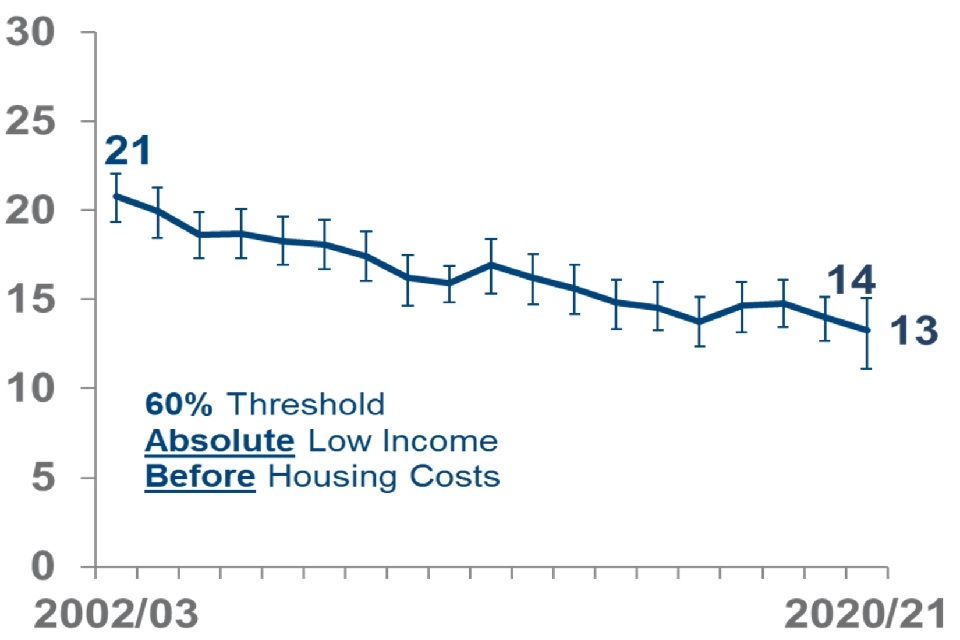
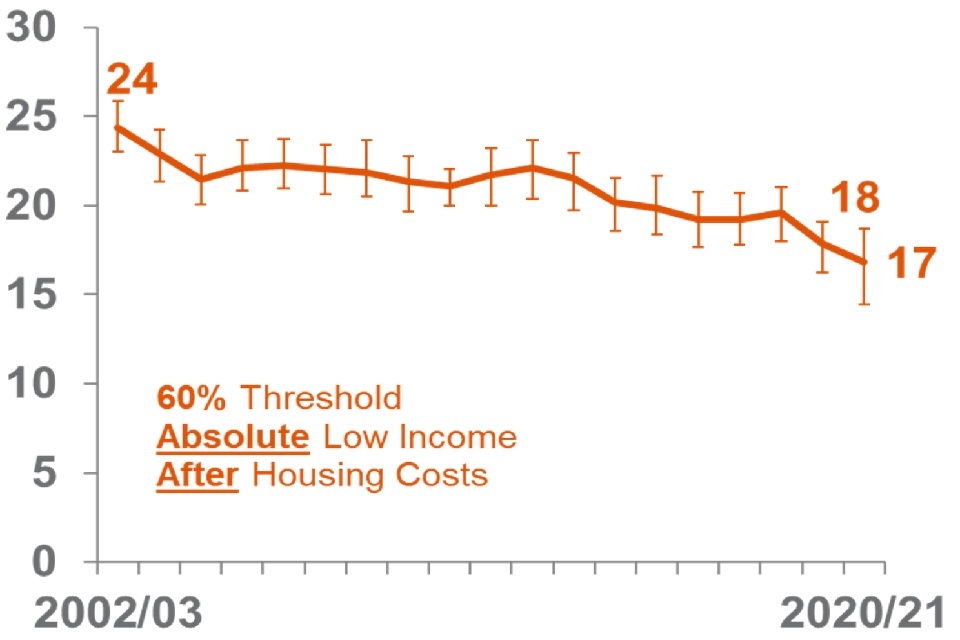
Figure 15: Percentage of individuals in absolute low income AHC, FYE 2003 to FYE 2021
Interpretation
Absolute low income takes the 60% of median income threshold from FYE 2011 and then fixes this in real terms (i.e. the line moves with inflation). This is designed to assess how low incomes are moving forward in time with reference to inflation. It measures the number and proportion of individuals who have incomes below this threshold. We also publish measures using thresholds at 50% or 70% of the median.
The percentage of individuals in absolute low income will decrease if individuals with lower incomes see their incomes rise by more than inflation.
Main Findings
This year our central estimates for both absolute measures, BHC and AHC, have fallen by 1 percentage point between FYE 2020 and FYE 2021. Absolute low income BHC fell to 13% in FYE 2021 while absolute low income AHC decreased to 17%. In both cases, this represents a continuation of the downward trend in the proportion of individuals in absolute low income.
Neither change is statistically significant. We estimate that for the BHC measure, the true percentage sits between 11% and 15%, and for AHC the range is between 14% and 19%.
See Tables 1.3a and 1.3a (CI) for full data
Household Food Security
For the second year, this publication includes statistics on household food security for individuals living in low income households. More information on food security can be found in the FRS publication.
Interpretation
To measure household food security, questions are asked of the person in the household who knows the most about buying and preparing food. In common with the rest of the FRS, the focus is on the period of 30 days leading up to interview. The questions are comparable to those used by other public bodies in the UK, and also internationally. From the questions, a ten-point household score is generated, and the household is given a food security status:
-
High food security (score=0): The household has no problem, or anxiety about, consistently accessing adequate food
-
Marginal food security (score= 1 or 2): The household had problems at times, or anxiety about, accessing adequate food, but the quality, variety, and quantity of their food intake were not substantially reduced
-
Low food security (score = 3 to 5): The household reduced the quality, variety, and desirability of their diets, but the quantity of food intake and normal eating patterns were not substantially disrupted
-
Very low food security (score = 6 to 10): At times during the last 30 days, eating patterns of one or more household members were disrupted and food intake reduced because the household lacked money and other resources for food
Households with high or marginal food security are “food secure”. Food secure households are considered to have sufficient, varied food to facilitate an active and healthy lifestyle. Households with low or very low food security are “food insecure”. Food insecure households have a risk of, or lack of access to, sufficient, varied food. More details are available in the FRS background information and methodology note.
Main Findings
In FYE 2021, 85% of individuals in relative and absolute low income BHC (with a household income below 70% of the median) lived in a food secure household. For both measures, this was an increase of 3 percentage points compared to FYE 2020.
There were also increases in the proportions who lived in a household with high food security, improving to 77% (from 73%) and 76% (from 71%) for relative and absolute BHC measures respectively.
See tables 1.3c to 1.3f for full data.
7. Children in Low Income Households
Three of the four low income measures for children included in section 4 of the Welfare Reform and Work Act 2016 form part of the HBAI publication. These are: a 60% threshold relative low income measure, a 60% threshold absolute low income measure, and a combined 70% threshold low income and material deprivation measure. As with individuals, we report four measures of the proportion of children in low income – based on relative and absolute income, and before and after housing costs (BHC and AHC).
In FYE 2021, reductions were recorded in each of the four measures of the percentage of children in low income households. None of these changes were statistically significant.
Compared to the overall population, children remain more likely to be in low income households.
Relative Low Income
Figure 16: Percentage of children in relative low income (BHC), FYE 2003 to FYE 2021
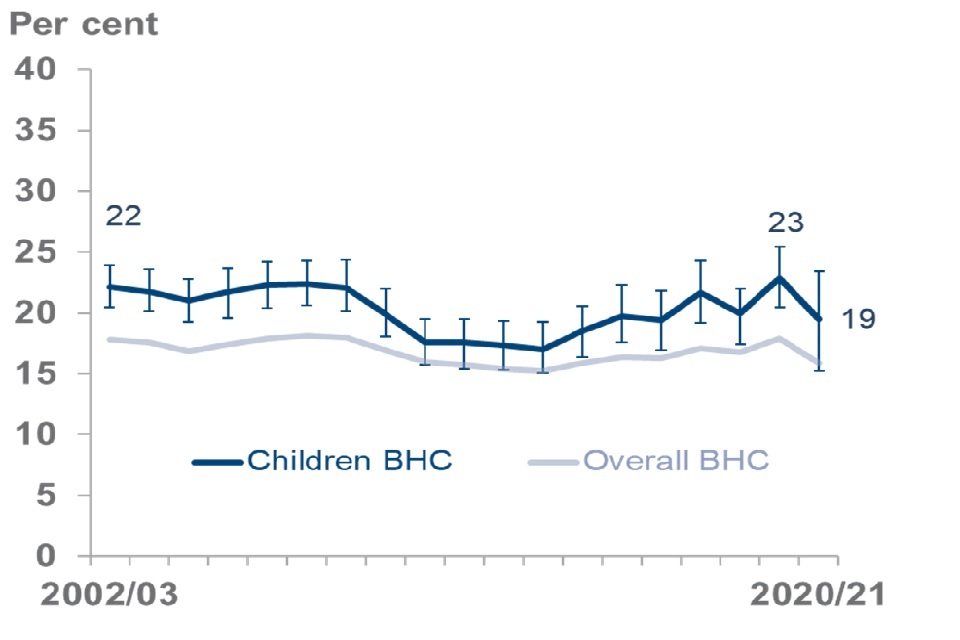
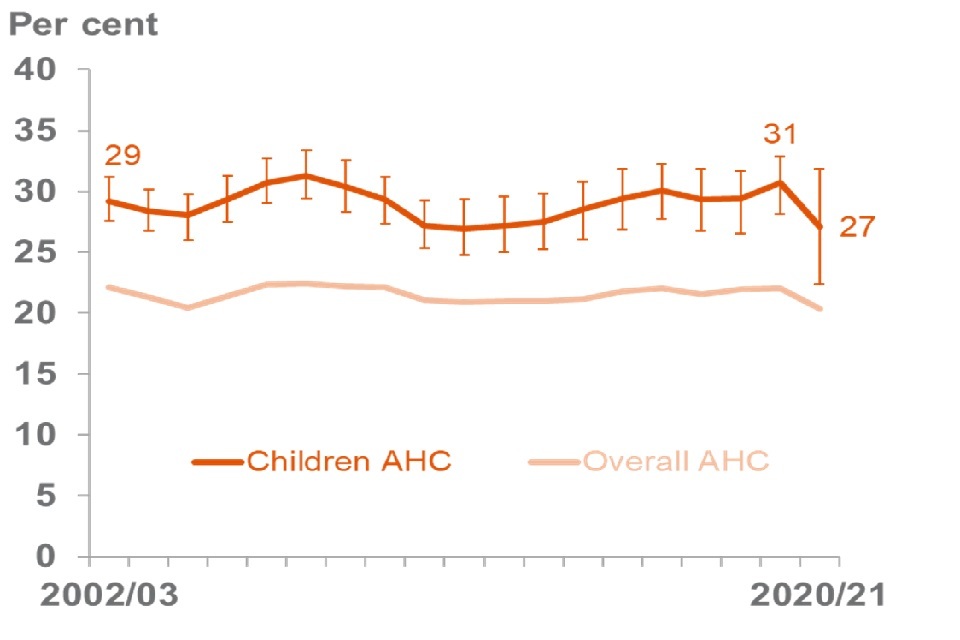
Figure 17: Percentage of children in relative low income (AHC), FYE 2003 to FYE 2021
Main Findings
Between FYE 2020 and FYE 2021, relative low income BHC for children decreased by 3 percentage points to 19%. Note that this change does not match the reduction shown in the chart due to rounding.
The relative AHC measure also fell in FYE 2021 by 4 percentage points to 27%, following increases since FYE 2014.
Neither of the changes in the measures were statistically significant. The 95% confidence interval in which we would expect the true values to fall are between 15% and 23% for BHC and between 22% and 32% for AHC.
Absolute Low Income
Figure 18: Percentage of children in absolute low income (BHC), FYE 2003 to FYE 2021
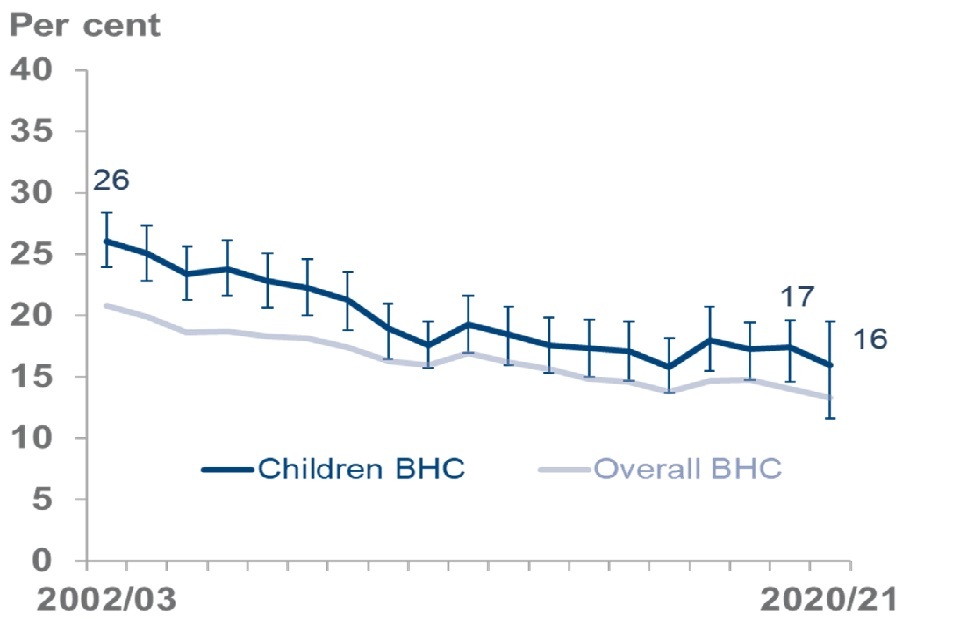
Figure 19: Percentage of children in absolute low income (AHC), FYE 2003 to FYE 2021
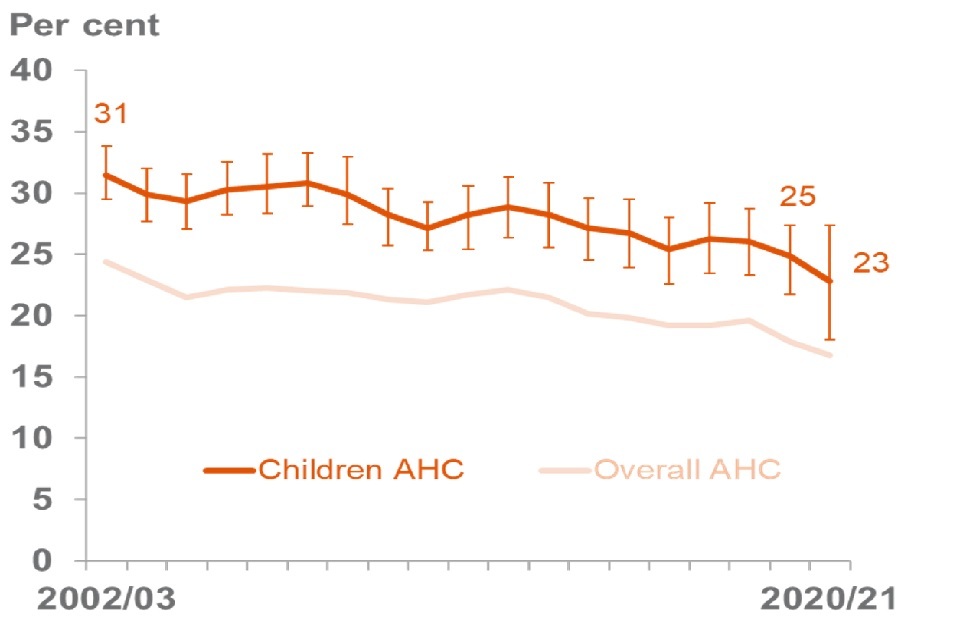
Absolute low income BHC for children reduced from 17% to 16% between FYE 2020 and FYE 2021, while absolute low income AHC continued to fall from 25% to 23%.
Neither of the changes in the measures were statistically significant. The confidence intervals around the central estimates show that there is more uncertainty around the estimates this year. The 95% confidence interval in which we would expect the true values to fall are between 12% and 20% for BHC and between 18% and 27% for AHC.
See Tables 1.4a for central estimates and Table 1.4a (CI) for the confidence intervals displayed in these charts.
Low Income and Child Material Deprivation
For FYE 2021, it should be noted that all estimates of material deprivation, including those combined with low income measures, are not comparable with previous years.
Several of the questions asked as part of the measure were affected by government restrictions introduced in response to the coronavirus (COVID-19) pandemic. This meant that it was not possible for those sampled to access some social opportunities or services during periods of lockdown, regardless of financial constraint. It cannot be concluded that the changes in recorded material deprivation during FYE 2021 represent a genuine, persistent shift in household circumstances.
Please see the technical report detailing the impact of the coronavirus (COVID-19) pandemic on the HBAI statistics for further information, table 1.4c and 1.4d for the data, and tables 1.4e and 1.4f (BHC and AHC) for details of affected items.
Figure 20: Percentage of children in relative low income and child material deprivation, FYE 2005 to FYE 2021
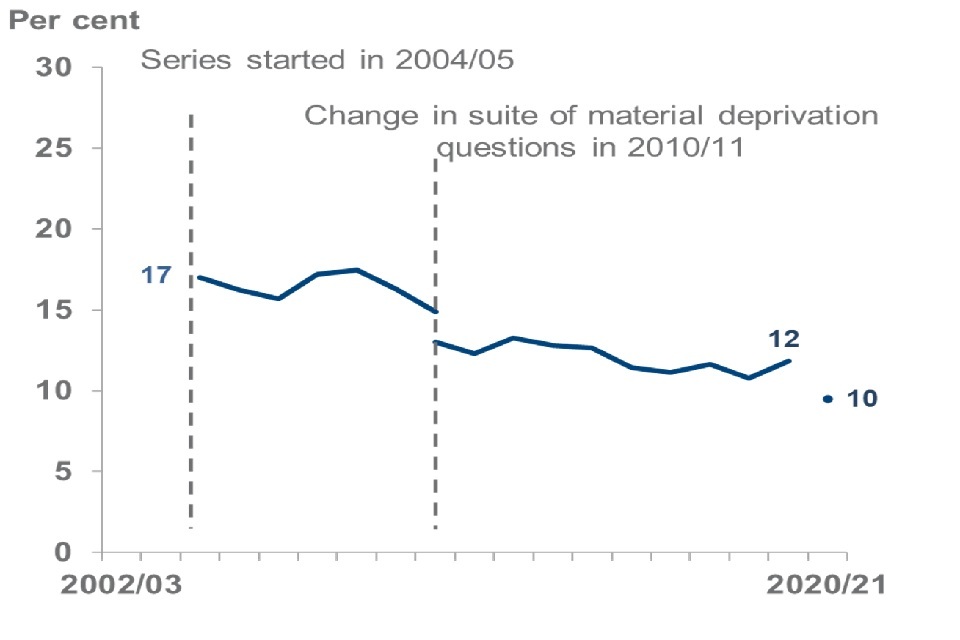
Figure 21: Percentage of children in absolute low income and child material deprivation, FYE 2005 to FYE 2021
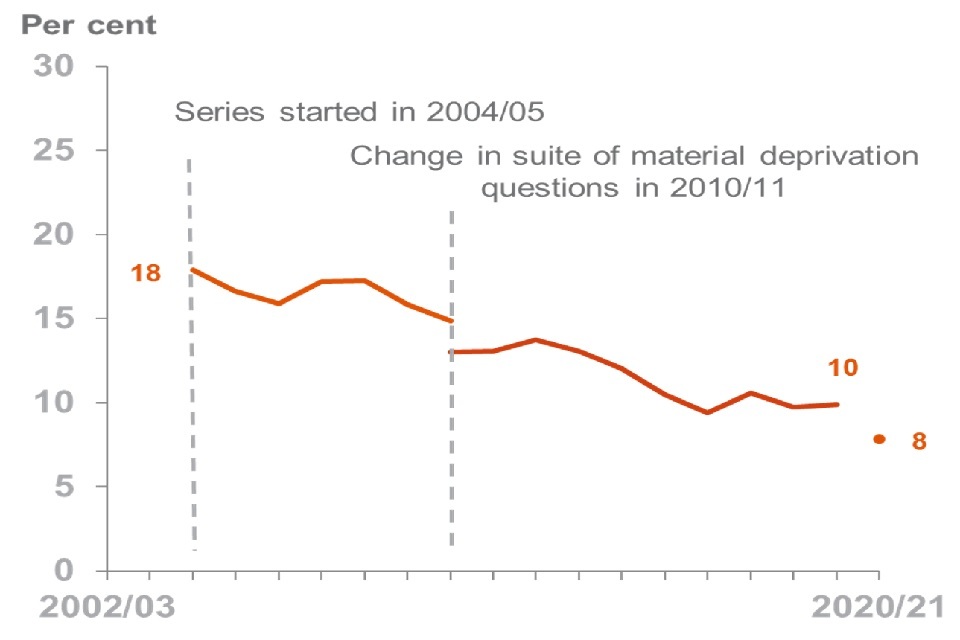
Interpretation
For this measure of low income and child material deprivation, respondents are asked whether they have access to a list of 21 goods and services. If they can’t afford a given item, this is scored in the material deprivation measure, with items more commonly owned in the population given a higher weighted score. A child is considered to be in low income and child material deprivation if they live in a family that has a total score of 25 or more out of 100 and a net equivalised disposable household income BHC below 70% of the median. More details are available in the HBAI Quality and Methodology Information Report.
Main Findings
In FYE 2021, the percentage of children in combined low income and child material deprivation was 10 per cent for relative BHC and 8 per cent for absolute BHC.
We have chosen to emphasise the non-comparability of the estimates for the current year by presenting a discontinuity in the time series chart above. We recommend that the recorded percentage is interpreted alongside the long-term trend in the measures.
Generally, any movements seen in the relative measure since FYE 2011 have been small. The absolute measure has also been broadly stable in recent years.
Household food security
In FYE 2021, 81% of children in relative low income BHC (with a household income below 70% of the median) lived in a food secure household, and 80% of children in absolute low income BHC. This was an increase of 6 and 5 percentage points respectively compared to FYE 2020.
There were also increases in the proportions who lived in a household with high food security, improving to 70% (from 63%) and 69% (from 62%) for relative and absolute BHC measures respectively.
Children in low income BHC are less likely to be living in a food secure household compared with working-age adults and pensioners in low income BHC.
See Tables 1.4g to 1.4j for full data.
8. Working-age Adults in Low Income Households and Low Income by Work Status
Working-age adults make up around 60% of the UK population. As such, changes in income for this group can drive overall results more than changes amongst children and pensioners (with each of these groups making up around 20% of the population). As shown section 5 above, this also group receive a greater proportion of their income from employment and so their results are more sensitive to changes in the labour market.
Both relative and absolute low income AHC slightly decreased in FYE 2021, as did relative low income BHC. Absolute low income BHC remained stable. None of these changes were statistically significant.
Figure 22: Percentage of working-age adults in relative low income, FYE 2003 to FYE 2021
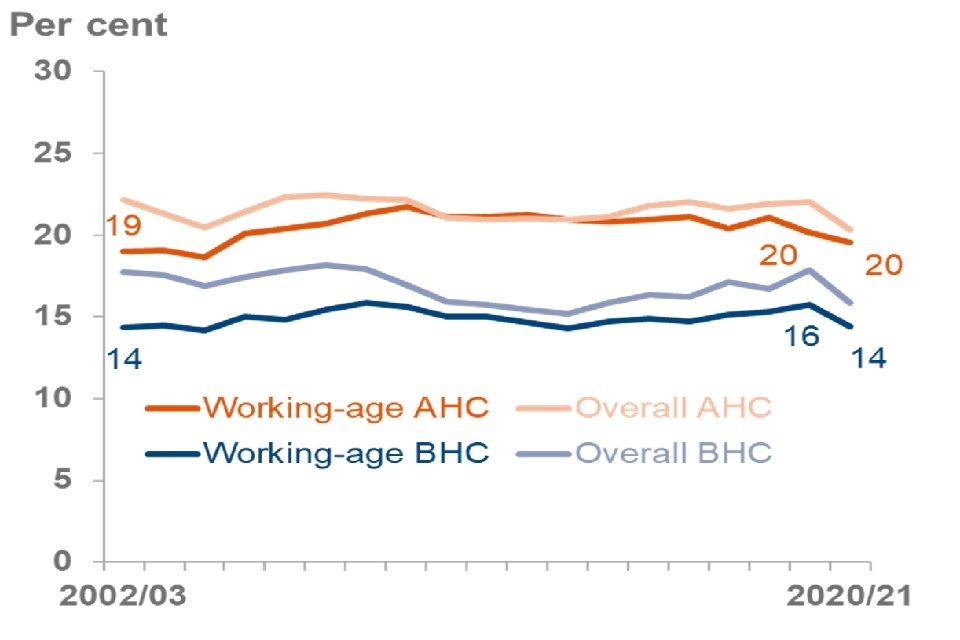
Figure 23: Percentage of working-age adults in absolute low income, FYE 2003 to FYE 2021
Main Findings
The percentage of working-age adults in relative low income BHC fell by 1 percentage point from 16% to 14% in FYE 2021. Relative low income AHC reduced by 1 percentage point to 20%. Please note that these changes do not match the differences between the levels displayed in the chart due to rounding.
The relative low income estimates for FYE 2021 are broadly consistent with the stable long-term trends.
Absolute low income BHC remained unchanged and is now 12% (though due to rounding, the chart above displays a fall from 13% to 12%) whilst absolute low income AHC decreased from 17% to 16%. This continues the broadly downward trend in both measures since FYE 2012.
None of the changes in the measures were statistically significant.
As the estimated change in the central estimates are smaller for this group, we are less sure of the direction of change in working-age adults low income measures in FYE 2021. Analysis of the confidence intervals support this, for example, the central estimate of relative low income AHC (20%) has a 95% confidence interval of between 17% and 22%, meaning the true change could have been an increase, decrease or remained stable at FYE 2020 levels.
See Table 1.5a for full data and the associated confidence intervals in table 1.5a (CI). We would recommend that they are considered by users when analysing this group, and that changes are considered alongside long-term trends.
Percentage and composition of working-age adults and children in low income by work status
This analysis has not been published for FYE 2021. This is a consequence of the decision not to publish additional breakdowns of the headline measures in this statistical release, in response to coronavirus (COVID-19) pandemic data quality issues. Further information is available in the technical report detailing the impact of the coronavirus (COVID-19) pandemic on the HBAI Statistics.
Users can access the FYE 2020 statistics via the HBAI homepage
Household food security
In FYE 2021, 83% of working age adults in low income BHC, either relative or absolute low income (household income below 70% of the median) lived in a food secure household. This is an increase of 3 and 4 percentage points for those in relative low income BHC and absolute low income BHC respectively. There were also increases in the proportions who lived in a household with high food security, with both measures improving to 74% from 69% and 68% respectively.
See Tables 1.5c to 1.5f for full data.
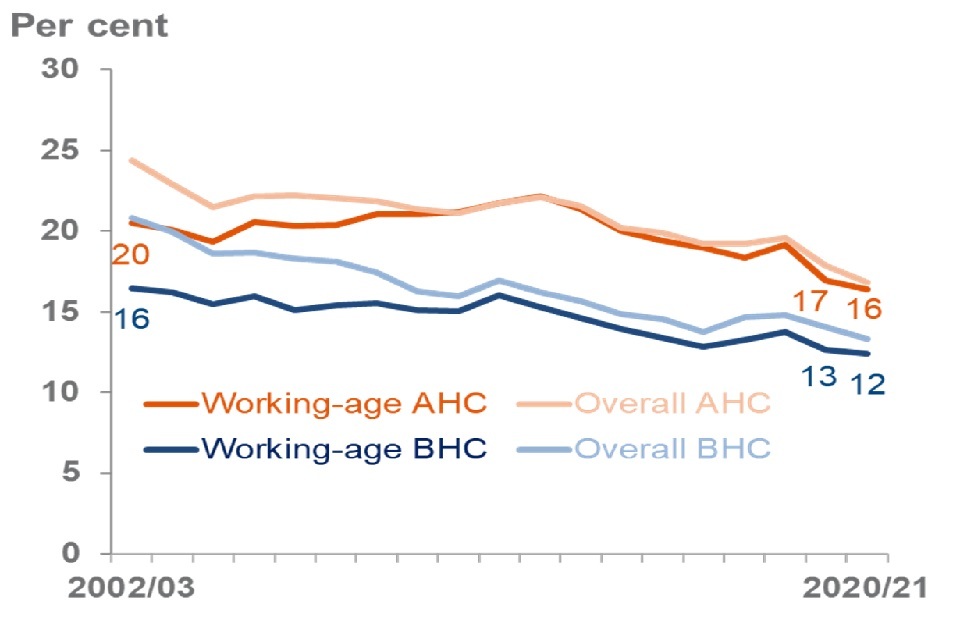
9. Pensioners in Low Income Households
Around three-quarters of pensioners live in homes that are owned outright (compared to roughly 1 in 5 of working-age adults), and so face minimal housing costs. This means the proportion of pensioners in low income households tend to be lower AHC than BHC, unlike for children and working-age adults. We also estimate a broader material deprivation measure for pensioners.
All four measures of the percentage of pensioners in low income fell in FYE 2021. None of the changes were statistically significant.
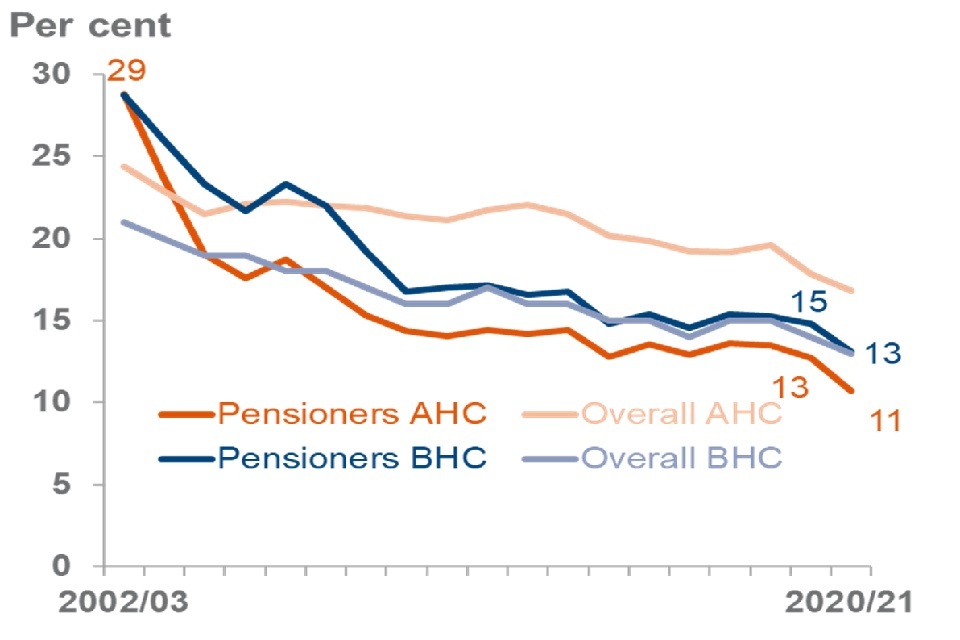
Figure 24: Percentage of pensioners in relative low income, FYE 2003 to FYE 2021
Figure 25: Percentage of pensioners in absolute low income, FYE 2003 to FYE 2021
Main Findings
The percentage of pensioners in relative low income reduced to 16% BHC and 15% AHC between FYE 2020 and FYE 2021. This represented a reduction of 3 percentage points for both measures.
It should be noted that these larger changes are not statistically significant, as the estimates carry greater uncertainty due to the impact of the coronavirus (COVID-19) pandemic on the FRS fieldwork. We have chosen to display 95% confidence intervals around our central estimates this year. These indicate that for the BHC measure, the true percentage sits between 13% and 20%, and for AHC the range is between 12% and 18%.
Between FYE 2011 and FYE 2020 there was a gradual upward trend in both relative measures. We recommend interpreting the FYE 2021 changes in the measures alongside these longer-term trends.
Absolute low income BHC and AHC also both fell by 2 percentage points, from 15% to 13% BHC and from 13% to 11% AHC. Over more recent years, both absolute measures have been broadly flat. Our 95% confidence intervals indicate that for the BHC measure, the true percentage sits between 11% and 16%, and for AHC the range is between 8% and 13%.
Compared to the overall UK population, pensioners have been less likely to be in relative or absolute low income AHC since around FYE 2005, and similar levels BHC since around FYE 2010.
See Table 1.6a for full data and the associated confidence intervals in table 1.6a (CI).
Material Deprivation
For FYE 2021, it should be noted that all estimates of material deprivation are not comparable with previous years.
Figure 26: Percentage of pensioners in material deprivation, FYE 2010 to FYE 2021
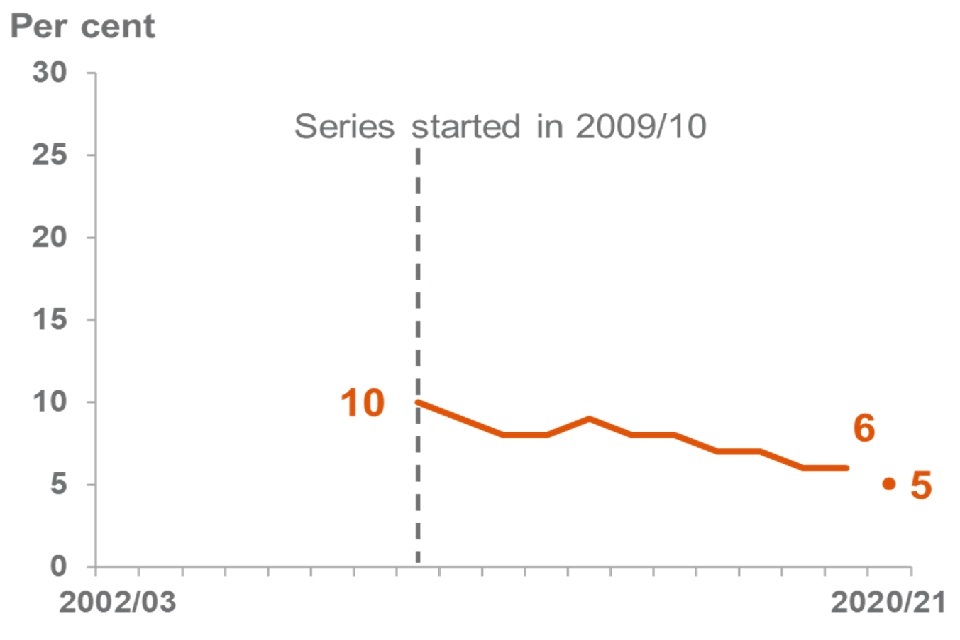
Interpretation
Pensioners aged 65 or over are asked whether they have access to a list of 15 goods and services. If they don’t have a given item (because of cost, health, or availability), this is scored in the material deprivation measure, with items more commonly owned in the population given a higher weighted score. A pensioner is considered to be in material deprivation if they live in a family that has a final score of 20 or more out of 100. More details are available in the HBAI Quality and Methodology Information Report.
As with the child material deprivation measures, access to several of the goods and services were affected by government restrictions introduced in response to the coronavirus (COVID-19) pandemic during FYE 2021. It cannot be concluded that the level of change recorded in material deprivation during FYE 2021 is representative of real change in pensioner household circumstances. Please see the technical report detailing the impact of the coronavirus (COVID-19) pandemic on the HBAI statistics.
See tables 1.6d (BHC and AHC) for information on affected questions.
Main Findings
In FYE 2021, the percentage of pensioners in material deprivation was 5%.
We have chosen to emphasise the non-comparability of the estimates for the current year by presenting a discontinuity in the time series chart above.
See table 1.6c for full data.
Household food security
In FYE 2021, 97% of pensioners in relative low income BHC (with a household income below 70% of the median) lived in a food secure household, and 98% of pensioners in absolute low income BHC. The proportion who live in a household with high food security is 94% for both measures. All estimated levels are stable compared with FYE 2020.
Pensioners in relative low income BHC are much more likely to live in a food secure household compared with working-age adults and children in low income BHC.
See Tables 1.6e to 1.6h for full data.
10. People in Low Income Households, by disability in the family
The above analysis for FYE 2021 is not available. This is a consequence of the decision not to publish additional breakdowns of the headline measures in this statistical release, in response to the coronavirus (COVID-19) pandemic data quality issues. Further information is available in the technical report detailing the impact of the coronavirus (COVID-19) pandemic on the HBAI Statistics.
Users can access the FYE 2020 statistics via the HBAI homepage.
11. Long-term Trends (data prior to FYE 1995 are not National Statistics)
Work undertaken by IFS to extend HBAI trends back to 1961 shows large increases in inequality over the 1980s
Figure 27: Gini Coefficient
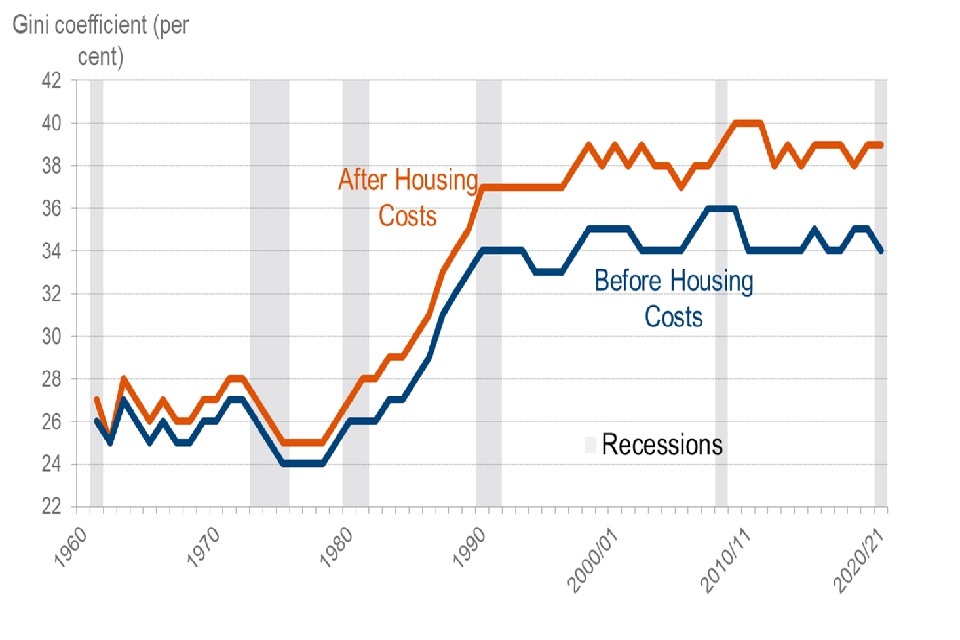
Figure 28: Relative Low Income
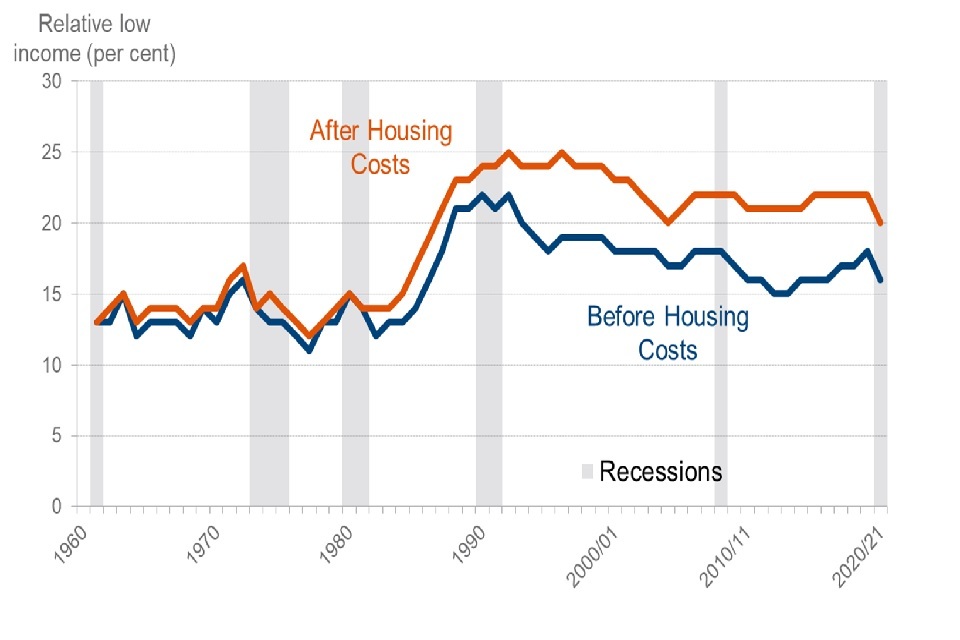
Figure 29: Relative Low Income
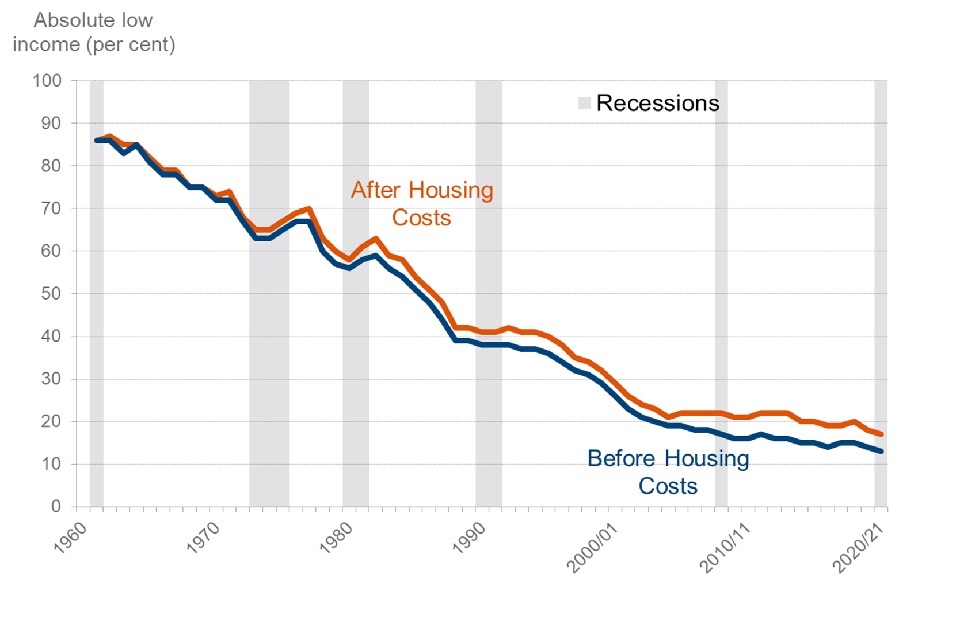
Main Findings
Looking at trends over the past 50 years, incomes across the population have increased dramatically in real terms over time, driving falls in absolute low income. This pattern has held fairly consistently over time, with rises in absolute low income relatively rare.
Over the 1980s, however, incomes for those further up the income distribution grew more quickly than for those at the bottom, driving large increases in income inequality (Gini) and in relative low income measures.
From the early 1990s, income inequality measures in the UK have remained relatively stable, although analysis by Atkinson, Piketty et al, held at the World Inequality Database suggests that increasing inequality has continued with incomes for those within the top 1% continuing to grow faster than for the rest of the distribution. Changes this far up the distribution will not be captured well in HBAI data.
Interpretation
The increase in income inequality (and in relative low income) over the past 40 years or so has been driven in part by a significant increase in individual earnings inequality over the same period.
Partial explanations for wider trends are:
-
from the late-1970s there was a large rise in unemployment following the recession, accompanied by increasing inequality in earnings – driven in part by factors like increases in part-time working
-
from the mid-1980s increasing income inequality was further driven by incomes of those in employment pulling away from those who are economically inactive (including pensioners) as growth in employment income rose faster than for other sources such as benefits
-
in the late-1980s the widening of the income distribution was driven further by increases in earnings inequality, with increasing differences between wages for different occupations
-
by the early 1990s the picture began to stabilise with incomes of those economically inactive starting to catch up to those in employment
-
in the early 2000s falls in low income measures were driven by increasing relative incomes for families with children and pensioners – driven in part by the introduction of tax credits and the Basic State Pension “triple lock”
See the IFS publication for full data and Accounting for changes in inequality for detailed decomposition analysis of trends.
12. Measuring income in HBAI
HBAI uses data from the Family Resources Survey (FRS) to derive a measure of disposable household income. Adjustments are made to take into account the size and composition of households to make figures comparable.
FRS Survey Data
In FYE 2021, the FRS covers a sample of around 10,000 private households in the United Kingdom (around 19,000 households for the periods before the coronavirus (COVID-19) pandemic). Therefore, certain individuals, for example students in halls of residence and individuals in nursing or retirement homes will not be included.
Sampling Error
Results from surveys are estimates and not precise figures - in general terms the smaller the sample size, the larger the uncertainty. Confidence intervals help to interpret the certainty of these estimates, by showing the range of values around the estimate that the true result is likely to be within.
Non-sampling Error
These results are based on data from respondents to the survey. If people give inaccurate responses or certain groups of people are less likely to respond this can introduce biases and errors. This non-sampling error can be minimised through effective and accurate sample and questionnaire design and extensive quality assurance of the data. However, it is not possible to eliminate it completely, nor can it be quantified.
Income
This is measured as total weekly household income from all sources (including child income) after tax, national insurance and other deductions. Income measures are presented before and after housing costs (rent, mortgage interest payments, buildings insurance etc.)
A household income measure implicitly assumes that all members of the household benefit equally from the household’s income and so appear at the same position in the income distribution.
SPI adjustment
Estimates of mean income and some inequality measures are very sensitive to fluctuations in incomes at the top of the distribution. An adjustment to correct for this is made to ‘very rich’ households in FRS-based results using data from HMRC’s Survey of Personal Incomes.
Key Definitions
Household
One person living alone or a group of people (not necessarily related) living at the same address who share cooking facilities and share a living room, sitting room or dining area. A household will consist of one or more benefit units or families.
Family or Benefit Unit
A single adult or a couple living as married and any dependent children.
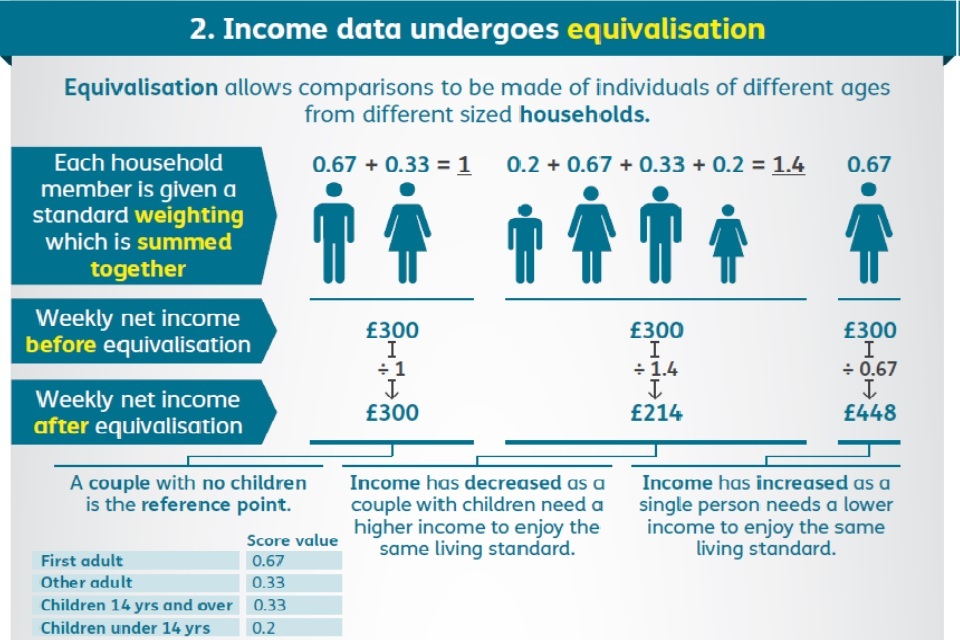
Equivalisation
An adjustment is made to income to make it comparable across households of different size and composition. For example, this process of equivalisation would adjust the income of a single person upwards, so their income can be compared directly to the standard of living for a couple.
Figure 30: Equivalisation
Inflation is the speed at which the prices of goods and services rise or fall. The use of different inflation measures has an effect on trends in average household income and absolute low income measures in HBAI.
HBAI uses variants of CPI to adjust for inflation to look at how incomes are changing over time in real terms i.e. if, for example, average incomes rise by 3% in cash terms but inflation is higher at 5%, then we will record a fall in average incomes as the real average purchasing power of incomes has fallen.
13. Strengths and Limitations
Strengths
The main strengths of HBAI include:
-
HBAI has provided the UK’s headline household income statistics since FYE 1995 using a consistent methodology. Hence, HBAI provides data on both current levels and short/medium/long term trends in incomes and the income distribution. It is the UK’s official source of poverty estimates and is also the main and recommended source on household and individual incomes
-
alongside statistics on low income, HBAI also measures and publishes data on other aspects of poverty. It includes statistics on levels of material deprivation and household food security, in combination with low income
-
the data are subject to extensive quality control and cleaning. Firstly, via the FRS data collection and editing processes operated by the FRS Consortium and DWP. And secondly via the HBAI production process operated by DWP and with additional quality assurance provided by the IFS
-
HBAI follows national and international best practice regarding the measurement of household incomes (e.g. regarding income from self-employment and housing costs) and the equivalisation of household incomes (see previous section) across differing household sizes and compositions
-
HBAI provides headline estimates with an extensive suite of supplementary tables via the HBAI home page, as well as user-defined breakdown tables via Stat-Xplore and in-depth analysis of case-level datasets via the UK Data Service
-
given its coverage of the whole UK private household population and wide range of demographic and socio-economic data, FRS/HBAI data can be used for many purposes beyond income/poverty analysis e.g. for a wide range of policy impact analyses
Limitations
The main limitations of HBAI include:
-
as with any survey, the data are subject to both non-response bias and reporting error, despite the best efforts of the survey sample design, data quality control and cleaning. We are seeking transform the FRS by increasing the use of administrative data from the full range of available sources (for example, from other parts of government). This should help correct for issues like benefit under-reporting and improve the quality of our income estimates. For more information on our strategic project to link the FRS to administrative data, please see the FRS background and methodology note, or the DWP Statistical Work Programme
-
although the source FRS survey is relatively large (with around 19,000 households surveyed before the coronavirus (COVID-19) pandemic), estimates for smaller sub-groups and geographical areas need to be produced by combining multiple survey years together and/or will be subject to wide confidence intervals. We are therefore working to increase the achieved sample size to around 45,000 in FYE 2023
-
whilst the equivalisation process allows household incomes to be compared across differing household sizes and compositions, the equivalisation factors used are somewhat simplistic e.g. adjusting income in the same way for all people aged 14 and over in a household (beyond the household reference person), regardless of whether the person is a child/working-age adult/pensioner or whether they are disabled or not
-
the statistics treat all members of each household equally in terms of the overall household income i.e. the equivalised household income is calculated and then all of the household is in low income (‘poverty’) if the household income is below 60% of the median, or all of the household is not in low income if the household income is at or above 60% of the median. In effect, this assumes that all members of the household are equally affected by the overall household income: a more reasonable assumption where household members are related than where they are not e.g. a group of unrelated young adults living together
-
due to the amount of data processing and quality assurance required, the statistics are published around 12 months after the reporting year
-
as the survey sampling frame covers private households only, it does not cover those living outside of private households e.g. people living in residential care and nursing homes, university halls of residence, prisons/detentions centres or rough sleepers
14. About these statistics
Income measure
The income measure used in HBAI is weekly net equivalised disposable income Before Housing Costs measuring income from all sources from all household members including:
-
usual net earnings from employment
-
profit or loss from self-employment (losses are treated as negative income)
-
state support – all benefits and tax credits, including state pension
-
income from occupational and private pensions
-
investment income
-
all maintenance payments
-
income from educational grants and scholarships
-
the cash value of certain forms of income in kind, including free school meals
Income is net of:
-
income tax and National Insurance contributions
-
domestic rates and council tax
-
contributions to occupational pension schemes
-
all maintenance payments
-
student loan repayments
-
parental contributions to students living away
-
ground rent and service charges
Income After Housing Costs
Income After Housing Costs is derived by deducting housing costs, including:
-
rent (gross of housing benefit)
-
water rates, community water charges and council water charges
-
mortgage interest payments
-
structural insurance premiums
Negative Incomes BHC are reset to zero, but negative AHC incomes are possible.
Children are defined as individuals aged under 16; or aged 16 to 19 in full-time non-advanced education.
Pensioners are defined as individuals over their state pension age at the time they are interviewed.
National Statistics Status: The regulatory arm of the UK Statistics Authority, the Office for Statistics Regulation (OSR), has designated these statistics as National Statistics, in accordance with the Statistics and Registration Service Act 2007, signifying compliance with the Code of Practice for Statistics.
The statistics underwent a full assessment against the Code of Practice for Statistics in 2011 and were confirmed as National Statistics in November 2012 by the Office for Statistics Regulation.
National Statistics status means that official statistics meet the highest standards of trustworthiness, quality and public value and comply with all aspects of the Code. OSR has undertaken this assessment to consider whether the statistics meet the required standard. Since the OSR review, we have continued to comply with the Code of Practice for Statistics, and have made a number of improvements including:
-
publications have been made significantly shorter to enable a focus on commentary and analysis
-
our publication, including charts and images, is now available in HTML format to aid accessibility
-
the timeliness of the publication has been improved so that reports are released within 12 months of the completion of the Family Resources Survey, made possible by improvements to the background, publication and checking codes that are used to conduct analysis
-
by making our data available on Stat-Xplore and UK Data Service, our statistics are more accessible and support new analysis for users not included in the publications themselves
-
the quality of statistics have improved as variants of the Consumer Price Index (CPI) have replaced the use of Retail Prices Index (RPI) when adjusting for inflation, in line with guidance from the UK Statistics Authority and National Statistician
-
improved methodology for measuring and reporting uncertainty around key HBAI estimates
-
The content of the HBAI publication has evolved in response to user needs, and to reflect increased interest in areas such as material deprivation and household food security, particularly when combined with low income. In the FYE 2021 publication we extended our existing suite of combined low income and child material deprivation measures to include measures based on absolute income, and below the 60% low income BHC threshold
Where to find out more
Further outputs and reference tables from HBAI analysis, alongside our HBAI Quality and Methodology Information Report, giving further detail on how we estimate the measures reported here are available on the HBAI release page.
15. Signposting to related statistics
The OSR review published in May 2021 recommended that income-based poverty statistics should improve the way they reference other data sources via signposting. This section has been expanded with additional links to sources to provide clearer and more detailed signposting to other income-based poverty statistics. This information will be reviewed and updated annually.
Other DWP National and Official Statistics
Details of other National and Official Statistics produced by the Department for Work and Pensions can be found on the DWP website with a schedule of statistical releases over the next 12 months and a list of the most recent releases.
In accordance with the Code of Practice for Statistics, all DWP National Statistics are also announced on the Government Statistics website, and in the DWP statistics release calendar.
Other income statistics
The UK has two main, official sources of household income statistics: the Family Resources Survey (FRS) and the Household Finances Survey (HFS) run by the Office for National Statistics (ONS).
FRS estimates underpin DWP’s Households Below Average Income (HBAI) series, which is the UKs official source of poverty estimates and is also the main and recommended source on household and individual incomes. HFS data are used to produce ONS’s Household Disposable Income Inequality (HDII) and Effects of Taxes and Benefits (ETB) series. HDII is the best and recommended source when comparing the overall financial well-being of households when combining income and expenditure.
There are some key methodological differences between the two series which mean that their income estimates are different. For example, the FRS focuses on respondents’ weekly incomes at the time of interview, whereas HFS focuses more on annual income. The treatment of pension contributions also differs, with ONS’ estimate of Gross Household Income being calculated before pension contributions. Further details are available in the income and earnings statistics guide.
The new ONS interactive tool is an additional resource which can be used to identify sources of statistics on income and earnings, and their key features. Alongside the HDII and ETB series, two others which may be of particular interest to users with an interest in income-based poverty are:
-
Income Dynamics (ID) which looks at changes in household income including a measure of persistent low income, based on Understanding Society data
-
Children in Low Income Families provides data on the number and proportion of children living in low income families, Before Housing Costs (BHC), across the United Kingdom by local area
This year DWP has also published an experimental series of combined working age absolute low income and material deprivation estimates covering FYE 2011 to FYE 2021. The release is accompanied by a technical paper which describes the ongoing work to develop these experimental statistics, including the current material deprivation review.
ISBN 978-1-78659-410-5