Fifth report on statistics relating to exit checks: 2019 to 2020
Published 27 August 2020

© Crown copyright 2020
This publication is licensed under the terms of the Open Government Licence v3.0 except where otherwise stated. To view this licence, visit nationalarchives.gov.uk/doc/open-government-licence/version/3 or write to the Information Policy Team, The National Archives, Kew, London TW9 4DU, or email: psi@nationalarchives.gov.uk.
Where we have identified any third party copyright information you will need to obtain permission from the copyright holders concerned.
This publication is available at https://www.gov.uk/government/statistics/fifth-report-on-statistics-relating-to-exit-checks/fifth-report-on-statistics-relating-to-exit-checks-2019-to-2020
This release provides updated results on the proportion of non-EEA nationals who departed before their visa or leave expired for April 2019 to March 2020, as well as updated data quality metrics for exit check data collected by the Initial Status Analysis (ISA) system.
Key results
Of the 1.9 million visas that expired with no extension or further leave in the year ending March 2020:
-
95.2% departed in time, before their visa expired;
-
0.4% departed late, after their visa expired;
-
4.4% were not matched to a departure record.
The proportions departing in time were higher for Study visas expiring in the year ending March 2020 (97.5%), and lower for Visit (96.2%) and Work (94.9%) visas.
Individuals with no departure recorded were not necessarily non-compliant. They may have departed and not been recorded, or their departure may not have been matched against their arrival by the system.
For the latest quarter to June 2020, coverage (the extent to which systems are in place to collect Advance Passenger Information/Travel Document Information (API/TDI) data for all travel routes) was 100% for outbound routes and 89% for inbound routes.
The User Guide to Home Office statistics relating to exit checks provides further details on this topic including definitions used, how figures are compiled, data quality and issues arising from figures based on data sourced from an administrative database. For further details see the data tables.
The Home Office responsible statistician is Bex Newell.
Statistical or public enquiries
We’re always looking to improve the accessibility of our documents. If you find any problems, or have any feedback, relating to accessibility please email us at MigrationStatsEnquiries@homeoffice.gov.uk
Media enquiries via Home Office news desk
Journalists with enquiries can call the Home Office news desk on 020 7035 3535. The desk operates from 7am to 8pm, Monday to Friday.
1. Introduction
This experimental statistics report is the fifth Home Office report on exit checks data and provides updated results on the proportion of non-EEA nationals who departed before their visa expired, as well as updated data quality metrics for data collected under the Initial Status Analysis (ISA) system.
The ISA system combines data from different administrative sources to link an individual’s travel in or out of the UK with their immigration history:
Figure 1.1: Sources of information in the Initial Status Analysis system
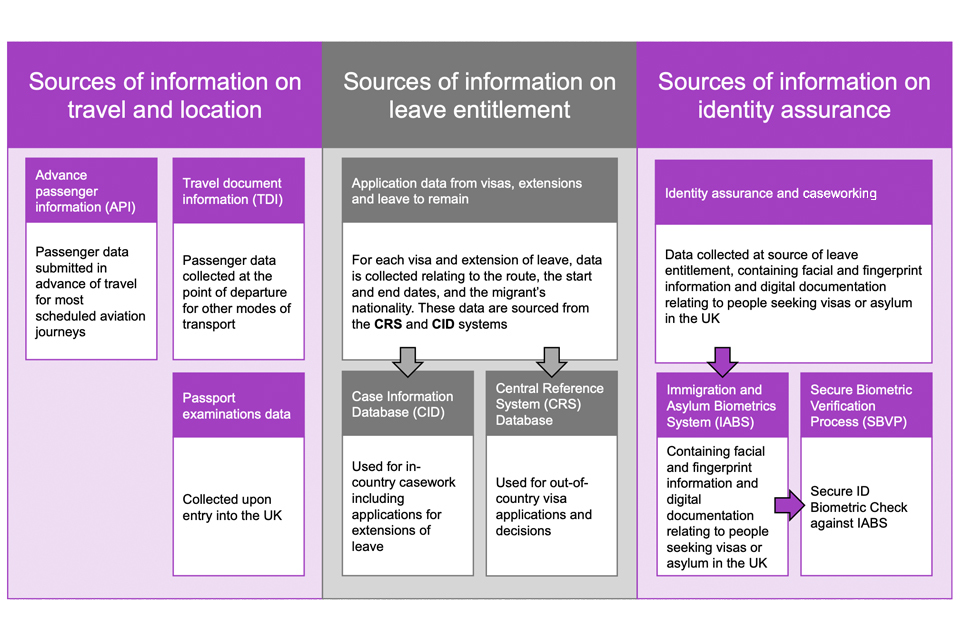
The figure shows the sources of information in the Initial Status Analysis system. These are split into three main categories: 1) Sources of information on travel and location; 2) Sources of information on leave entitlement and 3) Sources of information on identity assurance. For the first category, advance passenger information, travel document information and passport examinations data all contribute to information on travel and location. For the middle category, application data from visas, extensions and leave to remain are loaded from the Case Information Database (CID) and Central Reference System (CRS); helping to provide information on leave entitlement. For the third category, data containing facial and fingerprint information and digital documentation relating to people seeking visas or asylum in the UK are entered into the Immigration and Asylum Biometrics System (IABS) and then used to check for visa nationals information at the border as part of the Secure Biometric Verification Process (SBVP).
Figure note
The data matching and analytical capability built by the Exit Checks Programme, the Initial Status Analysis (ISA) system, is still under development. The Exit Checks Programme closed in May 2016 having delivered the system at the border.
In section 2, compliance figures relating to the 2019/20 financial year (year ending March 2020) are provided, and figures for previous years have been updated. Data included in this release are provisional and based on a snapshot taken on 27 May 2020. They are based on live operational systems which change continually as new information is added. Changes to the ISA data system and to the underlying information recorded on operational systems may result in future revisions to the figures quoted in this report.
The ISA system was designed primarily for operational immigration control rather than to produce statistics. The results are based on matching data from multiple administrative datasets, and the figures are therefore experimental estimates.
The analysis in this report excludes:
- The majority of visitors to the UK who do not need a visa for any reason, such as UK and EU nationals living overseas
- Non-visa nationals, such as US citizens, who do not normally need a visa to visit the UK
- Nationals of Gulf states visiting under the electronic visa waiver scheme
- Visit visa holders who have long-term visit visas, allowing multiple visits each of up to six months. Such six-month expiries under long-term visit visas accounted for around a third (30.6%) of all visit visas expiring in the year ending March 2020.
- Those who arrived in the UK or extended their stay in the UK prior to the introduction of exit checks in April 2015.
Detailed information is available in the Fifth report on statistics relating to exit checks: 2019/20 data tables.
1.1 Limitations of the data
Due to the need to match a number of journeys to provide analysable travel histories for individuals, there are a number of statistical challenges, including the extent to which systems are in place to collect data for all travel routes, the completeness of departure confirmation messages provided by carriers for every flight or voyage, and how data on these travel movements can be matched to immigration system records. There are many reasons why a person’s record may not be matched including, for example, if they are dual nationals and do not use a single document for travel or if different data systems have captured their name or other details differently.
The User Guide to Home Office statistics relating to exit checks provides further details including definitions used and supplementary information on data quality issues.
2. Compliance results
Figures in this section relate to when non-EEA visa nationals departed compared to their visa expiry date, including those on short term visit visas, and those on longer term routes such as work or study. The analysis includes only those people who had both valid leave after April 2015 (the date when the full ISA system was launched) and were identified as entering the UK from April 2015 onwards – this includes both people granted visas after April 2015 and people returning to the UK on an existing valid visa. Analysis is based on those people whose visa expired during the period analysed and will therefore not include those individuals who were granted further leave to remain in the UK beyond that.
2.1 Key results
- Of non-EEA visa holders whose leave expired in the year ending March 2020, 95.2% were recorded as having left before their visa expired.
-
4.8% were not recorded as having left before their expiry date. Of these, 0.4% were recorded as departing late, while 4.4% had no departure identified.
- Identified departure rates were highest for students, followed by visitors, then Tier 2 (High value) and Tier 5 (Youth mobility and temporary) workers. However, differences in departure rates may be due to recording or matching issues and travel through less-covered routes, and may not indicate real differences in departures.
All of the statistics reported here are estimates and only able to indicate minimum levels of compliance. There are known sources of uncertainty in the data that mean the small minority of individuals with no departure identified were not necessarily non-compliant.
2.2 Identified departure rates for non-EEA nationals granted visas, by visa type
Of non-EEA visa holders whose leave expired in the year ending March 2020:
- 95.2% were recorded as having left before their visa expired
- 4.8% were not recorded as leaving before their visa expiry date. 0.4% departed late (i.e. after their leave had expired), while 4.4% had no departure identified.
Of those who arrived to study, 97.5% were recorded as having left before their visa expired, compared to 96.2% of those who arrived as a visitor and 94.9% of those who arrived on a Work visa.
Table 2.1: Identified departure rates for non-EEA nationals granted visas, by visa type, year ending March 2020
| Visa category | Volume of expiries | Number with known departure in time | Percentage with known departure in time | Percentage with no initially identified departure in time |
|---|---|---|---|---|
| Visiting the UK | 1,439,200 | 1,385,154 | 96.2% | 3.8% |
| Total Study | 289,453 | 282,200 | 97.5% | 2.5% |
| Sponsored study (Tier 4 | 178,333 | 172,417 | 96.7% | 3.3% |
| Short term study | 111,120 | 109,783 | 98.8% | 1.2% |
| Total Work | 116,057 | 110,177 | 94.9% | 5.1% |
| Skilled (Tier 2) | 55,661 | 53,390 | 95.9% | 4.1% |
| Youth mobility & temporary work (Tier 5) | 37,660 | 36,119 | 95.9% | 4.1% |
| Overseas Domestic Workers | 15,828 | 14,548 | 91.9% | 8.1% |
| Other Employment | 3,757 | 3,447 | 91.7% | 8.3% |
| High value (Tier 1) | 3,151 | 2,673 | 84.8% | 15.2% |
| Total Other | 69,108 | 44,675 | 64.6% | 35.4% |
| EEA Family Permit | 22,090 | 10,885 | 49.3% | 50.7% |
| Other, excluding EEA Family Permit | 47,018 | 33,790 | 71.9% | 28.1% |
| All visa expiries year ending March 2020 | 1,913,818 | 1,822,206 | 95.2% | 4.8% |
Source:
Fifth report on statistics relating to exit checks: year ending March 2020 data tables DataTable1
Table notes
1.Percentages may not sum to 100% due to rounding. 2.Those granted EEA family permits are often eligible to receive further leave to remain under the EU Settlement Scheme. As data from the EUSS are not ingested into the ISA system, any leave obtained under it will not be considered when calculating the compliance rate. It is therefore likely that for EEA family permits and by extension the ‘Other’ category, the true compliance rate is higher than estimated here.
In work categories, identified departure rates were highest for skilled workers (Tier 2) and youth mobility and temporary workers (Tier 5) for visas expiring in the year ending March 2020 (both 95.9%). They were slightly lower (91.9%) for smaller categories of work routes outside the Points Based System, particularly the domestic worker category, and for Tier 1 visas (84.8%) – which have now become a relatively small category following the closure of the Tier 1 General and Post-study routes in 2011/2012 - and the Entrepreneur, Graduate Entrepreneur and Exceptional Talent routes in the year ending March 2020.
The majority (80.8%) of visa holders in the ‘Other work’ category were Overseas Domestic Workers. It is possible that travellers on these visas, or Tier 1 visas, were more likely to depart using less common routes. The lower rate for Tier 1 may also reflect that a relatively high proportion of such cases extend their stay in-country and go on to settlement (and would, therefore, not be included in these rates).
Figure 2.1: Identified departure for non-EEA nationals granted visas, by visa type subgroup, year ending March 2020
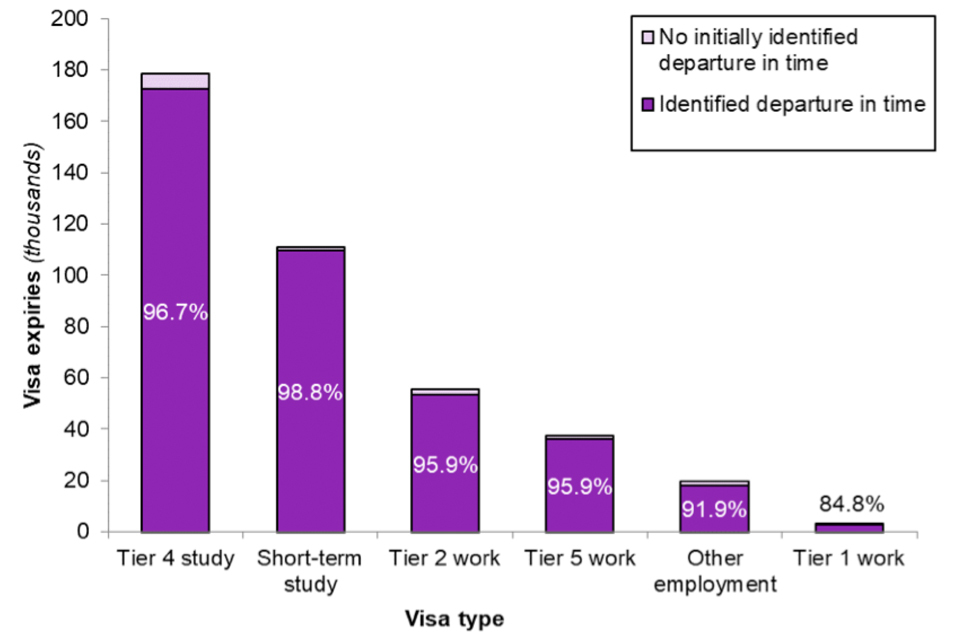
The chart shows the proportions of departure rates for those whose visas expired in the year ending March 2020, that had either an ‘Identified departure in time’ or ‘No initially identified departure in time’. The visa type with the highest number of expiries was Tier 4 study visa (178,333). Tier 1 work visas had the lowest number of expiries (3,151). The highest proportion of visas with an identified departure in time was for short-term study visas (98.8%). The lowest proportion with an identified departure in time were for ‘Tier 1 work’ visas (84.8%).
Source:
Fifth report on statistics relating to exit checks: 2019/20 data tables DataTable1
Figure note
Identified departure rates were lowest for the ‘Other’ visas, which includes all those who are not visiting the UK, or here for work or study. Around 35% (24,500) of visa expiries in the ‘Other’ category had no recorded departure in time. Of these, almost half (46%; 11,200) related to expiries of EEA Family Permits. Those granted EEA family permits are often eligible to receive further leave to remain under the EU Settlement Scheme. As EUSS data are not currently able to be ingested into the ISA system, any leave obtained under this scheme will not be included when calculating the compliance rate. It is therefore likely that for EEA family permits, and by extension the ‘Other’ category, these statistics do not provide a true indication of in-time departures.
All of the statistics reported here are estimates and only able to indicate minimum levels of compliance. There are known sources of uncertainty in the data that mean the small minority of individuals with no departure identified were not necessarily non-compliant. See Section 3 ‘Quality metrics’ for further details.
2.3 Identified departure rates for non-EEA nationals granted visas, by nationality
The top 10 nationalities together accounted for 70% of visas that expired in the year ending March 2020. Of the top 10, the proportions identified as departing in time were highest for Saudi Arabian nationals (99.0%), followed by Russian and Thai nationals (both 98.4%). They were lowest for Pakistani (90.8%), Filipino (91.1%) and Chinese nationals (92.3%) although some of the differences between nationalities will reflect the coverage and route issues previously mentioned and other factors discussed below.
Table 2.2: Identified departure rates for non-EEA nationals granted visas, by nationality, year ending March 2020
| Country of nationality | Volume of expiries | Number with known departure in time | Percentage with known departure in time | Percentage with no initially identified departure in time |
|---|---|---|---|---|
| TOTAL | 1,913,818 | 1,822,206 | 95.2% | 4.8% |
| India | 473,600 | 452,894 | 95.6% | 4.4% |
| China | 252,366 | 232,988 | 92.3% | 7.7% |
| China non-ADS | 175,666 | 171,492 | 97.6% | 2.4% |
| China ADS | 76,700 | 61,496 | 80.2% | 19.8% |
| Russia | 125,043 | 123,002 | 98.4% | 1.6% |
| Saudi Arabia | 96,237 | 95,253 | 99.0% | 1.0% |
| South Africa | 90,308 | 88,420 | 97.9% | 2.1% |
| Thailand | 72,071 | 70,915 | 98.4% | 1.6% |
| Turkey | 66,188 | 64,594 | 97.6% | 2.4% |
| Philippines | 56,771 | 51,746 | 91.1% | 8.9% |
| Pakistan | 55,903 | 50,785 | 90.8% | 9.2% |
| Nigeria | 52,116 | 48,407 | 92.9% | 7.1% |
| Other nationalities | 573,215 | 543,202 | 94.8% | 5.2% |
Source:
Fifth report on statistics relating to exit checks: 2019/20 data tables DataTable2
Table notes
A large number of Chinese visitors are granted long-term visit visas, which are excluded from this analysis. Additional ADS data has yet to be fully incorporated in the results for the year ending March 2020 due to data lags.
As noted, the proportion of timely departures does not necessarily correlate with non-compliance. Part of the variation is accounted for by differences by nationality, and part is accounted for by differences in visa category. The lower proportions identified departing in time for some nationalities may reflect how well the immigration records get matched (for example, some nationalities’ names may be more difficult to match than others).
For example, the rate for Chinese nationals (92.3%) is one of the lowest of the top 10 nationalities, but this reflects known issues in coverage for tour groups whose visa has been arranged through the ‘Approved Destination Status’ (ADS) agreement, including that these tour groups are likely to travel via the Common Travel Area. Work is underway to include additional travel data for those using the ADS route and this is expected to improve the recorded compliance rate. Excluding the ADS cases increases the proportion of identified departures in time for Chinese nationals from 92.3% to 97.6%.
The estimate for Filipino nationals (91.1%) is also slightly lower than the average, which is accounted for by a small number on a ‘JOINING SHIP’ transit visa indicated as departing late. Excluding those on ‘JOINING SHIP’ transit visas, the Filipinos estimate rose to 96.5%.
Figure 2.2: Identified departure rates for non-EEA nationals granted visas, by nationality, year ending March 2020
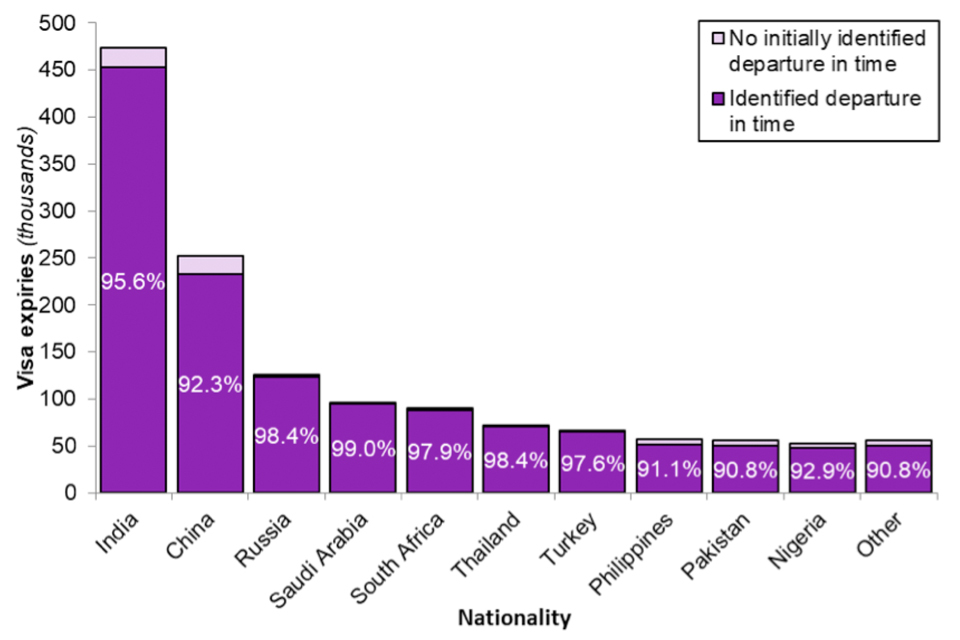
The chart shows the top 10 proportions of departure rates, for those whose visas expired in the year ending March 2020, that had either an ‘Identified departure in time’ or ‘No initially identified departure in time’, arranged by nationality. The nationality with the highest number of expiries was India (473,600). The highest proportion of visas with an identified departure in time was for Saudi Arabia (99.0%). Pakistan and the ‘Other’ countries (all those outside of the top 10 combined) had a proportion of visas with an identified departure in time of 90.8%.
Source:
Fifth report on statistics relating to exit checks: 2019/20 data tables DataTable2
Chart note:
A large majority of Chinese visitors are granted long-term visit visas, which are excluded from this analysis.
The small changes observed year-to-year are most likely due to variation over time in the composition of visa types and nationalities, and such small changes between years do not imply any change in the overall trend or alter the key finding of high levels of compliance. The metrics covered in Section 3 do not suggest a reduction in data quality has occurred.
3. Quality Metrics
This chapter reports the quality of data being collected for people travelling to and from the UK. This includes:
- Coverage: the extent to which systems are in place to collect Advance Passenger Information/Travel Document Information (API/TDI) data for all travel routes
- Aviation data receipt: percentage of voyages where at least one Passenger Check-in and one Departure Confirmation message was received. This measurement does not mean that data for every passenger on a voyage was received.
- Data matching: matching rates of API data to Immigration System records and Passport Examinations data
3.1 Key results
- For the quarter ending June 2020, coverage was 100% for in-scope outbound routes and 89% for inbound routes.
- Estimates for aviation data receipt stood at 98.9% (inbound) and 99.2% (outbound) in February 2020.
- Aviation accounted for 86% of overall inbound and outbound travel movements. Rail travel (Eurostar and Eurotunnel) accounts for 7% and maritime travel for the remaining 7% for the year ending March 2020.
3.2 Coverage
Coverage is a measure of the proportion of routes which are covered by the system for collecting API/TDI data on border crossings; all carriers on a specified route are required to provide data for their flights, voyages or rail journeys.
Using a coverage measure weighted by numbers of people travelling via different routes, it was estimated that the coverage of API/TDI collected by the Home Office reached 100% for outbound routes by the end of June 2015 and 89% for all inbound routes by the end of June 2017, (including 100% for arrivals by air and cruise liner passengers), and has remained stable and high since.
For the latest quarter to June 2020, the overall coverage figures were 100% for outbound and 89% for inbound routes, the same as those reported for quarter ending June 2019. The 0% and 24% coverage for rail inbound and ferry inbound travel is mitigated by passport examinations data. In particular, all inbound rail passengers and most inbound ferry passengers arriving from Belgium or France must present passports for examination (at UK’s juxtaposed border controls).
Figures for coverage are available from mid-2014 at the level of individual modes of travel (aviation, maritime, rail) in Table 3.1.
Table 3.1: Route coverage figures for API/TDI
| 30-Jun-14 | 30-Jun-15 | 30-Jun-16 | 30-Jun-17 | 30-Jun-18 | 30-Jun-19 | 30-Jun-20 | |
|---|---|---|---|---|---|---|---|
| Outbound all travel modes | 81% | 100% | 100% | 100% | 100% | 100% | 100% |
| Aviation outbound | 96% | 100% | 100% | 100% | 100% | 100% | 100% |
| Rail outbound | 0% | 100% | 100% | 100% | 100% | 100% | 100% |
| Maritime outbound | 22% | 100% | 100% | 100% | 100% | 98% | 100% |
| Maritime outbound (cruise) | 50% | 100% | 100% | 100% | 100% | 100% | 100% |
| Maritime outbound (ferry) | 17% | 100% | 100% | 100% | 100% | 97% | 100% |
| Inbound all travel modes | 81% | 83% | 87% | 89% | 89% | 89% | 89% |
| Aviation inbound | 96% | 97% | 100% | 100% | 100% | 100% | 100% |
| Rail inbound | 0% | 0% | 0% | 0% | 0% | 0% | 0% |
| Maritime inbound | 21% | 29% | 32% | 42% | 42% | 39% | 41% |
| Maritime inbound (cruise) | 53% | 94% | 100% | 100% | 100% | 100% | 100% |
| Maritime inbound (ferry) | 16% | 16% | 22% | 25% | 24% | 23% | 24% |
Source: UK Border Force internal management information
3.3 Commercial aviation data receipt
While coverage of exit checks data has now increased to 100% for the in-scope outbound routes, indicating that systems are in place to collect data, carriers do not always in practice supply data pertaining to a flight or an individual. Estimates of voyage level data receipt are available for aviation routes and relate to the extent to which carriers supply API data for voyages, not whether all data for every passenger on a particular voyage was received.
It is also possible to measure the completeness of data supplied by commercial aviation carriers:
- Inbound aviation data receipt = where at least one Passenger Check-in message was received.
- Outbound aviation data receipt = where at least one Passenger Departure Confirmation message was received.
Not all data for every flight and passenger may be received from carriers. As yet, there are no measures of voyage level data receipt for rail and maritime travel.
Estimates for aviation level data receipt stood at 98.9% (inbound) and 99.2% (outbound) in February 2020, which is the last month for which we have accurately cleansed inbound data receipt figures. The inbound and outbound figures for June 2020 were not able to be cleansed to the normal standard, due to disruption caused by COVID-19. The February 2020 figures have therefore been provided, in addition to the June 2020 figures, as this is the last month for which we have accurate inbound data. This will be an ongoing issue while the airline industry re-establishes processes as it emerges from lockdown.
Table 3.2: Estimates for aviation level data receipt
| Aviation level data receipt | 30-Jun-16 | 30-Jun-17 | 30-Jun-18 | 30-Jun-19 | 29-Feb-20 | 30-Jun-20 |
|---|---|---|---|---|---|---|
| Outbound | 97.2% | 98.3% | 98.5% | 99.0% | 99.2% | 53.3% |
| Inbound | 97.6% | 98.7% | 98.9% | 99.5% | 98.9% | 55.4% |
Source:
UK Border Force internal management information
Table notes:
The inbound and outbound figures for March to June 2020 are not cleansed to the normal standard, due to disruption caused by COVID-19. This included factors such as airlines not cancelling flights within the reference data, so that they were shown as operating when this was not the case. The February figures have been provided, in addition to the June figures, as this is the last month for which we have accurate inbound data.
Aviation accounts for around 86% of overall inbound and outbound travel movements. Rail travel (Eurostar and Eurotunnel) accounts for 7% and maritime travel for the remaining 7%. Although some background level of missing data is inevitable, this potential source of uncertainty needs to be taken into account when interpreting the figures on departure rates.
3.4 Proportion of immigration system records matched to API data (visa national identities only)
The Initial Status Analysis (ISA) system combines immigration and travel events data into identities that link an individual’s travel in or out of the country with immigration system data, such as visa type and periods of leave granted.
Matching rates of API data to immigration system records for visa national identities were 95.5% for inbound journeys, similar to the preceding year (95.4%), and 91.4% for outbound (a decrease from 92.0%) in the year ending March 2020. In other words, for more than 9 out of every 10 travel events to or from the UK by visa nationals where an identity could be constructed in the system, there was a corresponding and linkable out-of-country visa or in-country grant of leave. For further information, see Fifth report on statistics relating to exit checks: 2019/20 data tables DataTable3 and DataTable4.
3.5 Proportion of Passport Examinations data matched to API data (visa national identities only)
The ISA system also records data from examinations of passports at the border, known as Passport Examinations data. This data can be used to supplement inbound API data, completing any missing data, and provides additional information for matching to immigration systems.
Matching rates of API data to Passport Examinations data for visa nationals were 92.9% for all routes and similar for aviation only (93.3%) in the year ending March 2020.
Table 3.3: Matching rates for inbound API to PS data
| YE March 2017 | YE March 2018 | YE March 2019 | YE March 2020 | |
|---|---|---|---|---|
| All routes | 91.6% | 92.6% | 93.1% | 92.9% |
| Aviation only | 92.5% | 93.6% | 93.9% | 93.3% |
4. Further information and enquiries
Detailed data are presented in four data tables within the Fifth report on statistics relating to exit checks: 2019/20 data tables, including updated figures for previous years:
- Table 1.1: Identified departure rates for non-EEA nationals granted visas, by visa type, year ending March 2020. This table corresponds with DataTable1 within Fifth report on statistics relating to exit checks: 2019/20 data tables (which covers data for the years ending March 2017 to March 2020).
- Table 1.2: Identified departure rates for non-EEA nationals granted visas, by nationality, year ending March 2020. This table corresponds with DataTable2 within Fifth report on statistics relating to exit checks: 2019/20 data tables (which covers data for the years ending March 2017 to March 2020).
- DataTable4: Proportion of inbound Advance Passenger Information (API) journeys for visa national identities where Immigration System records found, listed in the order of the greatest number of inbound API journeys. Found in Fifth report on statistics relating to exit checks: 2019/20 data tables (which covers data for the years ending March 2017 to March 2020).
- DataTable5: Proportion of outbound Advance Passenger Information (API) journeys for visa national identities where Immigration System records found, listed in the order of the greatest number of outbound API. Found in Fifth report on statistics relating to exit checks: 2019/20 data tables (which covers data for the years ending March 2017 to March 2020).
4.1 About the figures
The compliance figures in this study relate to when non-EEA visa nationals departed compared to their visa expiry date, including those on short term visit visas, and those on longer term routes such as work or study. The analysis includes only those people who had both valid leave after April 2015 (the date when the full ISA system was launched) and were identified as entering the UK from April 2015 onwards – this includes both people granted visas after April 2015 and people returning to the UK on an existing valid visa. Analysis is based on those people whose visa expired during the period analysed and will therefore not include those individuals who were granted further leave to remain in the UK beyond that.
The compliance figures for preceding years (YE March 2017, YE March 2018 and YE March 2019) were re-calculated, using the most recent data extract, to give updated data quality metrics for exit check data.
This is the fifth in a series of reports relating to exit checks. It is published annually by the Home Office and complements data published as part of the quarterly National Statistics release of Immigration Statistics.
The compliance findings presented here are based on data collected from Home Office administrative databases, as described in Figure 1. As these are sourced from operational systems, numbers may change and may not precisely reflect other published statistics, if those are produced and published at a different time.
The User Guide to Home Office statistics relating to exit checks provides further details on this topic including definitions used, how figures are compiled, data quality and issues arising from figures based on data sourced from an administrative database.
4.2 Statistical or public enquiries
We’re always looking to improve the accessibility of our documents. If you find any problems, or have any feedback, relating to accessibility please email us at MigrationStatsEnquiries@homeoffice.gov.uk
4.3 Media enquiries via Home Office news desk
Journalists with enquiries can call the Home Office news desk on 020 7035 3535. The desk operates from 7am to 8pm, Monday to Friday.
5. Glossary of terms
This glossary sets out terms used in the ‘Fourth report on statistics being collected under the exit checks programme’ release. It is intended to give an overview of the terms, rather than a full technical description. If there are terms in the release that you would like to be explained in this glossary, please contact: MigrationStatsEnquiries@homeoffice.gov.uk.
Advance Passenger Information (API)
This refers to travel document and service information submitted by carriers in advance of departure for passengers and crew. Data is often self-declared by passengers to carriers at the time of booking.
Aviation level data receipt (previously referred to as ‘completeness’)
Figures for voyage level data receipt are currently available for aviation and relate to the percentage of voyages where at least one passenger message was received. This measurement does not mean that all data for every passenger was received.
Aviation data receipt (formerly Completeness)
Percentage of voyages where at least one Passenger Check-in and one Departure Confirmation message was received. This measurement does not mean that data for every passenger on a voyage was received
Coverage
Coverage is a measure of the degree to which those routes that are in scope have systems in place that allow submission of data to relevant Home Office administrative systems and hence to the Initial Status Analysis system.
Data matching (formerly Coherence)
Matching rates of API data to Immigration System records and Passport Examinations data
European Economic Area (EEA)
The EEA consists of the European Union member states as well as Iceland, Liechtenstein and Norway. Switzerland is also included here as although it is not formally a member of the EEA, it has analogous status with respect to immigration control.
Initial Status Analysis (ISA) database
A detailed database developed for monitoring movements of non-EEA nationals that combines not just the API and TDI required for exit checks, but also other sources of information including the main data on visas and other forms of permission granted for leave to remain in the UK, such as extensions of leave in the UK.
Non-visa national
A citizen of a country where there is generally no requirement to obtain a visa prior to travelling to the UK as a visitor see Immigration Rules Appendix V: visitor rules. An entry clearance may be required for travel for other purposes, this being referred to as a visa in statistical publications to be in line with the terminology for ‘visa nationals’.
Travel Document Information (TDI)
This refers to passenger information submitted by carriers or port operators at, or shortly after, the point of departure.
Visa national
A citizen of a country where there is a requirement that they obtain a visa prior to travelling to the UK including as a visitor see Immigration Rules Appendix V: visitor rules. For the purpose of this report, nationals of countries where visitors can obtain an electronic visa waiver in place of a visit visa are also viewed as visa nationals.