Family Resources Survey: financial year 2019 to 2020
Published 25 March 2021

© Crown copyright 2021
This publication is licensed under the terms of the Open Government Licence v3.0 except where otherwise stated. To view this licence, visit nationalarchives.gov.uk/doc/open-government-licence/version/3 or write to the Information Policy Team, The National Archives, Kew, London TW9 4DU, or email: psi@nationalarchives.gov.uk.
Where we have identified any third party copyright information you will need to obtain permission from the copyright holders concerned.
This publication is available at https://www.gov.uk/government/statistics/family-resources-survey-financial-year-2019-to-2020/family-resources-survey-financial-year-2019-to-2020
Results from the Family Resources Survey (FRS) for the financial year 2019 to 2020, providing information on income and circumstances of UK households.
We are seeking user feedback on this HTML version of the statistical release which replaces the PDF version. Please send comments to our team email: team.frs@dwp.gov.uk.
The FRS is a continuous household survey which collects information on a representative sample of private households in the United Kingdom.
Detailed information is recorded on each respondent:
- their incomes, from all sources including self employment
- housing tenure
- caring needs and responsibilities
- disability
- expenditure on housing
- education
- pension participation
- childcare
- family circumstances
- child maintenance
1. Main Stories
This report summarises the key findings from the FRS for the financial year 2019 to 2020, when over 19,000 households were interviewed.
Data collection was suspended in mid-March 2020 in line with the national lockdown. At this point nearly a full year’s worth of FRS interviews had taken place and there is no impact of COVID-19 upon these results. They form a pre-COVID-19 baseline picture of household incomes.
Income and State Support
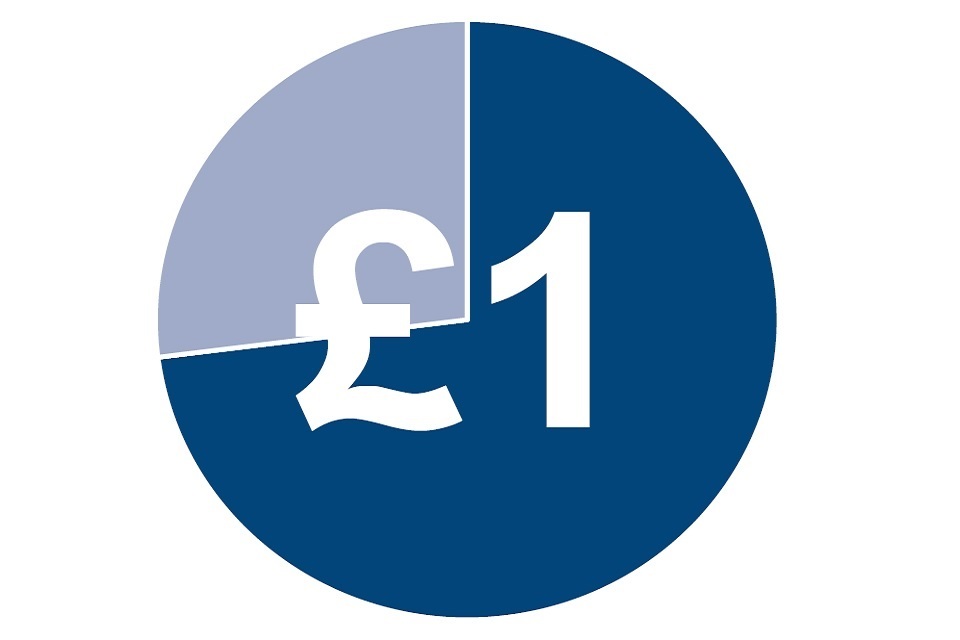
Income from employment and self-employment made up 74p of every £1 of household income.
Tenure
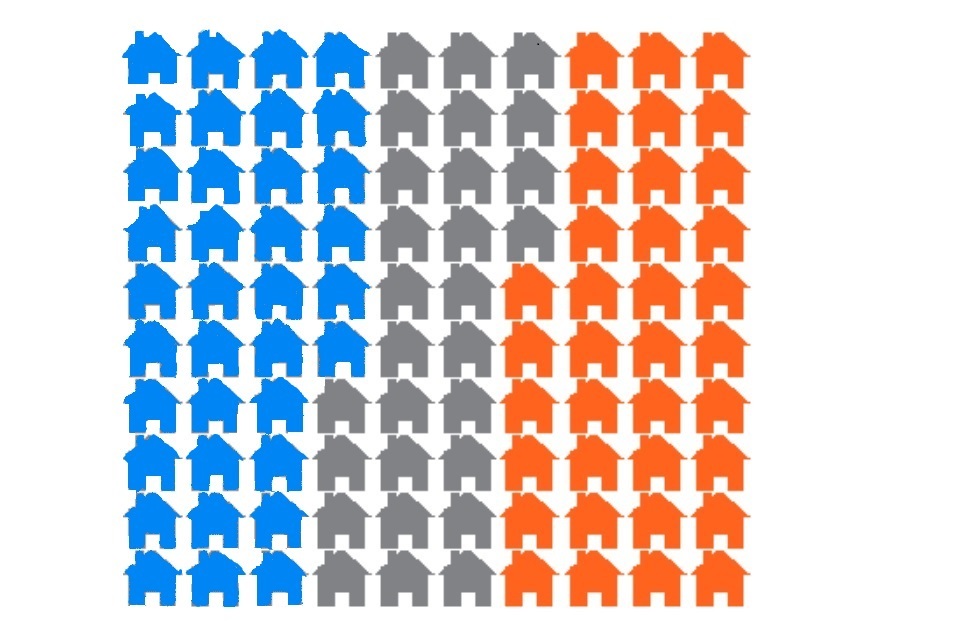
The percentage of households owning their property outright has increased gradually over the past decade, and is now 36%, equivalent to those in rented accommodation.
Disability
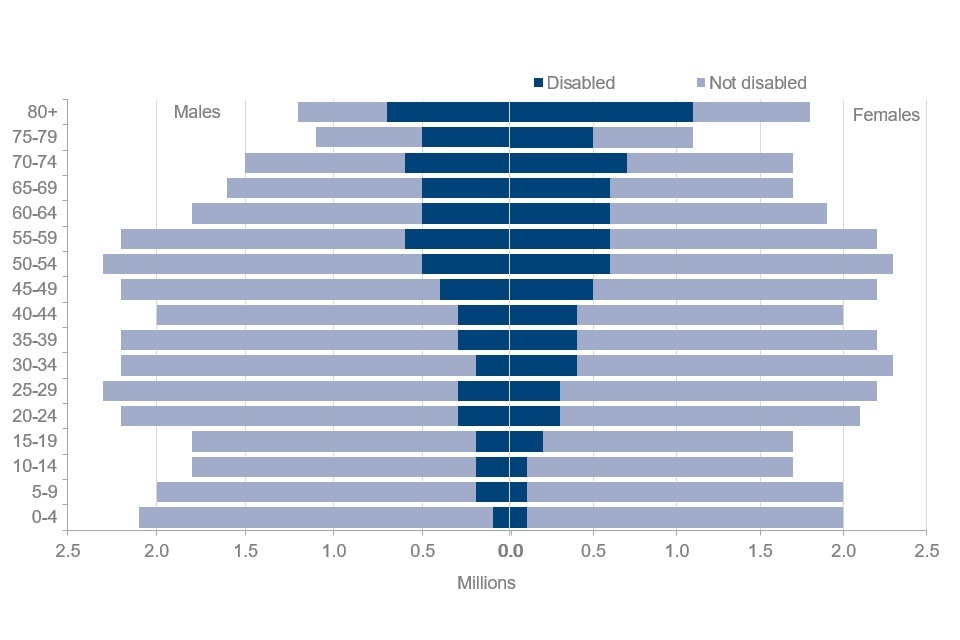
Most age groups have seen a higher proportion of females than males reporting that they are disabled. The exception are younger ages (15 and younger).
Care
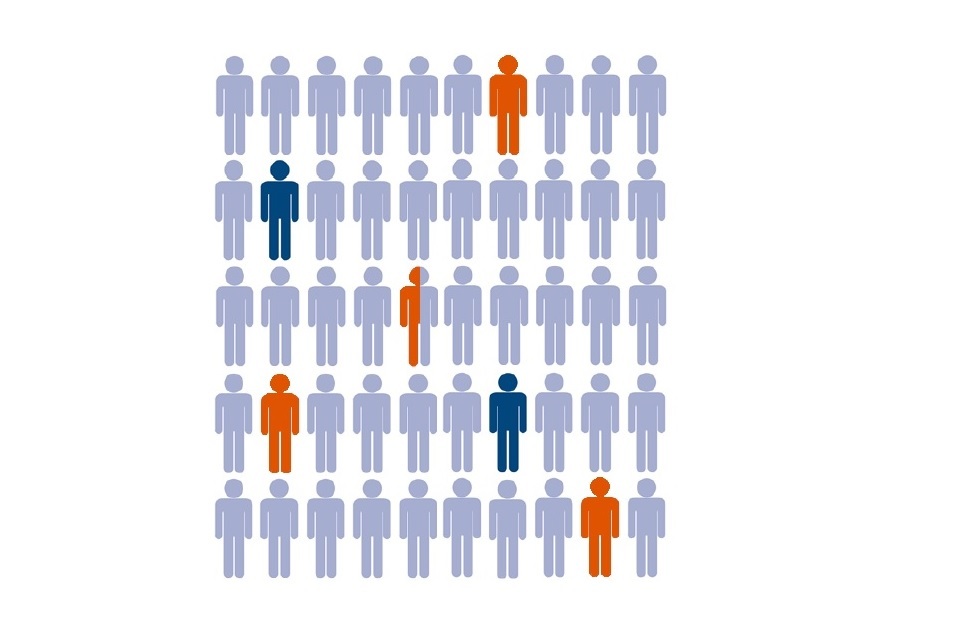
Two in every 50 people were in receipt of care. More than three in every 50 people are providing informal care to someone else and a third of these are also in full-time employment.
Pension Participation
Pension scheme participation increased substantially, following the introduction of automatic enrolment for employees in 2012.
Self Employment
Net earnings for the full-time self-employed have increased faster than those of full-time employees. This has narrowed the pay differential, such that net earnings for the self-employed was only 15% lower than those of full-time employees; the smallest difference in the last ten years.
Household Food Security

Most people lived in households with high household food security (87%) or marginal household food security (6%). A minority of households were food insecure, with low household food security (4%) or very low household food security (4%).
2. What you need to know
The primary purpose of the FRS is to provide the Department for Work and Pensions (DWP) with data to inform the development, monitoring and evaluation of social welfare policy.
The survey is used by many other government departments and is used for tax and benefit policy modelling by HM Treasury and HM Revenue and Customs. The FRS is also used extensively by academics and research institutes for social and economic research.
For further contextual information on the statistics presented, as well as detailed information about FRS methodology, see the Background Information and Methodology available alongside this publication.
Other FRS-based publications
The FRS provides the underlying data for three other DWP National and Official Statistics reports:
- Households Below Average Income
- Pensioners’ Incomes Series
- Income-Related Benefits: Estimates of Take-up
Households, benefit units and individuals
Results in this report, depending on the context, are presented at
- household level
- family or benefit unit level
- individual level
Household level definition
One person living alone, or a group of people (not necessarily related) living at the same address, who share cooking facilities and share a living room, sitting room or dining area. A household will consist of one or more families and benefit units.
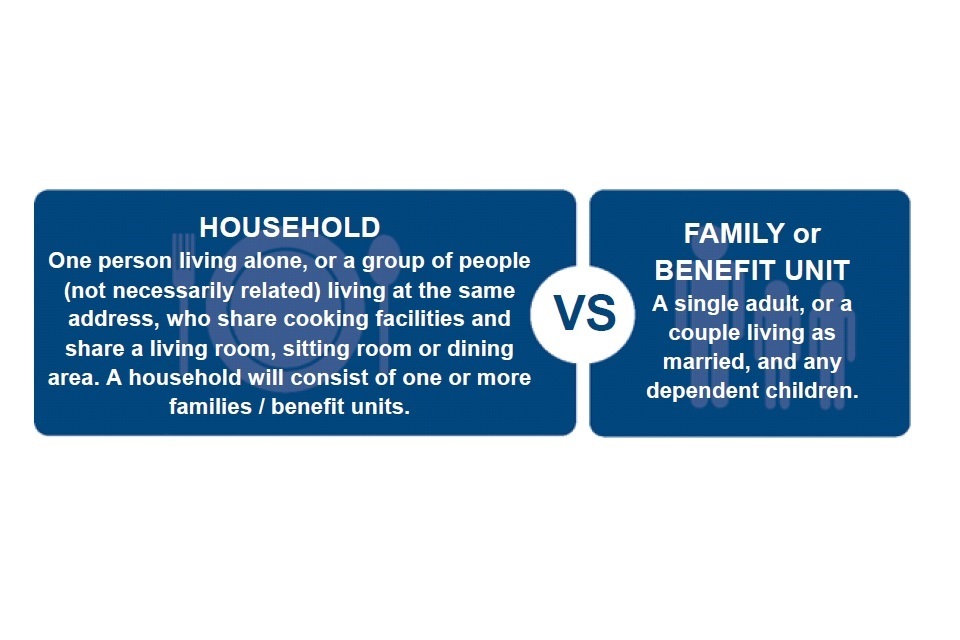
Family or benefit unit level definition
A single adult, or a couple living as married, and any dependent children.
Household Food security definition
Household Food Security is a measure of whether households have sufficient food to facilitate an active and healthy lifestyle.
Households with high or marginal food security are “food secure”. Food secure households are considered to have sufficient, varied food to facilitate an active and healthy lifestyle. Conversely, low and very low food security households are considered to be “food insecure”. Food insecure households have a risk of, or lack of access to, sufficient, varied food.
| Household food security score | Household food security status | Food security classification |
|---|---|---|
| 0 | High | Food secure |
| 1-2 | Marginal | Food secure |
| 3-5 | Low | Food insecure |
| 6-10 | Very low | Food insecure |
Additional tables and data
A comprehensive set of detailed tables complementing the results presented are available alongside this publication.
These tables are referenced throughout this report.
An anonymised version of the FRS dataset is available to download via the UK Data Archive.
3. Income and state support
Families (benefit units) by income received from state support, 2019 to 2020, United Kingdom
The percentage of families receiving state support has fallen to 50%.
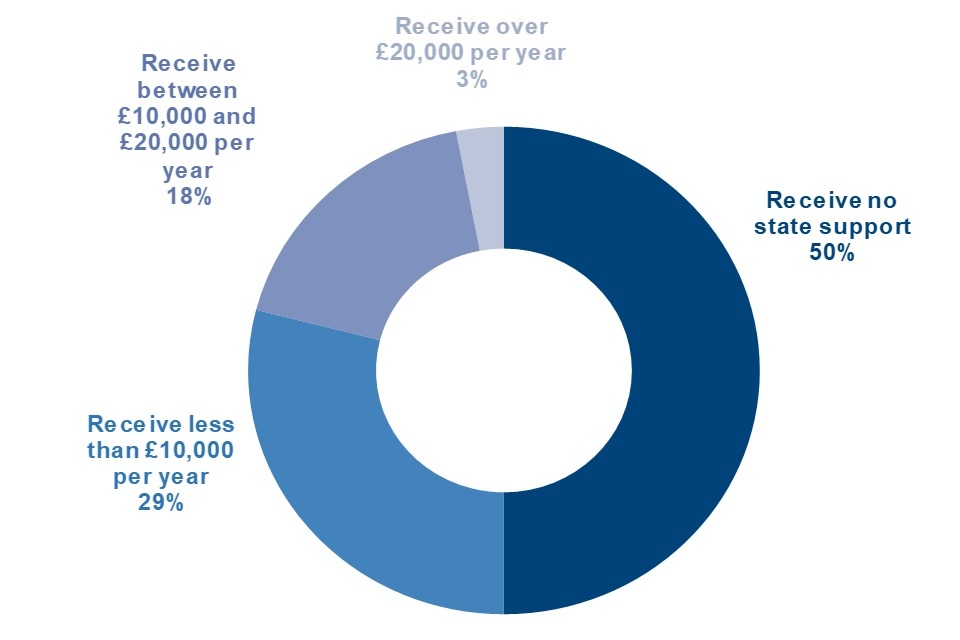
The long-term trend is that a smaller proportion of UK families received state support in 2019 to 2020, than in previous years. State support refers to state benefits or tax credits, and includes Child Benefit. The percentage of families receiving any state support decreased from 53% in 2017 to 2018 to 50% in 2019 to 2020. This means that half of families (17.5 million) in the UK received no state support at all in 2019 to 2020.
For 29% of families (10.2 million), state support was less than £10,000 annually. Eighteen per cent (6.2 million) of families received between £10,000 and £20,000 and three per cent (1.3 million) of families received more than £20,000 a year in state support, both of which are a one per cent decrease from the previous year.
See table 2.14 for full data.
Sources of total gross household income, FYE 2010 to FYE 2020, United Kingdom
Income from Employment forms a slightly higher proportion of total income than in recent years.
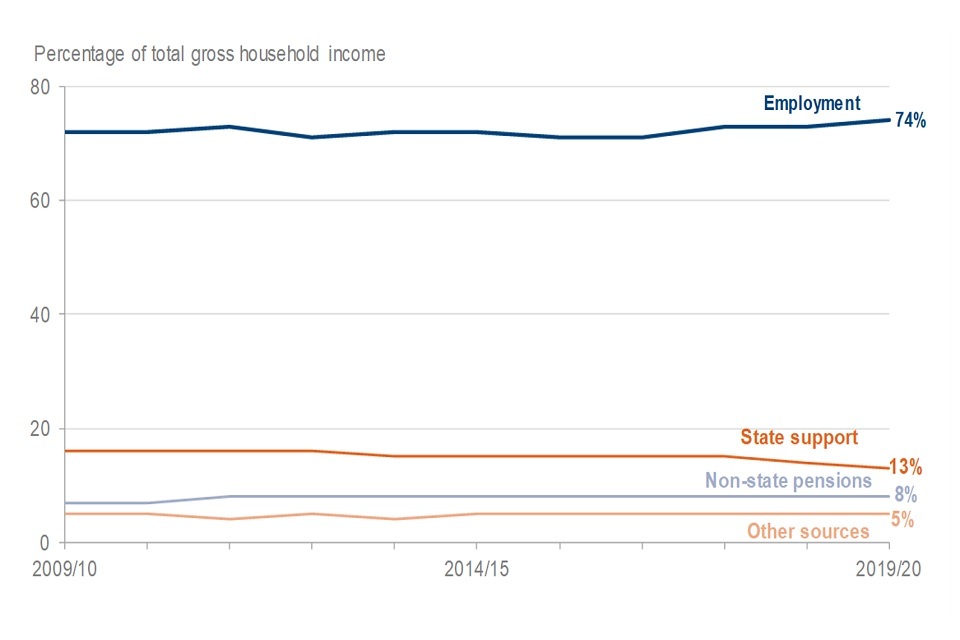
The share of UK gross household income which comes from employment (wages, salaries and self-employment) was 74% in 2019 to 2020. This is one percentage point higher than in 2018 to 2019 and is also higher than the share in the nine-year period from FYE 2010 to FYE 2018, which varied between 71% and 73%.
Thirteen per cent of gross household income came from state support (benefits), including the State Pension and tax credits. This is the lowest of any year since 2009 to 2010. Eight per cent came from non-state pensions, including workplace and private pensions. Five per cent of gross household income came from other sources, including investments, rents received, grants and allowances. See table 2.1 for full data
Percentage of total gross household income from earnings by region, 2019 to 2020, United Kingdom
London had a higher percentage of income from employment than other regions.
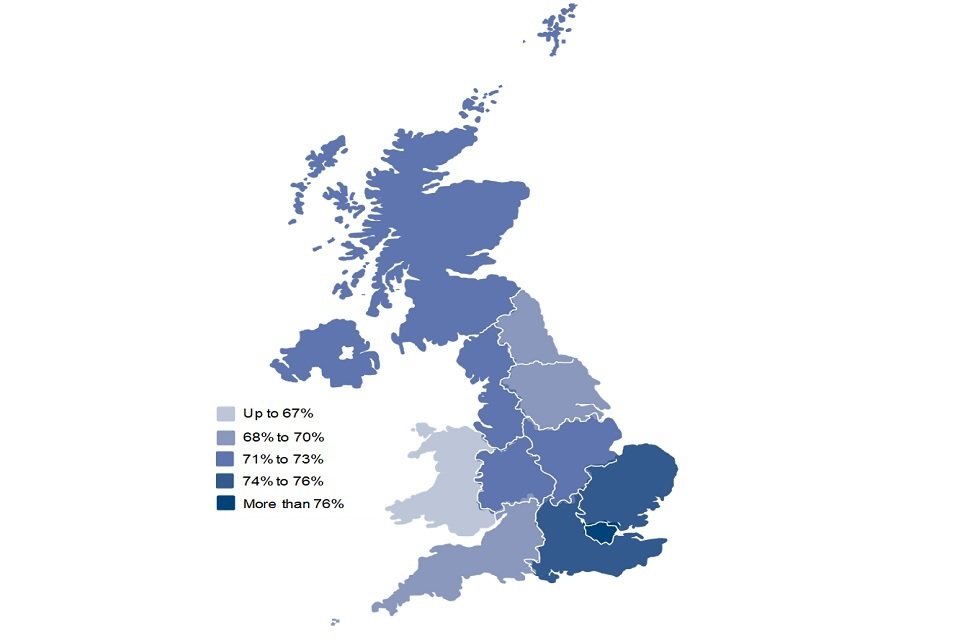
Whilst nationally, 74% of gross household income came from employment, there was considerable variation between regions. London had the highest share (83%) and Wales the lowest (66%). These regional differences are likely to be associated with the demographic and economic variations between regions.
In contrast, Wales and the South West had the highest proportion of income from pensions (non-state pensions) at 11%, whereas in London this proportion was four per cent. Other income, from sources other than employment, also differed by region. Northern Ireland, the North East and Wales all had the highest percentage of income from state support at 18%; London had the lowest (eight per cent).
See table 2.2 for full data
Receipt of state support by age of head of family, 2019 to 2020, United Kingdom
The percentage of families receiving state support varied by age and type of benefit.
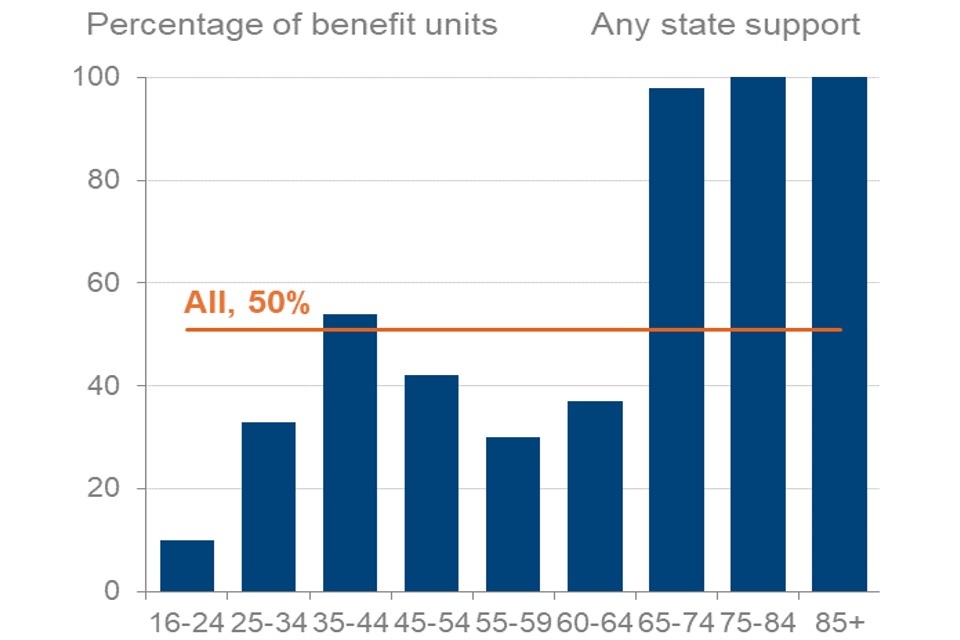
Among the working-age population, the age group most likely to receive state support (with 54%) is the group where the head of the family is aged 35-44 years. This is mainly because of the high proportion receiving Child Benefit. Among the population aged over state pension age, nearly every family received some form of state support, with the vast majority receiving State Pension.
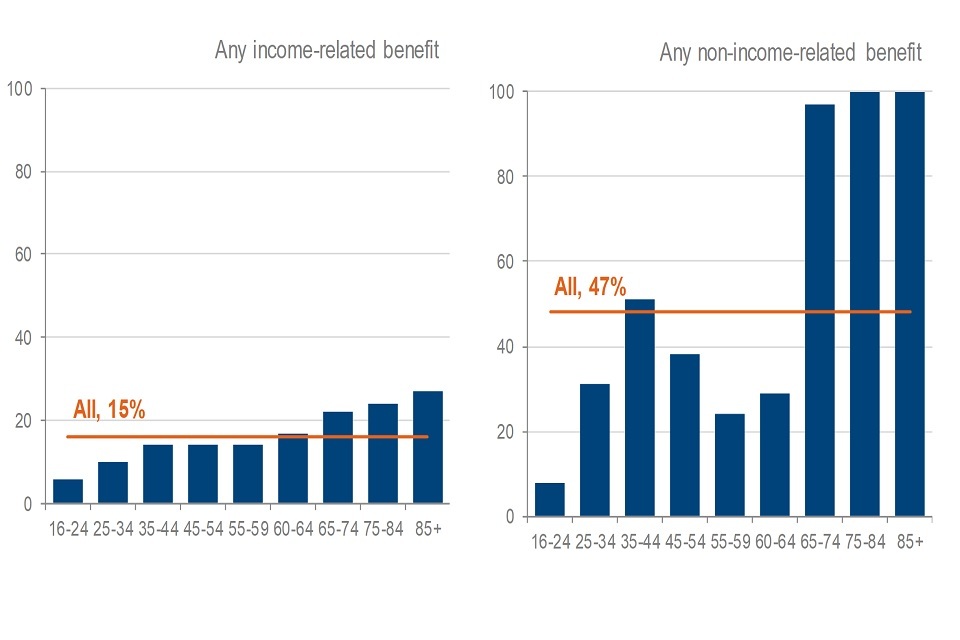
The percentage of families receiving an income-related benefit (such as Universal Credit or Pension Credit) increases with the age of the head of family overall, from six per cent where the head was aged 16 to 24 years, to 27% where the head was aged 85 years or older. However, this does plateau at 14% between the ages of 35 and 59 years.
See table 2.11 for full data
4. Tenure
Households by tenure, FYE 2010 to FYE 2020, United Kingdom
The percentage of households owning their property outright has increased gradually over the past decade.
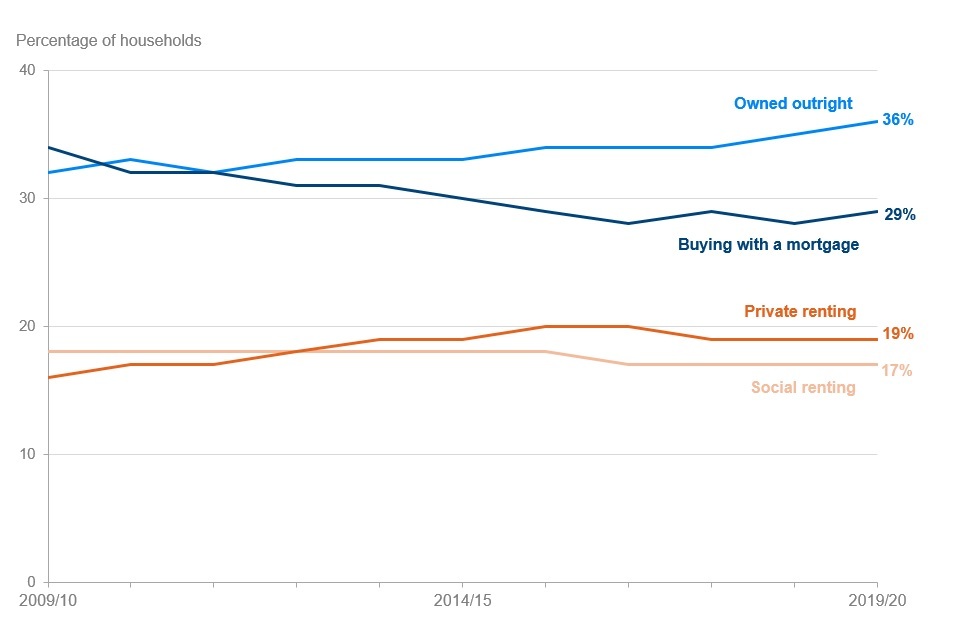
The long-term trend towards outright ownership has continued. Nationally, the proportion of households owning their home outright increased from 32% in 2009 to 2010 to 36% in 2019 to 2020. In contrast, the number of households with a mortgage has decreased from 34% to 29% over the same period. The proportion of households renting has increased slightly, from 34% in 2009 to 2010 to 36% in 2019 to 2020.
See table 3.6 for full data.
Housing costs have increased slightly from last year and sizeable regional variations remain
In general, housing costs have increased only marginally year on year, so the long-term differences in cost by region have continued: Whether renting or buying with a mortgage, the highest housing costs were reported in London, followed by the South East, the East and the South West. This is the same order as in recent years.
Median household weekly mortgage payment by region, 2019 to 2020, United Kingdom
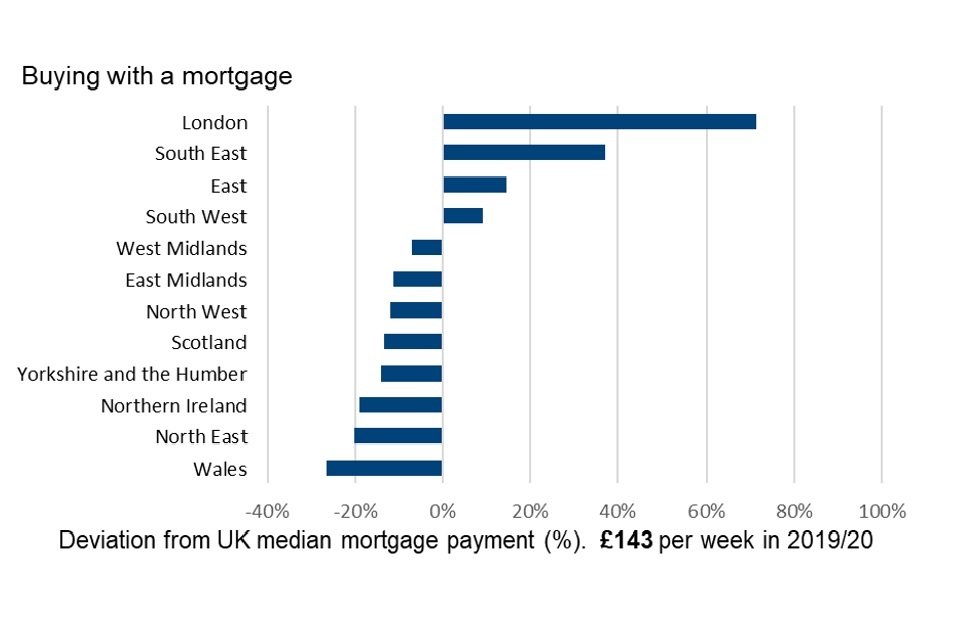
Instalments on repayment mortgages vary widely across the country. The median repayment in London was £245 per week, which is £102 greater than the national median of £143 per week. This is not only a higher repayment than last year, but also greater distance from the national median than in 2018 to 2019. In contrast, the regions with the lowest median repayment were Wales (£105 per week), the North East (£114 per week) and Northern Ireland (£116 per week).
Median household weekly social rent payment by region, 2019 to 2020, United Kingdom
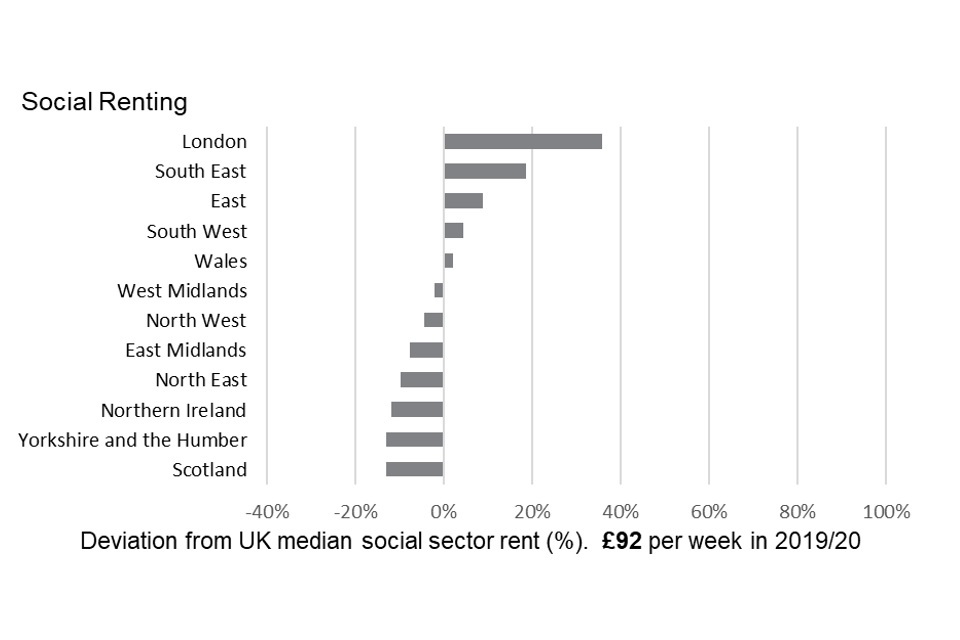
The social rented sector is accommodation which is either local authority (council) housing or is owned by a housing association. In every region, the median rent in the social rented sector is lower than that of the private sector.
Social sector rents were lowest in Scotland, and Yorkshire and the Humber (at £80 per week, some £12 below the national median). In contrast, London had the highest median rent, at £125 per week, some £33 more than the national median. With the exception of the South East and London, the other regions were within £12 per week of the median for the United Kingdom as a whole.
Median household weekly private rent payment by region, 2019 to 2020, United Kingdom
Private sector rents have grown by a few pounds per week from 2018 to 2019.
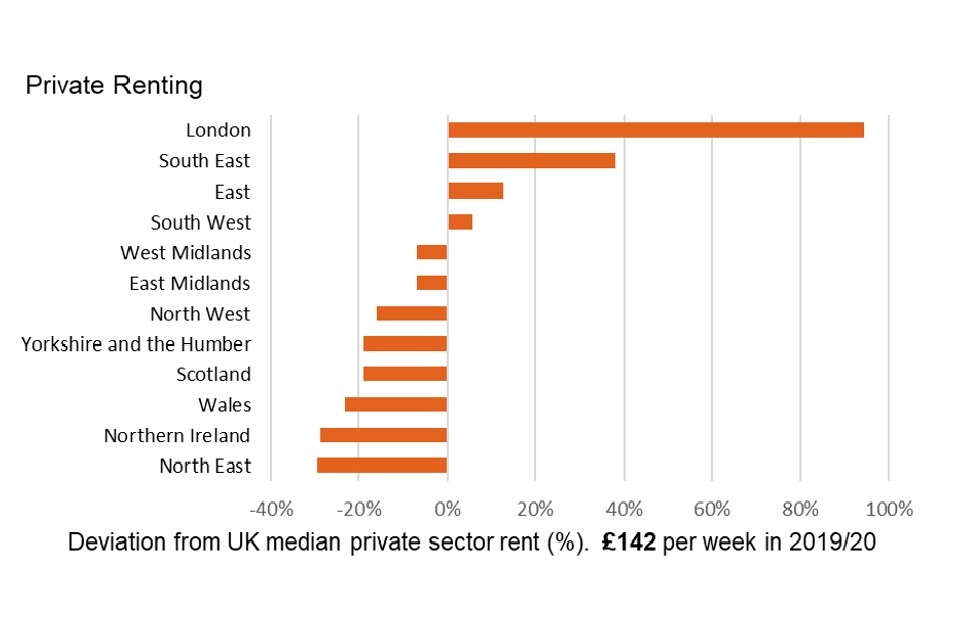
Private sector rents were significantly higher in London compared with all other regions of the United Kingdom. London’s median private sector rent (£276 per week) was more than double the figure for most other regions. The lowest median rents were seen in the North East (£100 per week) and Northern Ireland (£101 per week).
This difference between private and social sector rent levels is partly because rents in the social sector are controlled by Government-set formulae. Differences may also reflect variation in the type of properties in either sector, with the private rented sector having a more varied range of housing stock.
See Table 3.8 for full data.
Tenure type by age of head of household, FYE 2010 and FYE 2020, United Kingdom
Several age groups have seen a shift towards private sector renting, and away from other types of tenure.
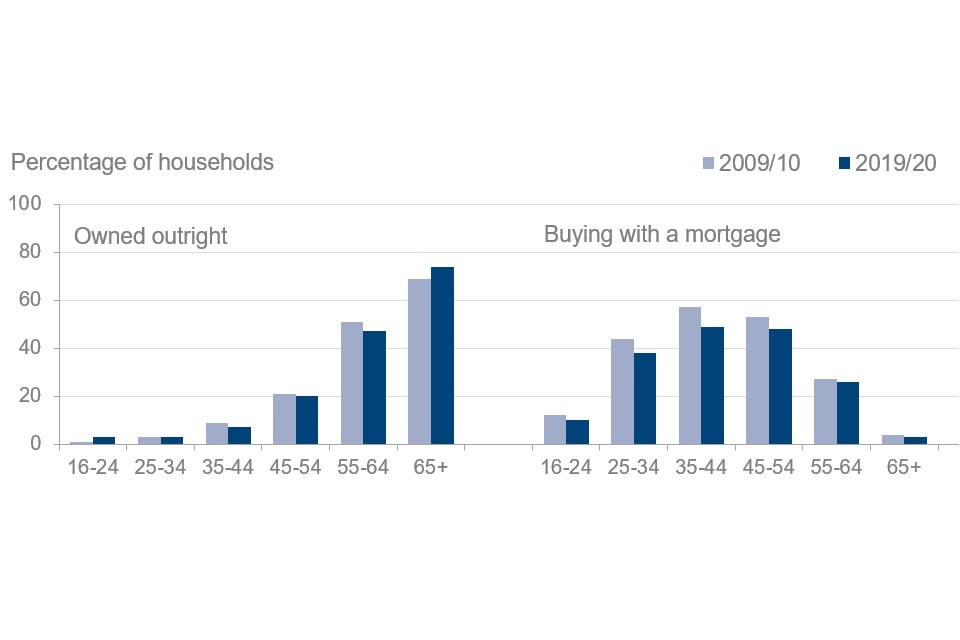
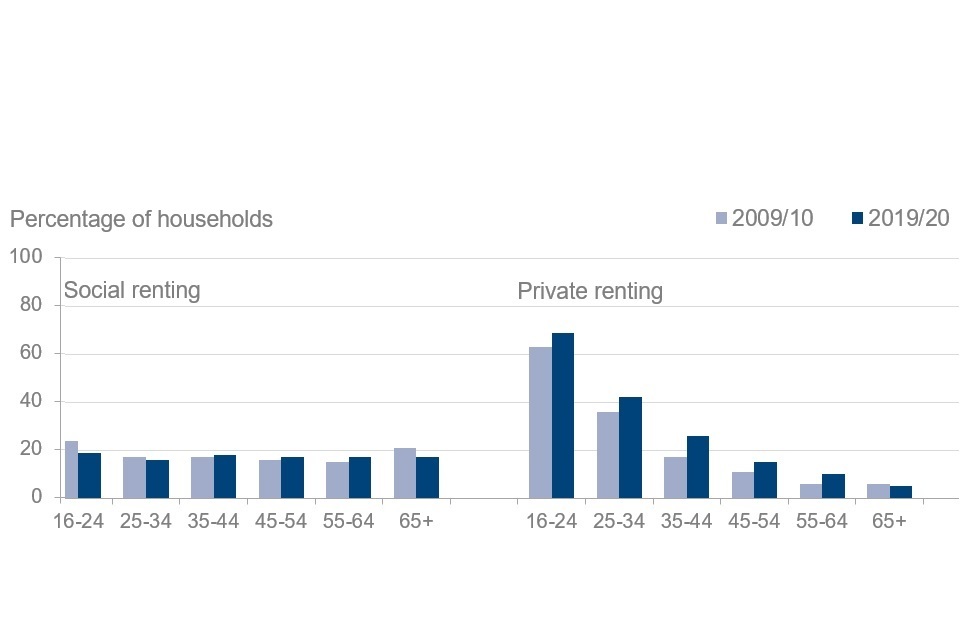
For younger age groups, the decade between 2009 to 2010 and 2019 to 2020 has seen a shift away from home ownership with a mortgage, and towards private sector renting. Households headed by those aged 35-44 years have seen the largest increase of any age group, with 26% renting private accommodation in 2019 to 2020, versus 17% a decade ago. For households headed by an under 25 year-old, the figures were 69% in 2019 to 2020 versus 63% in 2009 to 2010; and a similar increase in private renting has occurred among those aged 25-34 years (increasing from 36% to 42% over the decade).
The increase in private renting at younger ages is matched in part by a smaller proportion who bought their property with a mortgage. However, there has also been a notable decrease in social renting among younger adults. For those aged under 25 years, the proportion in social rented accommodation has decreased by around a fifth over the past decade, from 24% in 2009 to 2010 to 19% in 2019 to 2020.
See Table 3.7 for full data.
Households by tenure and state support receipt, 2019 to 2020, United Kingdom
Renters in the social sector are much more likely to receive income-related benefits.
Nationally, 18% of households are in receipt of an income-related benefit. This is the figure across households of all ages, including adults old enough to receive Pension Credit.
However, in the social rented sector, 60% of households were in receipt of an income-related benefit (though this is a reduction on the 2018 to 2019 figure of 62%). This is still more than three times the average across all types of tenure.
A large proportion of such households (45%) received Housing Benefit. A minority (15%) received Universal Credit, more than double the seven per cent receiving the benefit in 2018 to 2019. This increase reflects the completion of Universal Credit rollout for new claims before the start of the 2019 to 2020 survey year.
See Table 3.5 for full data.
5. Disability
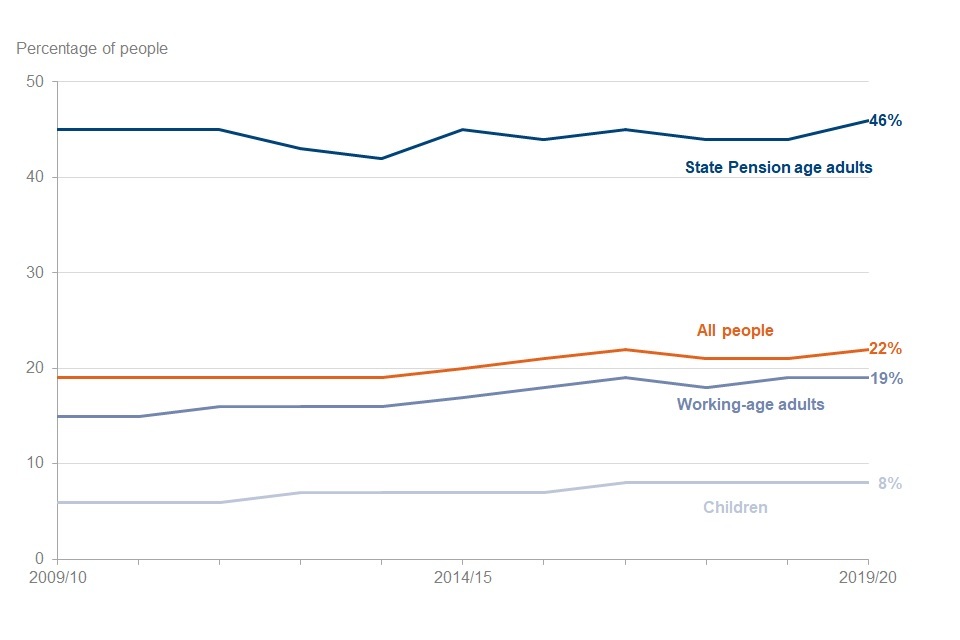
Disability prevalence by age group, FYE 2010 to FYE 2020, United Kingdom
One in five people reported a disability.
A person is considered to have a disability if they have a physical or mental impairment that has ‘substantial’ and ‘long term’ negative effects on their ability to do normal daily activities. This is the core definition of disability in the Equality Act 2010.
In 2019 to 2020, 14.1 million people reported a disability, an increase of 2.7 million since 2009 to 2010, where disability was reported by 11.4 million people. The percentage of people who reported a disability in 2019 to 2020 has increased to 22% since 2009 to 2010, when the percentage of people who reported a disability was 19%, a change of three per cent over the period.
- The main drivers of this change were increases in the percentage of working-age adults (15% to 19%) and children (six to eight per cent) reporting a disability
- For those of State Pension age, the percentage reporting a disability has been between 44% and 46% in every year of the past decade
- For working-age adults, the percentage reporting a disability has not changed from 2018 to 2019 to 2019 to 2020, having remained at 19%. The percentage of children reporting a disability also remained stable at eight per cent over that two-year period
See the Background Information and Methodology section for more details.
See Tables 4.1 and 4.2 for full data.
Disability prevalence by gender, FYE 2010 to FYE 2020, United Kingdom
The proportion of females reporting a disability increased.
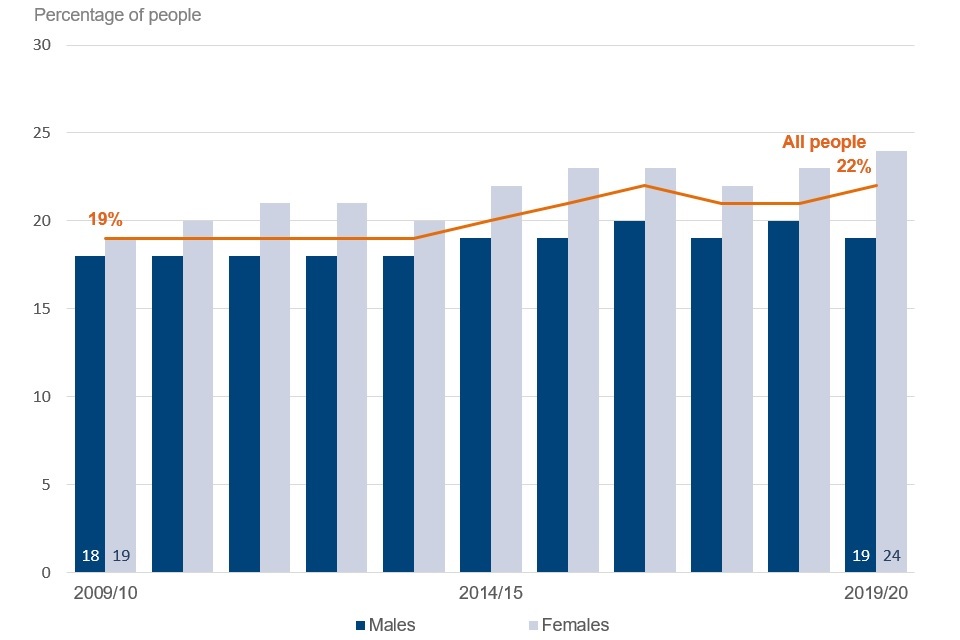
Twenty-four per cent of females (7.8 million) reported a disability in 2019 to 2020, an increase from 19% (6.1 million) in 2009 to 2010. In comparison, reporting a disability amongst males increased from 18% (5.3 million) in 2009 to 2010 to 19% (6.3 million) in the most recent survey year.
In recent years, most age groups have seen a higher proportion of females than males reporting that they are disabled. The exception are younger ages (15 years and younger).
See Table 4.2 and 4.3 for full data.
Disability prevalence by region and country, 2019 to 2020, United Kingdom
The percentage of people reporting a disability varied by region.
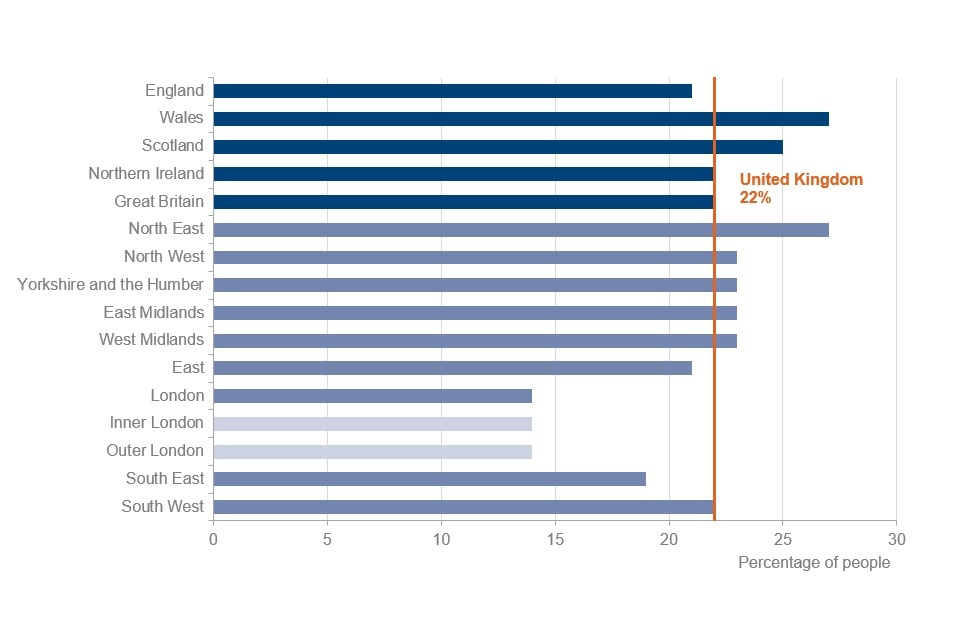
The number of people in the UK, who reported a disability in 2019 to 2020 was 14.1 million. This means that nationally, 22% of people have a disability, however the prevalence of people reporting a disability varied across the UK.
- In Wales, the proportion of people who reported a disability was 27%, five per cent higher than UK national average
- This was also the case in Scotland, with 25% of people reporting a disability, three per cent higher than the UK national average
- Within England, the North East region had the highest proportion of people reporting a disability in 2019 to 2020, with 27%. The regions of North West, Yorkshire and the Humber, East Midlands and West Midlands had one per cent more people reporting a disability than the UK national average, with 23% of people within these regions reporting a disability • London had the lowest proportion of people who reported a disability in the most recent survey year with 14%, followed by the South East with 19%
The differences in disability reporting could be partially explained by the varying demographics in each region. For example, disability prevalence may correlate with the percentage of the population of State Pension age in a particular region, noting that reporting of a disability is more than double amongst this age group, compared to the overall population (see Table 4.1).
See Table 4.4 for full data.
Impairment types reported by disabled people, 2017 to 2018, 2018 to 2019 and 2019 to 2020, United Kingdom
Reporting of mental health impairments increased.
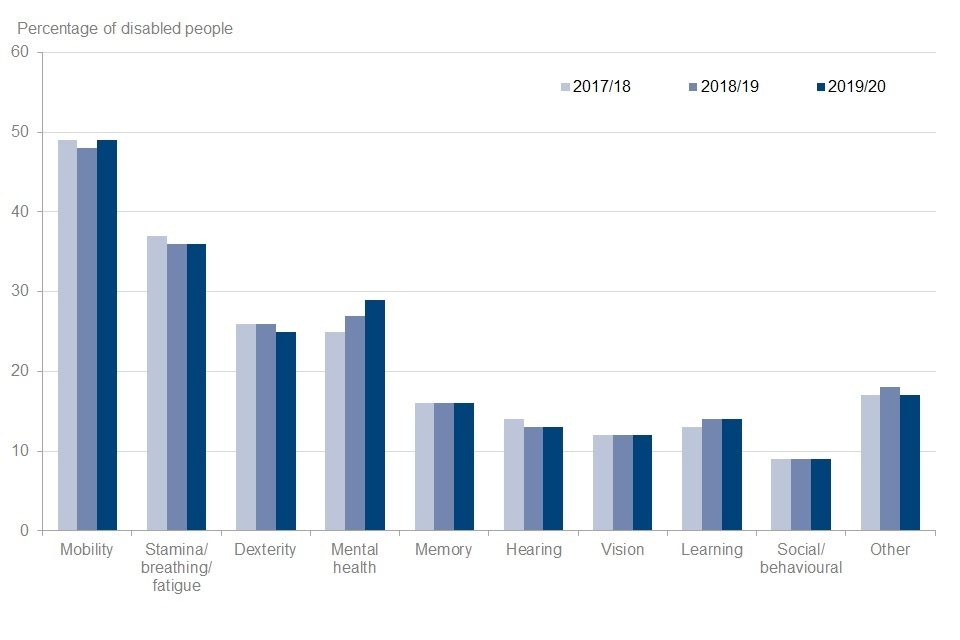
FRS respondents who report a disability are then asked to identify the specific impairments that apply to their circumstances (from a standard list).
Among all the specific impairments, mobility, stamina (or breathing or fatigue), and mental health impairments were the three most reported categories. In 2019 to 2020, a mobility impairment was reported by 7 million people, stamina, breathing or fatigue by 5.1 million and mental health by 4.1 million.
- Over the last three years, mental health is the only category of impairment to have increased. This category has seen a four per cent increase (25% to 29%) since 2017 to 2018. This is equivalent to an increase of 700,000 people (3.4 million to 4.1 million over those three years). This increase of four per cent, puts mental health as the third most prevalent impairment
- Mobility impairments are again the most prevalent category, with 49% of disabled people saying that this applied to them. This figure has been broadly stable over the past three years
- There was no change in the proportion of people reporting all other impairment types
See Table 4.5 for full data.
Impairment types reported by disabled people, by age group, 2019 to 2020, United Kingdom
Impairments reported by disabled people varied by age group.
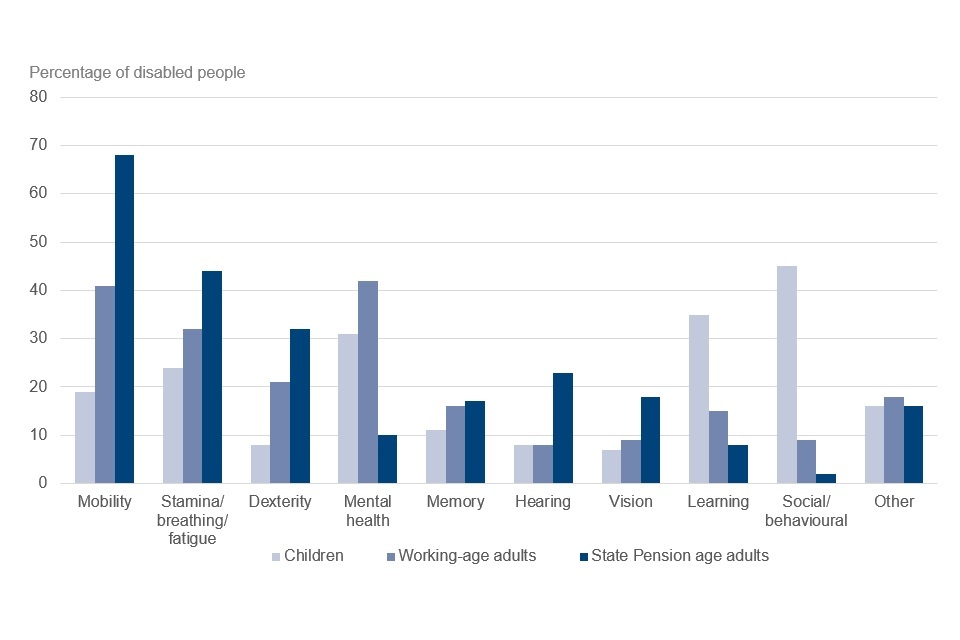
- For working-age adults, 42% reported a mental health impairment. Mobility impairment was the second most likely disability type to be reported by working-age adults, at 41%
- For those of State Pension age, 68% reported a mobility impairment. Stamina, breathing, fatigue were reported by 44% of State Pension age adults and one in ten people reported a mental health impairment
- In children, social or behavioural impairments were the most common category reported, applying to 45% of disabled children. Learning impairment was the second most prevalent for children, with 35%. A mental health impairment was reported for 31% of disabled children, making it the third most prevalent impairment type reported by this age group
See Table 4.5 and 4.6 for full data.
6. Care
Percentage of people providing informal care by age and gender, 2019 to 2020, United Kingdom
Those aged 55 to 64 years are the likeliest to be carers.
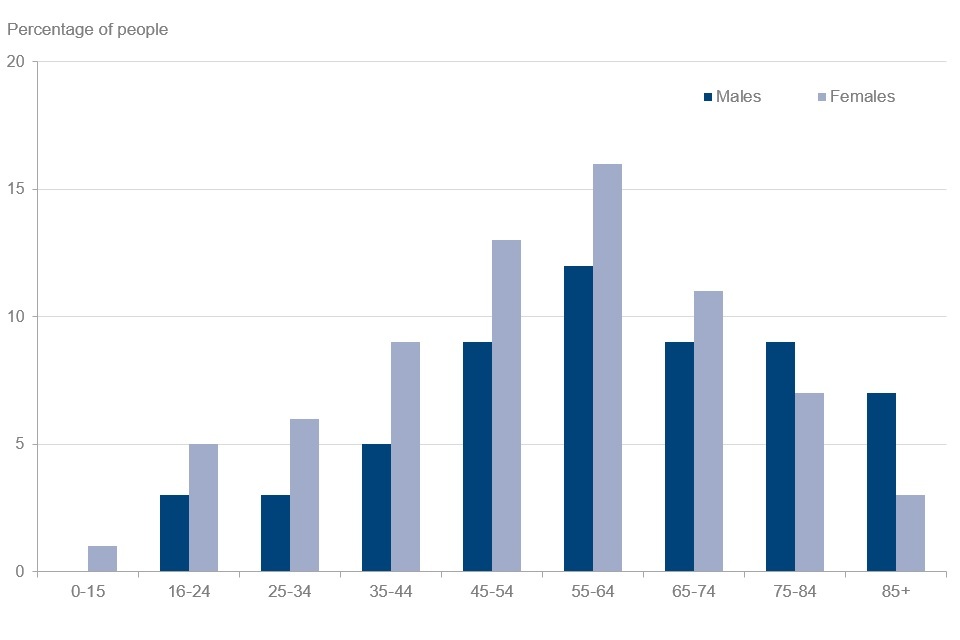
Seven per cent of UK people were informal carers in 2019 to 2020. The number of carers varied by gender. Females were more likely to be informal care providers, with 2.7 million versus 1.8 million males.
- Those aged between 55 and 64 were the largest single group of informal care providers. Individuals in the 45 to 54 and 65 to 74-year old age groups were also more likely to be informal carers than other age groups
- In all age groups, up to the age of 74 years, the proportion of females providing informal care was greater than males. This trend reversed for all age groups over 75 years, where males were more likely to be informal carers
The FRS asks if people are caring for others on an informal basis (that is, where caring is not a paid job; this contrasts with formal care, which comes from paid help, such as the local authority, district nursing or private domestic help). Examples of care include helping with shopping, preparing meals and feeding, and household chores.
See Tables 5.1 and 5.2 for full data.
Percentage of people receiving care by age and gender, 2019 to 2020, United Kingdom
The likelihood of receiving care varies by age and gender.
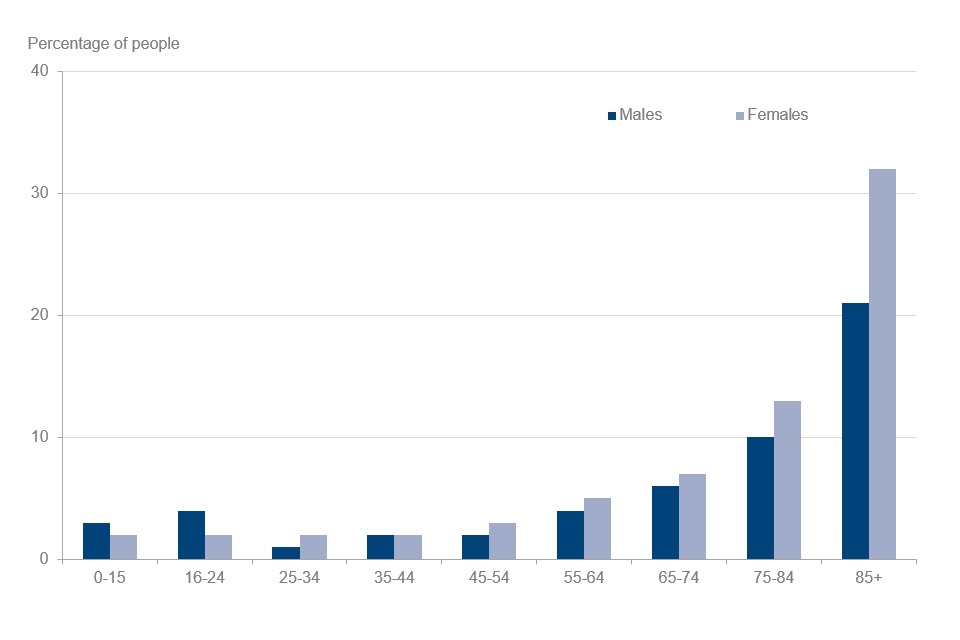
It is rare to be a recipient of informal care if aged below 55: only three per cent or fewer were in receipt of informal care in all of the younger age groups. However, the likelihood of receiving informal care increases with age. In contrast, 28% of people aged 85 and over were care recipients in 2019 to 2020.
In all age groups from 45-54 and above, females were more likely than males to receive informal care. This is most clearly visible in those aged 85 and over, where 32% of women were care recipients in comparison with 21% of men.
See Table 5.8 for full data.
Who informal carers care for, 2019 to 2020, United Kingdom
Family members were the main recipients of informal care.
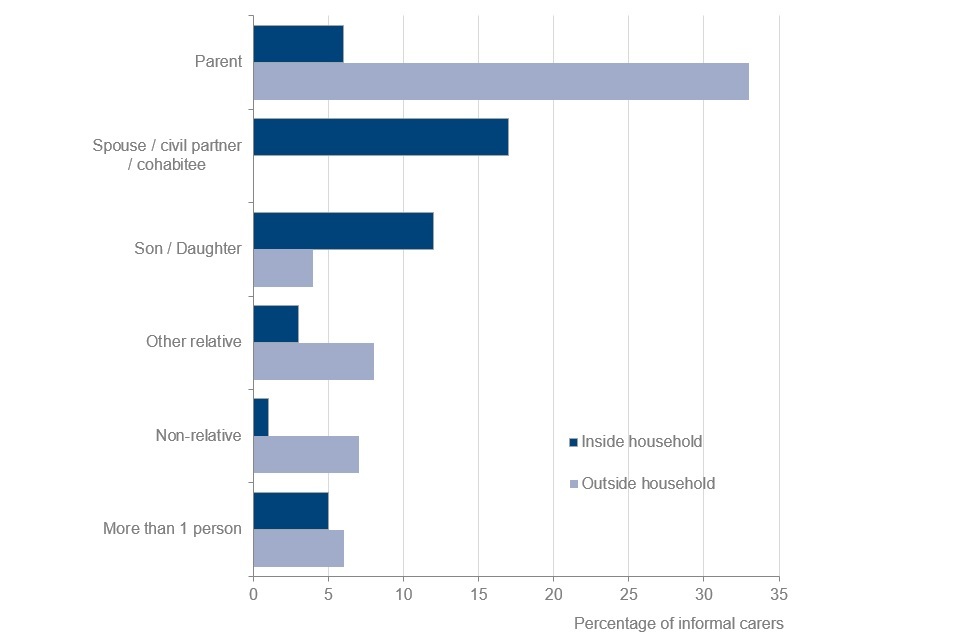
The main recipients of informal care were parents. Of all informal carers, 33% provided care to parents living outside their household, with a further six per cent providing informal care for parents living inside their household.
The main groups that were most likely to be cared for inside the household were spouses, civil partners or cohabitees and sons or daughters. Of all informal carers, 17% provided care inside their household to spouses, civil partners or cohabitees and a further 12% to sons or daughters.
Of all informal carers, 44% provided care for someone living within their household and 58% provided care to someone living outside their household. With eight per cent of informal carers caring for more than one person, both inside and outside their household, the total sums to more than 100%.
See Table 5.7 for full data.
Adult informal carers by economic status and gender, 2019 to 2020, United Kingdom
One third of adult informal carers were also in full-time employment.
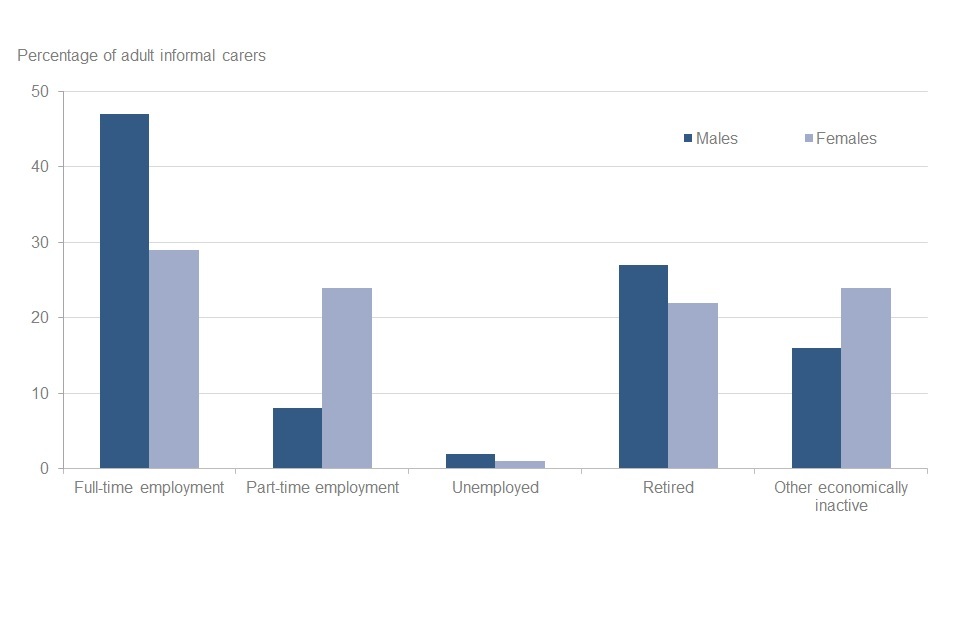
Of all informal carers, 53% were in employment with 36% working full-time. Men were more likely to work full-time and provide informal care than women. The proportion of male informal carers that were also working full-time was 47% in comparison with 29% for women. Female informal carers were more likely to work part-time, with 24% of women in comparison to eight per cent of men.
Of all informal carers, 24% were retired. The proportion of economically inactive informal carers in the most recent survey year, was 21%. Economically inactive status includes those who are students, those looking after a family or home, those permanently or temporarily sick or disabled and those inactive due to other reasons. Those unemployed (that is, seeking work) formed a very small minority of all adult informal carers, at only two per cent.
See Table 5.4 for full data.
Adult informal carers by gender and hours of care provided per week, 2019 to 2020, United Kingdom
More than half of informal carers provide care for up to 19 hours per week.
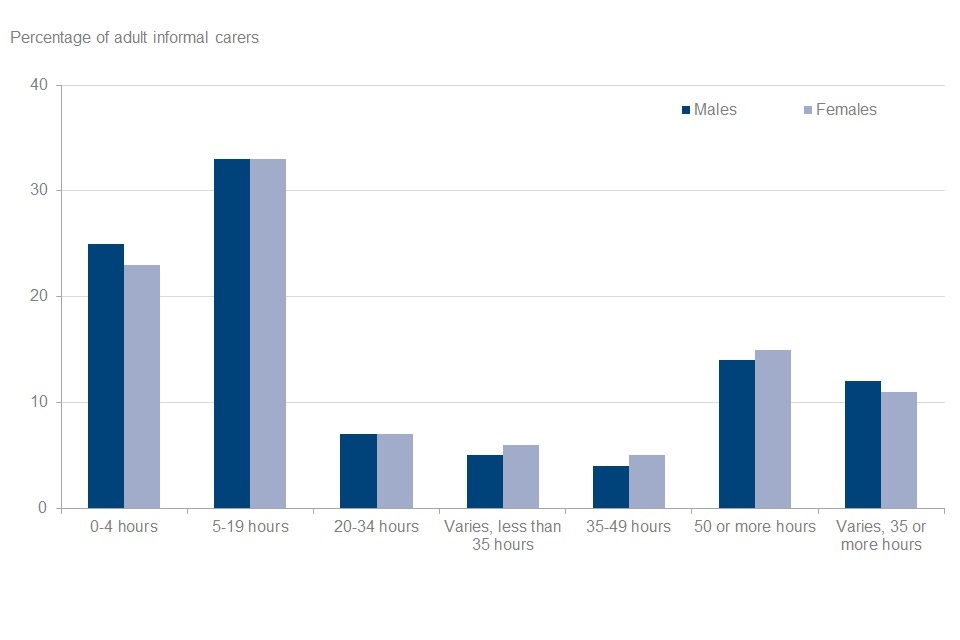
Of all adult informal carers, over half (57%) provided care for 19 hours per week or less. Adult informal carers providing care for 5-19 hours per week were the largest group with 33% of people. Informal care of over 50 hours per week was provided by 15% of adult carers and 31% reported providing informal care for more than 35 hours per week. The hours of care provided by male and female informal carers were similar.
See Table 5.3 for full data.
People receiving care at least once a week, by frequency of care, 2019 to 2020, United Kingdom
Forty per cent of those receiving care every week are receiving continuous help.
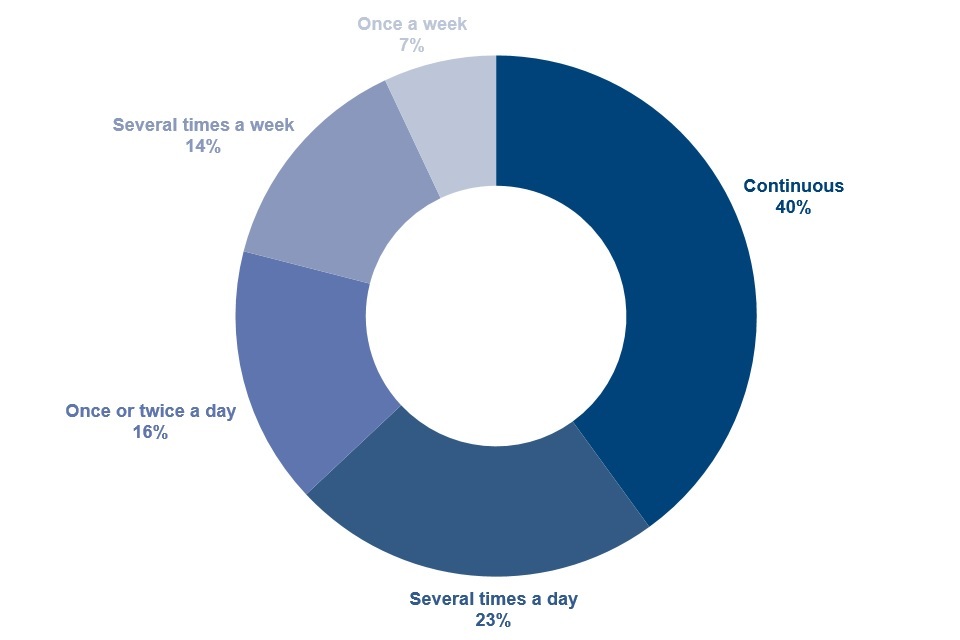
Of those receiving informal care at least once a week, 40% received continuous care. An additional 39% of people received care at least once per day and a further 21% of people were cared for either several times, or just once per week.
There was a strong relationship between the frequency of care received and the age of the recipient. Children up to the age of 15 were more likely to receive continuous care than any other age group. The proportion of this age group receiving continuous care was 70%. For those in the 16-24 age group, the proportion of continuous care recipients was over a half (53%).
Of all informal care recipient groups, those aged 85 and over were least likely to receive continuous care, with 26%, but most likely to receive care several times a day, with 28%.
Note that the Family Resources Survey is designed to be representative of all private households in the United Kingdom. Therefore, some individuals, such as those in care homes, are not included.
See Table 5.9 for full data.
7. Pension participation
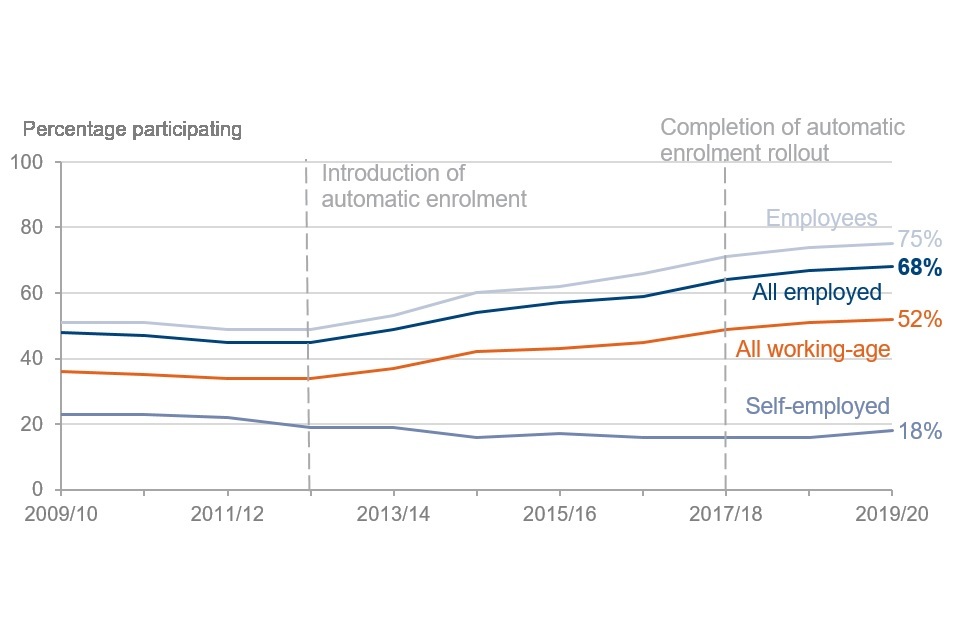
Pension scheme participation of working-age adults by employment status, FYE 2010 to FYE 2020, United Kingdom
Pension scheme participation increased substantially, following the introduction of automatic enrolment for employees in 2012.
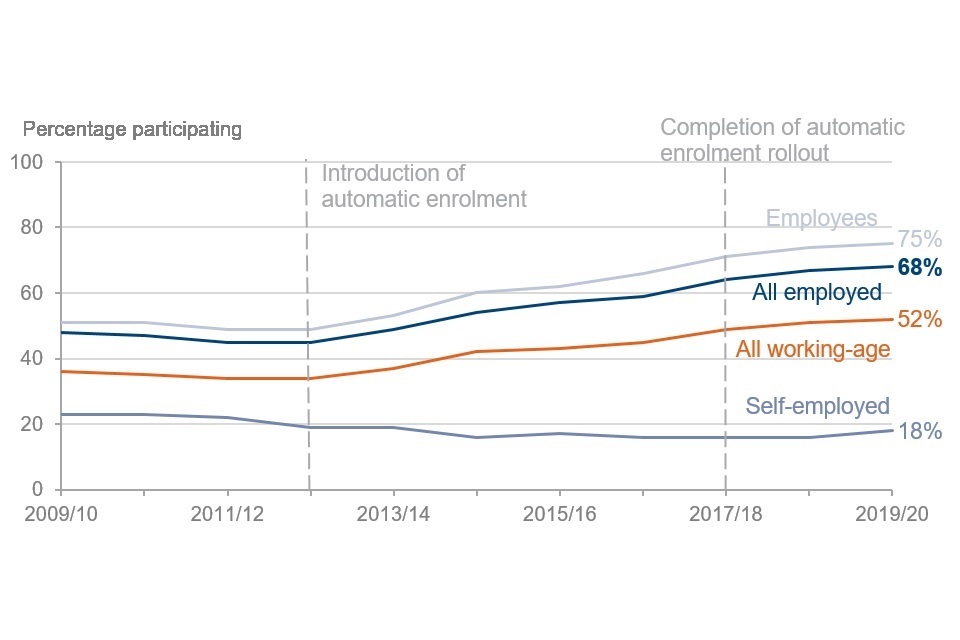
For working-age employees, the rollout of automatic enrolment has produced a very substantial increase in pension scheme participation in the workplace. Automatic enrolment began in October 2012 and had completed its nationwide rollout by February 2018, before the start of this survey year.
In the two years prior to automatic enrolment pension scheme participation for working-age employees was between 49% and 51%. Scheme participation has increased in every year since automatic enrolment began, rising from 49% in FYE 2013 to 71% in FYE 2018. It has continued to increase in the last two years, to 75% of employees in FYE 2020.
This also means that, of working-age adults generally, over half are now participating in a pension scheme. Age eligibility for automatic enrolment is from 22 years to State Pension age, so the numbers of people aged 16 to 21 years are likely to have lower levels of pension participation than older age groups.
The self-employed are also not eligible for automatic enrolment. Their participation rates fell from 19% in FYE 2013 to 16% in FYE 2015, remaining relatively stable until the last year, when they increased to 18%.
See Table 6.5 for full data.
Pension scheme participation for working-age adults by pension type and gender, financial year 2019 to 2020, United Kingdom
Pension participation rates were lower for women than men.
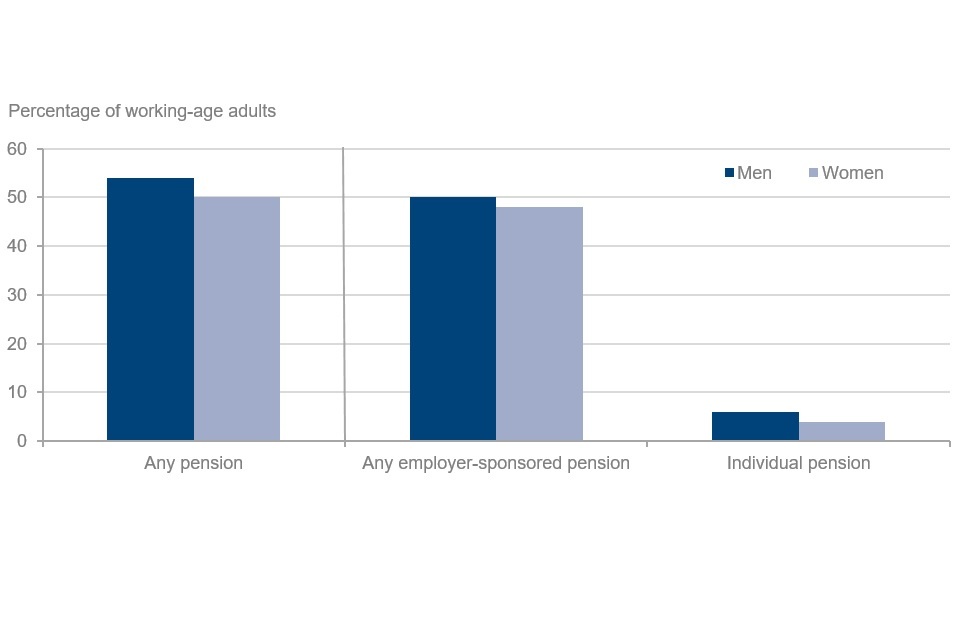
The overall pension scheme participation rate was slightly lower for working-age women than working-age men in 2019 to 2020.
- Fifty-four per cent of all working-age men were contributing to a pension compared to 50% of working-age women
- Participation rates in employer-sponsored schemes were slightly higher for working-age men (50%) than for women (48%)
- Participation in individual pension schemes (personal pensions, including stakeholder schemes) was lower for working-age women (four per cent) compared with working-age men (six per cent)
Some individuals participated in both types of scheme.
See Table 6.1 for full data.
8. Savings and Investment
Overall, half of all families had savings of more than £1,500, with a fifth having savings of more than £20,000. The level of saving increased with age, and nearly half of pensioner couples had savings exceeding £20,000.
However, it is also the case that half of all families had either no savings, or less than £1,500 in savings.
Lone parent families were substantially more likely to have savings at this lower level than other types of family; 84% of those who were single parents, reported savings of either zero or less than £1,500.
It was also the case that singles living alone (of working age) had lower levels of saving than average, with 70% of men and 69% of women having either zero or less than £1,500 saved.
See table 7.10 for full data.
When asked, almost all respondents said that they had a current account, or basic bank account. Respondents also reported a wide variety of other financial assets. Men were somewhat more likely than women to have shares (stocks and shares, or Unit Trusts).
A minority of respondents said they had Premium Bonds, with ownership more common at older ages. For those aged under 35, roughly 1 in 25 adults said that they had Premium Bonds, but this rose to 1 in 4 of those aged 65+.
See table 7.7 for full data.
9. Self Employment
Median net earnings of working-age employees and the self-employed, by part-time and full-time, FYE 2010 to FYE 2020, United Kingdom (2019 to 2020 prices)
Net earnings for the full-time self-employed were 15% lower than those of full-time employees; the smallest difference in the last ten years.
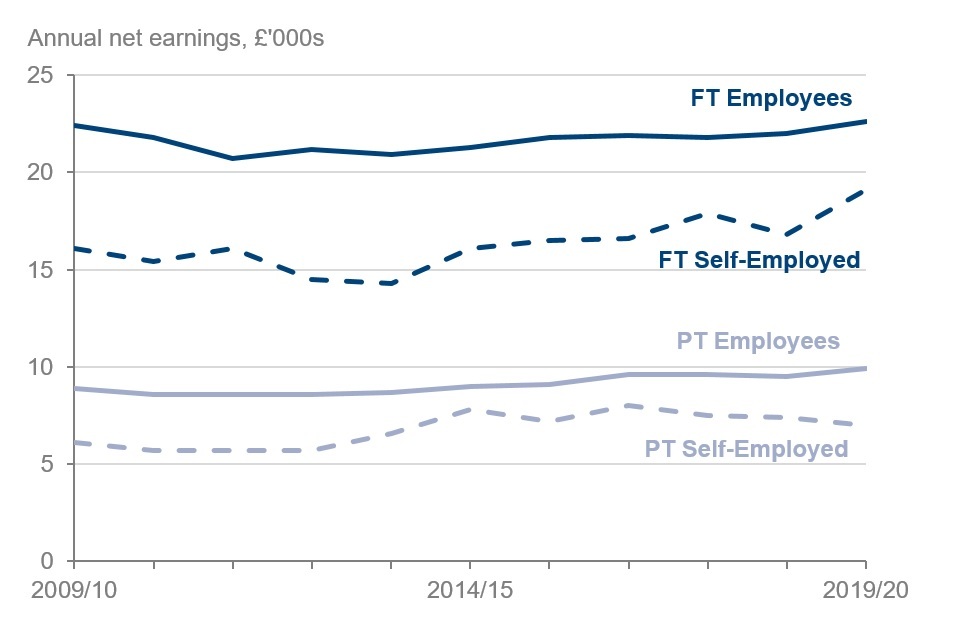
Among those working full time, earnings of the self-employed have grown at a faster rate than employees in recent years. However, after tax and National Insurance, self-employed earnings remained below those of employees. In 2019 to 2020, and for those of working age, the median net earnings of the full-time self-employed (£19,100), were around 15% lower than those of full-time employees (£22,600). This is the smallest difference in the last ten years, in which self-employed earnings have consistently been below those of employees.
For the part-time self-employed and in real terms median net earnings were at their lowest since 2013 to 2014, and remained below those of part-time employees. For part-time employees these were £9,900 in 2019 to 2020, 41% higher than the median of the part-time self-employed (£7,000).
See Table 8.2 for full data.
Median net earnings of the self-employed by gender and by part-time and full-time, FYE 2010 to FYE 2020, United Kingdom (2019 to 2020 prices)
Self-employed men have higher net earnings, but the difference is smaller for the part-time self-employed.
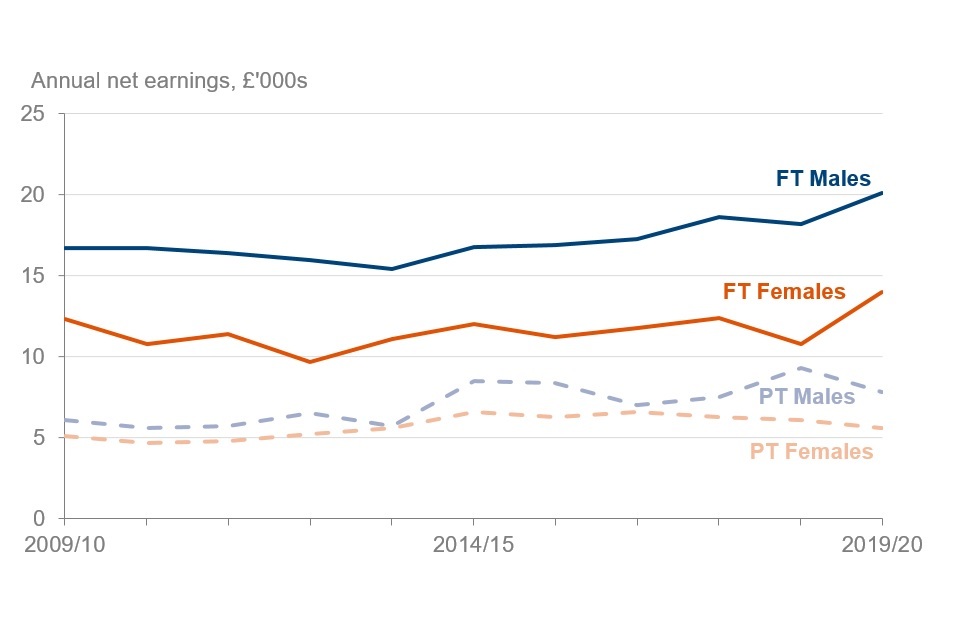
Median net earnings for self-employed men have remained consistently higher than those of women over time, however the difference is smaller for part-timers in most years. For men who worked full-time, median net earnings were £20,100, higher than the £14,000 of full-time women. For men who worked part-time, the median net earnings were £7,800 compared to £5,600 for women who worked part-time.
See Table 8.5 for full data.
Percentage of self-employed working full-time and part-time by gender 2019 to 2020, United Kingdom
Self-employed men are much more likely to be working full-time than self-employed women.
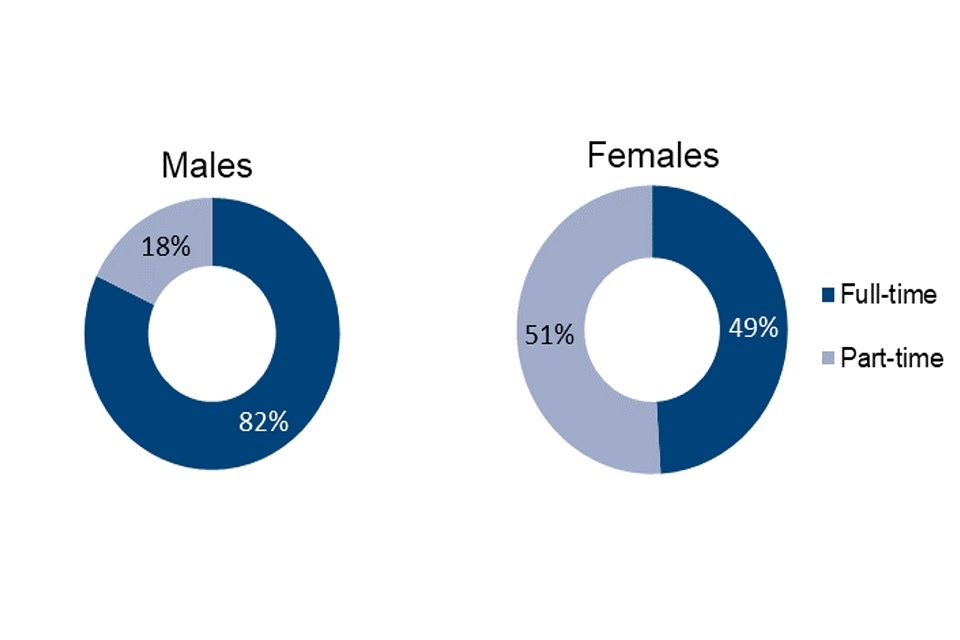
Five out of six self-employed men were working full-time, but for women, the division between full and part-time was nearly half and half.
Percentage of self-employed working full-time and part-time by age group, 2019 to 2020, United Kingdom
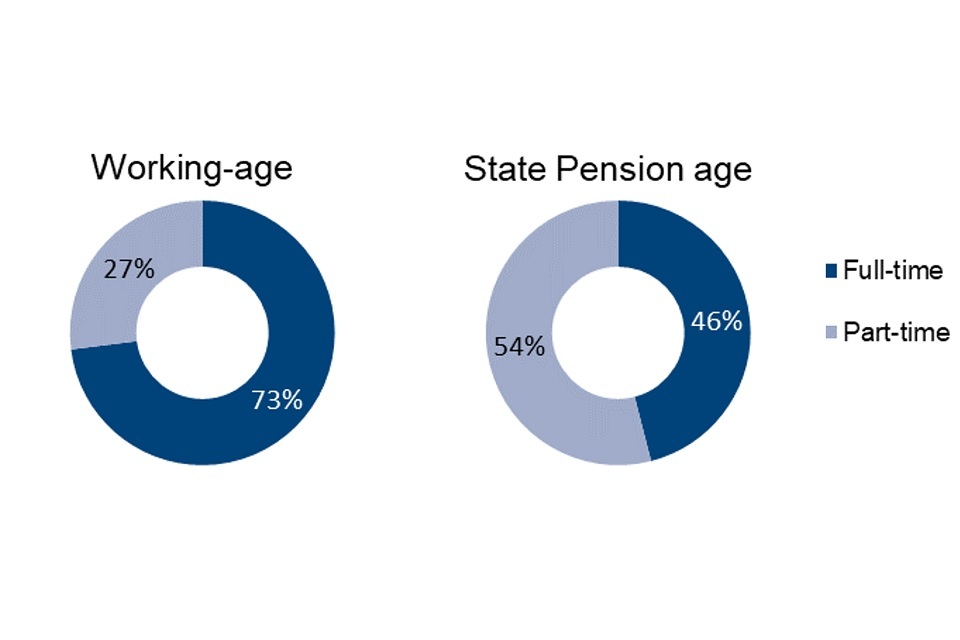
Seventy-three per cent of working-age self-employed people were working full-time, compared to 46% of self-employed workers who were over State Pension age.
See Table 8.1 for full data.
10. Household Food Security
Introduction
Since April 2019, the FRS has asked questions on household food security. This measures whether households have sufficient food to facilitate an active and healthy lifestyle. Questions are asked of the person in the household who knows the most about buying and preparing food. In common with the rest of the FRS, the focus is on the period immediately before the interview (30 days).
The questions are comparable to those used by other public bodies in the UK, and also internationally. Further information on the approach is available in the Background Information and Methodology.
From the questions, a ten-point household score is generated, and the household is placed into one of four categories of household food security status:
- High food security (score = 0): The household has no problem, or anxiety about, consistently accessing adequate food
- Marginal food security (score = 1 or 2): The household had problems at times, or anxiety about, accessing adequate food, but the quality, variety, and quantity of their food intake were not substantially reduced
- Low food security (score = 3 to 5): The household reduced the quality, variety, and desirability of their diets, but the quantity of food intake and normal eating patterns were not substantially disrupted
- Very low food security (score = 6 to 10): At times during the last 30 days, eating patterns of one or more household members were disrupted and food intake reduced because the household lacked money and other resources for food
Households with high or marginal food security are “food secure”. Food secure households are considered to have sufficient, varied food to facilitate an active and healthy lifestyle. Households with low or very low food security are “food insecure”. Food insecure households have a risk of, or lack of access to, sufficient, varied food.
These statistics should be treated with caution when interpreting them:
- Where a household is food insecure, information about the individual experiences of food insecurity within the household is not available. A young child’s experience in a food insecure household may be very different from their parent’s, for example
- These statistics do not directly measure hunger. They instead explore the financial situation of households and how that affects their access to food. Only households with very low food security would anticipate substantive disruption to their food intake. For more information, see the Background Information and Methodology section
Household food security status of all households, 2019 to 2020, United Kingdom
Most households in the UK were food secure.
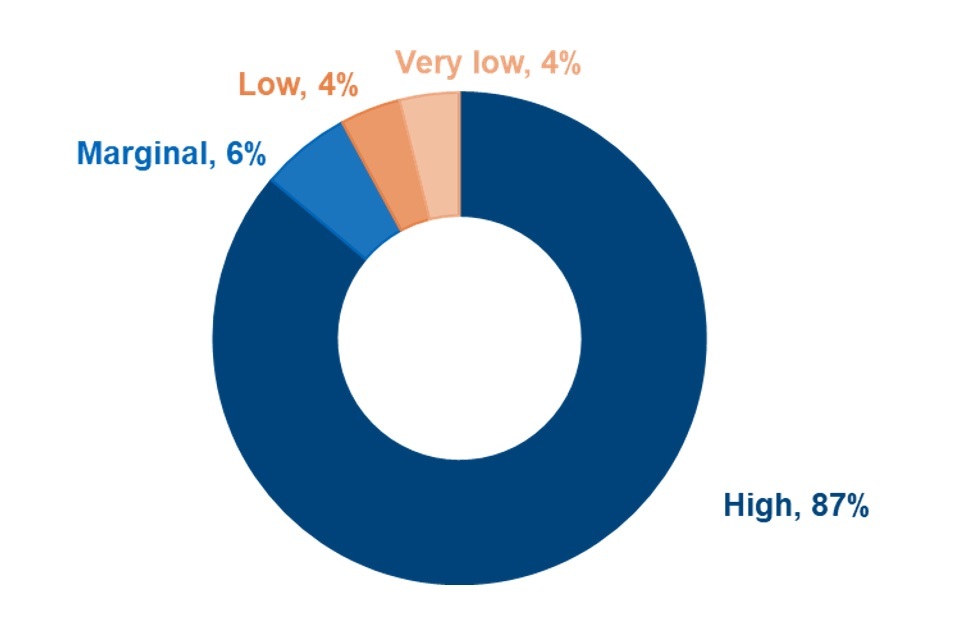
Most households were food secure, with high household food security (87%) or marginal household food security (6%). A minority of households were food insecure, with low household food security (4%) or very low household food security (4%).
Geographically there was almost no difference in the rate of low household food security or very low household food security, between England, Scotland, Wales or Northern Ireland. However, within England the rate did vary between regions:
- Households in the North East (82% high; 7% marginal) and North West (83% high, 7% marginal) were least likely to be food secure
- Households in the East (91% high; 4% marginal) were the most likely to be food secure
See table 9.1 for more data.
Households by total gross weekly income and household food security status, 2019 to 2020, United Kingdom
As income increases, households were more likely to be food secure.
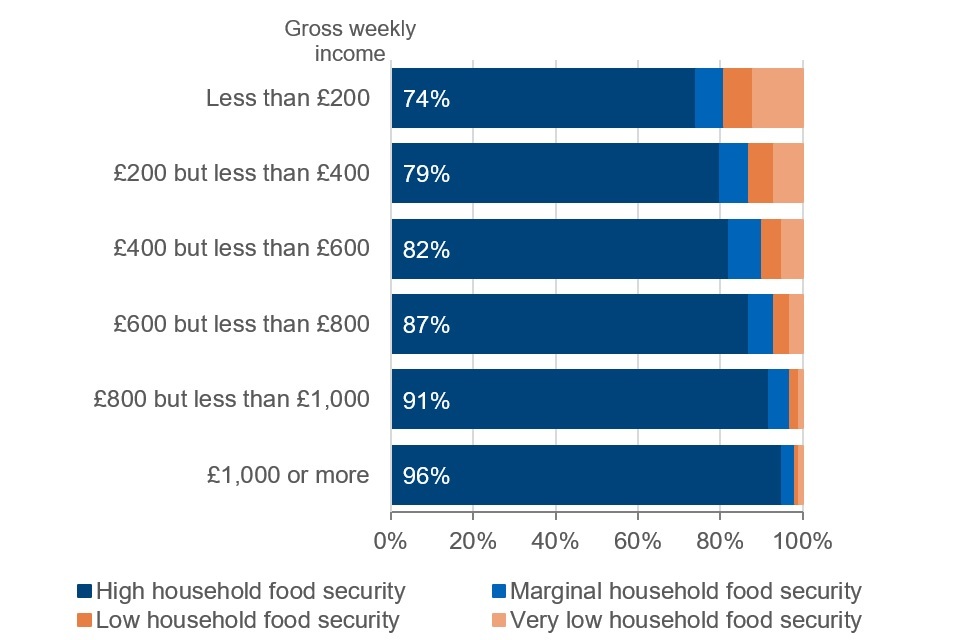
Households on higher weekly incomes were more likely to be food secure:
- Households with gross incomes of less than £200 per week (7% of households) were the least likely to be food secure (74% high; 7% marginal)
- Households with gross incomes of £1,000 or more per week (26% of households) were the most likely to be food secure (96% high; 3% marginal)
See table 9.8 for more data.
Age group of head of household by household food security status, 2019 to 2020, United Kingdom
Household food security was lower in younger households.
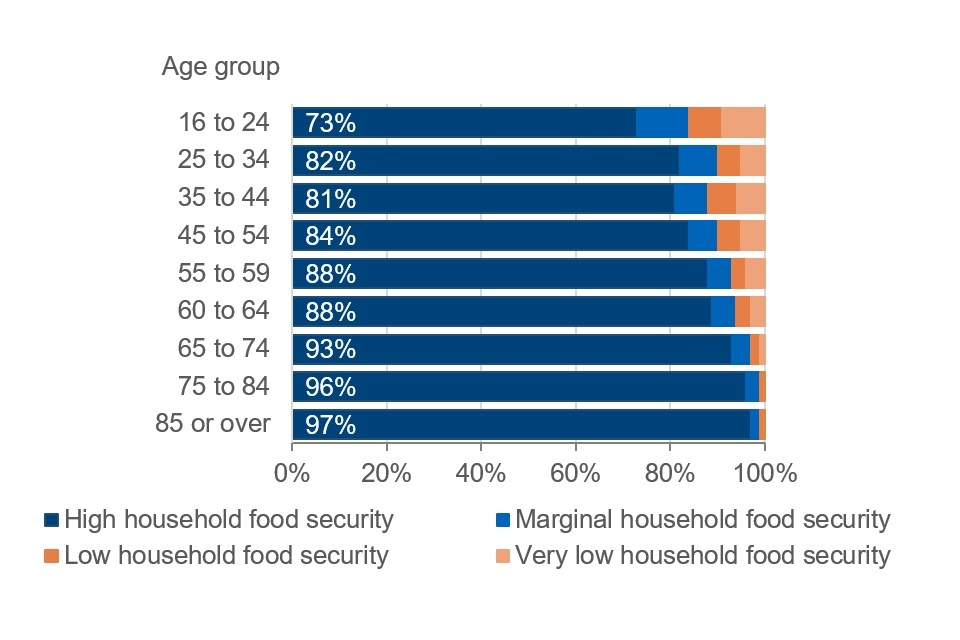
Households where the head is younger were less likely to be food secure than households with older heads of household. In households where the head was aged 16 to 24 years, 73% had high food security and 11% marginal food security. In households where the head was aged 75 to 84 years, 96% had high food security and two per cent marginal food security.
See table 9.3 for more data.
Educational attainment of head of household by household food security status, 2019 to 2020, United Kingdom
Household food security was greater where the head of household has a higher level of qualification.
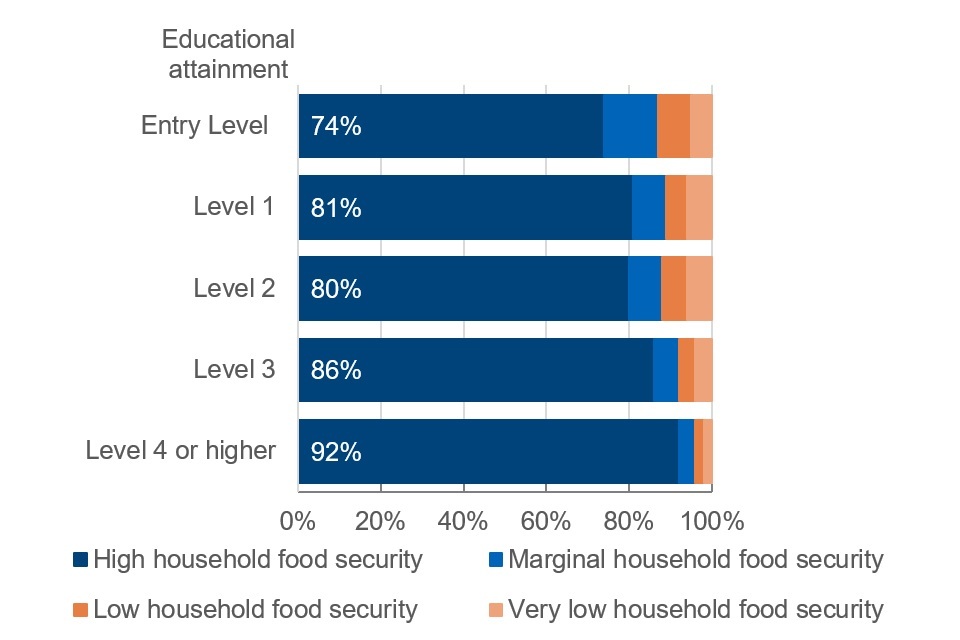
The likelihood of a household being food secure increased notably when the head had a qualification at Level 3 (A-level or equivalent qualifications) or higher. At Level 3, 86% of households had high food security and six per cent had marginal food security. Households where the head had a qualification of Level 4 or higher (higher education qualifications, such as degrees) were even more likely to be food secure (92% high; 4% marginal).
In contrast, where the head of household’s highest qualification was at Level 2, or lower, the household was less likely to be food secure (Level 2 is GCSE grade 4 or higher, and was formerly GCSE grade C or better, or the equivalent in Scotland).
There is little difference in the overall rate of food security between households where the head had Entry Level qualifications (74% high; 13% marginal), Level 1 qualifications (81% high; 8% marginal) and Level 2 qualifications (80% high; 8% marginal). It should be noted that households with heads who have Entry Level qualifications represent less than one per cent of the sample.
For information on how education levels are harmonised between Scotland and other parts of the UK, see the GSS harmonised standard on Qualifications
See table 9.5 for more data.
Household food security varied depending on the ethnic group of the head.
- Indian households were the most likely to be food secure (89% high; 6% marginal)
- While the proportion of food insecure White households (3% low; 4% very low) was small, the absolute number of these households was substantially larger than those of other ethnicities, due to population size
- Households where the head was Black were most likely to be food insecure (11% low; 8% very low)
See table 9.6 for more data.
Single-adult households with children were more likely to be food insecure than households with two or more adults and children.
The FRS food security questions do not ask about children directly, however, they can give an indication of the food security status of the overall household the children live in. There was high variability between different types of households containing children:
- Households with two adults and one or two children had similar to the national rates of household food security
- Households with one adult and one or more children were more likely to experience food insecurity than both the overall rate nationally and for all households with children; moreover, this increased as the number of children increased:
- One child (14% low; 11% very low)
- Two children (15% low; 13% very low)
- Three or more children (22% low; 19% very low)
See table 9.2 for more data.
11. About these statistics
The regulatory arm of the UK Statistics Authority, the Office for Statistics Regulation, has designated the Family Resources Survey as National Statistics, in accordance with the Statistics and Registration Service Act 2007 and signifying compliance with the Code of Practice for Statistics.
National Statistics status means that official statistics meet the highest standards of trustworthiness, quality and public value and comply with all aspects of the Code. The Office for Statistics Regulation has undertaken this assessment to consider whether the statistics meet the required standard.
It is DWP’s responsibility to maintain compliance with the standards expected of National Statistics. If DWP becomes concerned about whether these statistics are still meeting the appropriate standards, we will discuss any concerns with the Office for Statistics Regulation. National Statistics status can be removed at any point when the highest standards are not maintained, and reinstated when standards are restored.
Read further information about National Statistics.
DWP considers that all Family Resources Survey statistics in this publication are “Fully Comparable at level A” of the UK Countries Comparability Scale across countries.
Other National and Official Statistics
Read about other DWP statistics.
DWP announce the release dates of National and Official Statistics, in accordance with the Code.
Status and Development
These statistics underwent a full assessment against the Code of Practice for Statistics in 2011 and were confirmed as National Statistics in November 2012 by the Office for Statistics Regulation.
Since this latest review by the Office for Statistics Regulation, we have continued to comply with the Code of Practice for Statistics, and have made a number of improvements which are described in the Background Information and Methodology section.
For the 2019 to 2020 survey year we have also made these improvements:
-
A new set of questions on Household Food Security were added to the questionnaire. This allowed us to investigate the characteristics and drivers of households affected by food insecurity and the relationship between this and income poverty. The analysis assisted with identifying the groups most at risk, particularly among benefit claimants and thus supports Ministerial decisions by providing the evidence required to understand the impact of DWP policy and operational delivery on the most disadvantaged groups
-
The level of savings and investments, for some families (benefit units) and households in this category, has been estimated using a slightly different methodology in 2019 to 2020 than in previous years. The new method more accurately estimates savings in current accounts and basic bank accounts
-
We have made processing improvements to the benefit editing for Universal Credit, to automate previously complex and time consuming editing through the use of administrative data
-
New questions and variables have been added to reflect changes in policy, such as benefit changes, such as grants specific to some areas of the United Kingdom. This enables related policy analysis to be conducted
12. Using the FRS for analysis
The Family Resources Survey is designed to be representative of all private households in the United Kingdom. Some individuals are not included, for example, students in halls of residence or residents of nursing homes.
Sample design and size
The Family Resources Survey uses a stratified, clustered, random sample. This is designed to produce robust regional estimates. The data is not suitable for analysis below regional level. Although the sample of over 19,000 households is relatively large for a household survey, some subgroups may have small sample sizes, and here several years of data may need to be combined.
Sampling Error
Results from surveys are estimates and not precise figures. In general terms, the smaller the sample size, the greater the uncertainty of the estimates. Results in this report are subject to a margin of error which can affect how changes should be interpreted, especially between groups and in the short term. Latest estimates should always be considered alongside medium and long-term patterns.
Non-Sampling Error
Non-sampling errors are systematic inaccuracies in the sample when compared with the population. For example, people may give inaccurate responses, or certain groups of people may be less likely to respond. Non-sampling error is minimised in the Family Resources Survey through effective and accurate sample and questionnaire design, active fieldwork management, the use of skilled and experienced interviewers and extensive quality assurance of the data.
However, it is not possible to eliminate non-sampling error completely, nor can it be easily quantified. Relative to administrative records, the Family Resources Survey is known to under-report benefit receipt.
Where to find out more
Further outputs and tables, together with a detailed background note and methodology document including a description of methodology, definitions, general guidance and alternative data sources, are available on the Family Resources Survey home page.
A guide to the different definitions of earnings and income, with information on alternative sources of data, is available.
Read more information on income and earning statistics.
The Background Information and Methodology document provides further detail on the reliability of estimates.
Lead Statistician: M A Vaughan
ISBN: 978-1-78659-317-7