Ethnicity and the Criminal Justice System, 2020
Published 2 December 2021
Applies to England and Wales

© Crown copyright 2021
This publication is licensed under the terms of the Open Government Licence v3.0 except where otherwise stated. To view this licence, visit nationalarchives.gov.uk/doc/open-government-licence/version/3 or write to the Information Policy Team, The National Archives, Kew, London TW9 4DU, or email: psi@nationalarchives.gov.uk.
Where we have identified any third party copyright information you will need to obtain permission from the copyright holders concerned.
This publication is available at https://www.gov.uk/government/statistics/ethnicity-and-the-criminal-justice-system-statistics-2020/ethnicity-and-the-criminal-justice-system-2020
We are trialling the publication of this statistical bulletin in HTML format alongside the usual PDF version and we are seeking user feedback on the use of HTML for the publication of statistical bulletins. Please send any comments to: datausers@justice.gov.uk.
1. Executive Summary
This publication compiles statistics from data sources across the Criminal Justice System (CJS), to provide a combined perspective on the typical experiences of different ethnic groups. No causative links can be drawn from these summary statistics. For the majority of the report, no controls have been applied for other characteristics of ethnic groups (such as average income, geography, offence mix or offender history), so it is not possible to determine what proportion of differences identified in this report are directly attributable to ethnicity. Differences observed may indicate areas worth further investigation but should not be taken as evidence of bias or as direct effects of ethnicity.
In general, minority ethnic groups appear to be over-represented at many stages throughout the CJS compared with the White ethnic group. This is especially apparent when comparing to the ethnic breakdown of the population of England and Wales[footnote 1]. The greatest disparity appears at the point of stop and search, custodial remands and prison population. Among minority ethnic groups, Black individuals were often the most over-represented. Outcomes for minority ethnic children are often more pronounced than White children at various points of the CJS. Differences in outcomes between ethnic groups over time present a mixed picture, with disparity decreasing in some areas and widening in others.
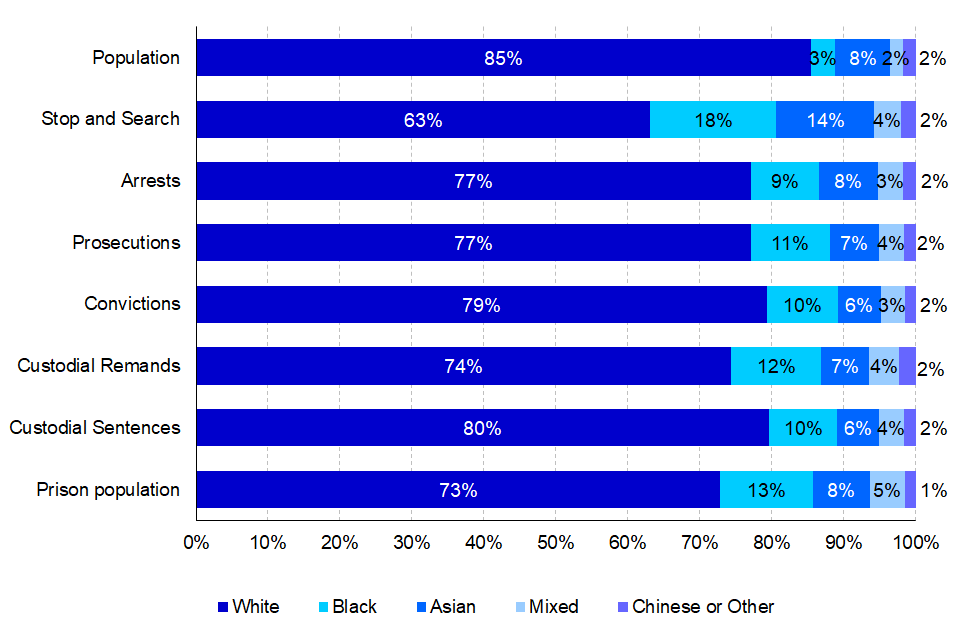
Figure 1.01: Ethnicity proportions for adults throughout the criminal justice system, 2020
Victims
| The Asian ethnic group (2%) were significantly less likely than the White ethnic group (4%) to be victims of a personal crime, whilst the Mixed ethnic group (7%) were significantly more likely. | Since 2015/16 there have been statistically significant decreases in reports of victims of crimes seen in the Black (from 7 to 4%) and Asian (from 4 to 2%) ethnic groups. |
| Between 2017/18 and 2019/20, almost half (49%) of homicide victims aged 15 to 17 and 37% of victims aged 18 to 20 were from the Black ethnic group. | During this three-year period, 38% of Black homicide victims were of age 20 or younger; 13% of White, 24% of Asian and 33% of Other ethnicity homicide victims were in this age group. |
Police Activity
| The total number of stop and searches, where ethnicity was known, increased between 2017/18 (266,000) and 2020/21 (557,000). | The proportion of suspects stopped and searched remained relatively stable across most ethnic groups, with a decrease from 21% to 17% for the Black ethnic group. |
| In 2020/21, 43% of all stop and searches (where ethnicity is known) were conducted in London, involving a higher proportion of persons from minority ethnic groups when compared to the rest of England and Wales. | There was a decrease in the proportion of stop and searches conducted on Black individuals in London, from 36% in 2016/17 to 32% in 2020/21. |
| Black suspects had the highest proportion of arrests that resulted from stop and search, accounting for 23% of total arrests, which has increased from 17% in 2016/17. | This was driven by the overrepresentation of Black individuals in the proportion of stop and searches; 17% of all stop and searches were of Black individuals. |
| In 2020/21, two thirds (66%) of children arrested in London were from minority ethnic groups, compared to 20% of children arrested in the rest of England and Wales. | Similarly, just over half (53%) of adults arrested in London were from minority ethnic groups, compared to 15% of adults arrested in the rest of England and Wales. |
Defendants
| Ethnic minority groups were more likely to be remanded in custody at Crown Court in comparison to White defendants. | In 2020, 40% of White defendants were remanded in custody compared to 51% of Chinese or Other and 49% of Black defendants. |
| Custody rates have largely converged across ethnic groups between 2016 and 2019. | Since 2019, Black and Asian defendants have been less likely to receive a custodial sentence relative to White defendants. |
| Since 2016, White defendants have had a consistently lower average custodial sentence length (ACSL) than other ethnic groups. | In 2020, White offenders had an ACSL of 19.6 months in comparison with 26.8 for Black offenders, 28.6 for Asian offenders, and 24.4 for offenders of Mixed and Chinese or Other ethnic groups. |
| Guilty plea rate (GPR) has increased across all ethnic groups across the past 5 years, showing a sharp rise since 2018. | Across the past 5 years, White defendants have consistently had the highest guilty plea rate, at 79% in 2020, compared to Black defendants at 66%. |
Offender Management
| A greater number of children in prison were from minority ethnic groups | In 2020, 32% of children in prison were Black despite Black prisoners accounting for only 13% of the entire prison population. In contrast, despite White prisoners making up 73% of the entire prison population, only 47% of prisoners aged under 18 were White. |
| Black prisoners served the greatest proportion of their original sentence in custody | In line with previous years, Black defendants continued to serve a greater proportion of their original determinate sentence in custody (67% in 2020) when compared with Mixed (66%) White (60%), Asian (58%) and prisoners from Other ethnic groups (58%). |
| In the 2020/21 HM Inspectorate of Prisons survey, prisoners from ethnic minority groups reported more negative results across the survey | In comparison to all other ethnic groups, higher proportions of White prisoners reported more positive experiences, including feeling respected by staff, feeling safe from COVID and having enough cleaning facilities. |
Offender Characteristics
| In 2020, of all males prosecuted for an indictable offence 75% were White, whilst for all females prosecuted 86% were White. | Black males accounted for 12% of all male prosecutions, compared to Black females, accounting for 7% of all female prosecutions. |
| A higher proportion of prosecutions for Black and Mixed ethnic groups were against children, 12% and 14% respectively, compared to 5% for White defendants. | In 2020, minority ethnic children also had a higher proportion remanded in custody, had a higher custody rate and received on average longer custodial sentences. |
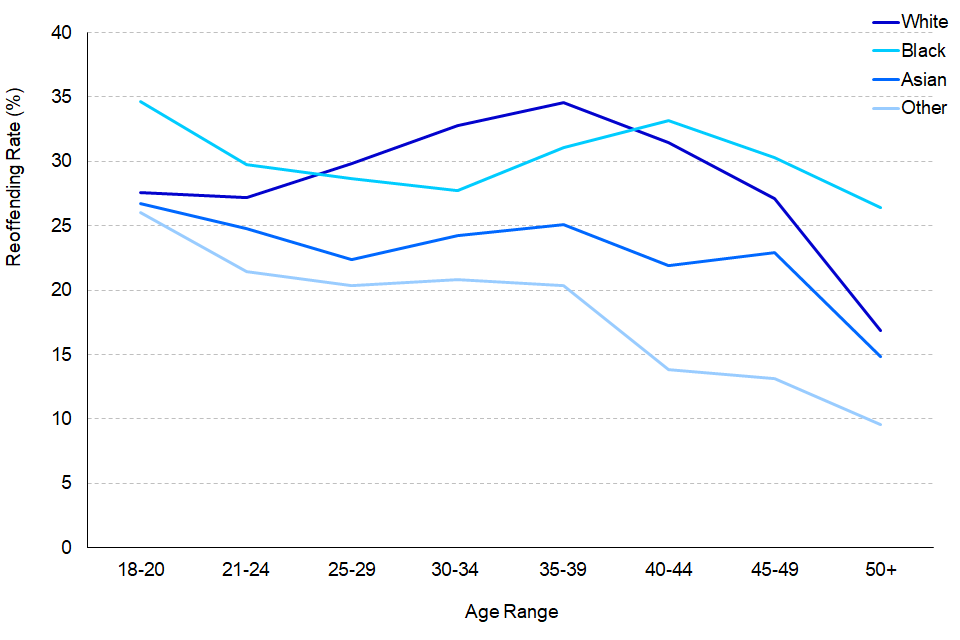
| The reoffending rate of adults was highest for those aged 18-20 for ethnic minority groups. | The reoffending rate for Black adult offenders was highest for 18-20 year olds at 35%. For White adult offenders, the reoffending rate was highest for those aged 35-39 at 35%. |
Offence analysis
| Controlling for offence mix across ethnic groups showed reduced disparity in Average Custodial Sentence Lengths and Custody Rates. | When offence mix was controlled for, a decrease in ACSL was seen for all ethnic groups, closer to that of the White ethnic group. |
| The ACSL for possession of weapons offences fell by 41% in the past 5 years for Asian offenders and 23% for Black offenders. | ACSL for possession of weapons offences decreased, between 2016 and 2020, for all ethnic groups except Mixed, decreasing the largest for Asian and Black offenders. |
| In 2020, Asian offenders had the longest ACSL for drug offences, at 46.2 months. | Asian offenders had a longer ACSL for drug offences compared to all other ethnic groups, which ranged from 31.8 to 39.8 months. |
| Of defendants prosecuted for sexual offences at Crown Court, Black defendants were more likely to be remanded in custody. | In 2020, 52% of Black defendants were remanded in custody, compared to 36% of White defendants. This trend has fluctuated across the past 5 years. |
Practitioners
| The ethnic profile of practitioners in the Criminal Justice System (CJS) has become slightly more diverse over the last 5 years. | The proportion of staff from White backgrounds has decreased between 1 and 2.4 percentage points across all CJS organisations over the last 5 years, largely driven by increases in the proportion of staff from Asian and Mixed ethnic backgrounds. |
2. Introduction
Section 95 of the Criminal Justice Act 1991 states that:
The Secretary of State shall in each year publish such information as they consider expedient for the purpose… of facilitating the performance of those engaged in the administration of justice to avoid discriminating against any persons on the ground of race or sex or any other improper ground…
Documents fulfilling this requirement have been published since 1992, in the form of statistical reports. This publication compiles statistics from data sources across the Criminal Justice System (CJS), to provide a combined perspective on the typical experiences of different ethnic groups, how outcomes vary between groups and how this has changed over time.
The areas of focus include: Victimisation; Police Activity; Defendants and Court Outcomes; Offender Management; Offender Characteristics; Offence Analysis; and Practitioners.
The publication aims to help practitioners, policy makers, academics and members of the public understand outcomes and trends for different ethnic groups in the CJS in England and Wales. This is the latest biennial compendium of Statistics on Ethnicity (formerly Race) and the Criminal Justice System and follows on from its sister publication Statistics on Women and the Criminal Justice System published last year.
Limitations on conclusions
Although we explore differences between ethnic groups, it is important that inferences are not made about individuals from group-level data as we consider averaged outcomes that do not take into consideration the individual circumstances which differ in each case. Because of this, the statistics presented in this report cannot present the typical experience of a person of a particular ethnic group, but it can highlight areas where further investigation or research may be warranted when looking at differences between ethnic groups.
It is important to note that for the majority of the report, no controls have been applied for other characteristics of ethnic groups (such as average income, geography, offence mix or offender history), so it is not possible to determine what proportion of differences identified in this report are directly attributable to ethnicity. It is not possible to make any causal links between ethnicity and CJS outcomes. The identification of differences should not be taken as evidence of bias or as direct effects of ethnicity.
Ethnicity
Ethnicity is recorded by either self-reporting or as identified by a police officer[footnote 2]. When ethnicity is self-reported, it is based on five broad categories: White, Black, Asian, Mixed and Chinese or Other. When ethnicity is officer identified[footnote 3], it has four broad ethnicity categories: White, Black, Asian and Other[footnote 4]. Generally, we discuss the broad categories individually, to reflect their different experiences, but given the much greater numbers of White individuals in the population it is sometimes necessary or appropriate to consider the minority ethnic groups together.
In acknowledgement of the subjective, multifaceted and changing nature of ethnic identification, we use self-identified ethnicity where this data is available[footnote 5]. The ethnicity classification used in each section is referenced throughout.
Individuals with an unknown or not stated ethnicity are not included in the analysis, because it is impossible to tell where they should be counted. High levels of missing ethnicity data would be of concern, both in terms of sample sizes and the risk of systematic bias. To allow users to assess the confidence they have in the data we are using, levels of missing or unreported ethnicity are reported throughout.
In previous publications we have made comparisons to the population using 2011 Census data. In the 2011 Census the proportion in each ethnic group was as follows: 87% White, 3% Black, 6% Asian, 2% Mixed and 2% Chinese or Other. As this data is now several years old it may not accurately represent the distribution of ethnic groups in the population, particularly for children when comparing to 2018 CJS figures. As such, analysis which relies on the 2011 Census data has not been included.
Data
Every effort is made to ensure that the figures presented are accurate and complete. However, these data have been extracted from large administrative data systems and surveys generated by the courts, police forces and other agencies, so some care should be taken, in particular when considering small differences and or sample sizes.
Where possible, this report takes into consideration the recommendations of the Lammy Review (a 2017 independent review into the treatment of, and outcomes for Black, Asian and Minority Ethnic individuals in the criminal justice system). This includes putting more information in the public domain with ethnicity breakdowns, the use of the Relative Rate Indexes[footnote 6] where appropriate and a focus on outcomes for children distinct form the adult population.
In most instances data are presented in terms of calendar years (up to 2020) and financial years (up to 2019/20), reflecting the reporting cycles and data collection of the agencies contributing information for this publication. Five-year trends have been presented wherever possible. Where changes to data systems or data quality issues do not allow for this, trends have been presented for the longest periods possible. The latest data available during the compilation of this report have been included.
In certain instances, data has been used for years that are not impacted by restrictions but in place in response to the COVID-19 pandemic. This has been avoided where possible in order to provide the most recent data. However, priority has been given to allow for a full year of reliable data that shows continuation of long-term trends. Data sources to which this applies include Crime Survey for England and Wales.
All results relate to England and Wales unless explicitly stated otherwise. Large figures are generally presented rounded to the nearest thousand, and percentages to the nearest percentage point in the text. Unrounded figures can be found in the accompanying spreadsheet tables and published source data.
The statistics reported in this bulletin are primarily National Statistics[footnote 7], as drawn from either other published National Statistics bulletins or the data underpinning them. However, as in previous reports, in order to present as full a picture as possible we have also included some statistics that do not have this badging where National Statistics are not held on important or new topics. These include:
-
Survey data from Her Majesty’s Inspectorate of Prisons Annual Report
-
Youth Custody data (Official Statistics)
-
(New) Understanding Educational Background of Offenders (MoJ/ DfE data share)
Where a source is not National Statistics, users should consider this when making judgements about the weight that can be put on related findings.
Information provided
-
Supplementary Excel (in an Open .ods format) tables accompany the chapters, providing additional data where the figures have not previously been published (or not published in that form). Where figures have been published, links are provided as part of the text and tables.
-
A technical document titled A Guide to Statistics on Ethnicity and the Criminal Justice System is available alongside this report, which provides users with information on the concepts and terminology used within the report, as well as information about data sources, data quality and references.
-
An infographic is published alongside this report to provide visualisations of key messages.
The overall style and composition of the report have also been changed: the condensing of commentary is intended to make it easier for readers to interpret the relative experiences of ethnic groups throughout the CJS.
The Ministry of Justice would welcome any feedback on the content, presentation or on any other aspect of this bulletin – we can be contacted through: CJS_Statistics@justice.gov.uk
3. Victims
The Asian ethnic group (2%) were significantly less likely than the White ethnic group (4%) to be victims of a personal crime, whilst the Mixed ethnic group (7%) were significantly more likely.
Since 2015/16 there have been statistically significant decreases in reports of victims of crimes seen in the Black (from 7 to 4%) and Asian (from 4 to 2%) ethnic groups.
Between 2017/18 and 2019/20, almost half (49%) of homicide victims aged 15 to 17 and 37% of victims aged 18 to 20 were from the Black ethnic group.
During this three-year period, 38% of Black homicide victims were of age 20 or younger; 13% of White, 24% of Asian and 33% of Other ethnicity homicide victims were in this age group.
This chapter explores the nature, extent and risks of victims, in relation to ethnicity, from the Crime Survey for England and Wales (CSEW) year ending March 2020 and the Home Office Homicide Index[footnote 8]. The CSEW is a large nationally representative survey that asks people about their experience as a victim of a crime in the previous 12 months. It offers insights into the experience of victims which other sources of data, such as police records, may not capture[footnote 9]. In response to COVID-19 lockdown restrictions, interviews were suspended two weeks early in March 2020. All estimates from the CSEW are for the year ending March 2020 and were therefore minimally affected by lockdown restrictions[footnote 10].
In this section, where there are statistically significant differences between groups to the 95% level, this will be stated.
3.1 Crime Survey for England and Wales
Personal crime [footnote 11] against adults
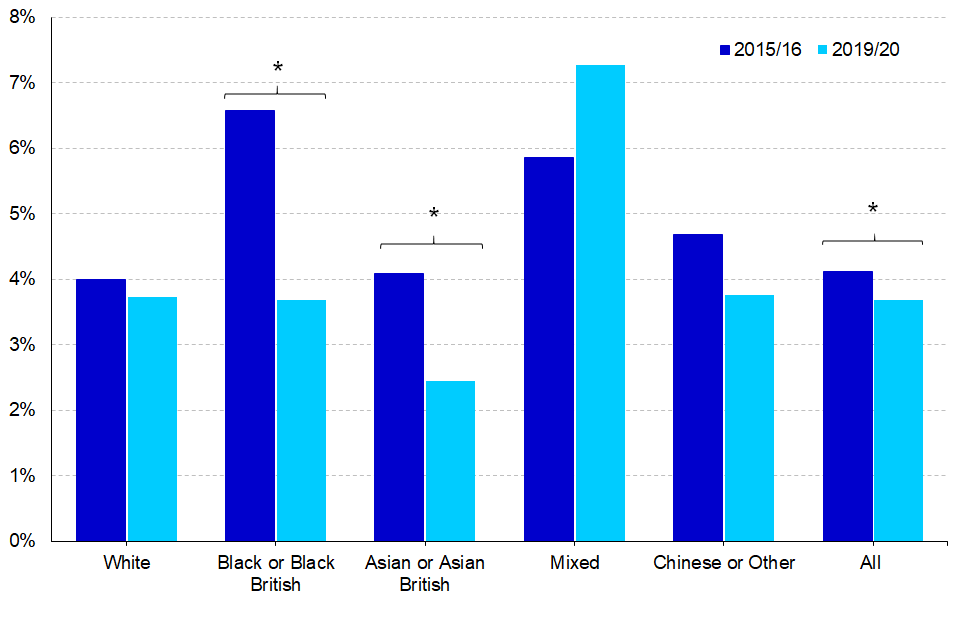
In 2019/20, the CSEW estimated that 4% of adults were a victim of a personal crime on one or more occasions. The Asian ethnic group (2%) were significantly less likely than the White ethnic group (4%) to be victims of a personal crime, whilst the Mixed ethnic group (7%) were significantly more likely.
Since 2015/16, the percentage of adults who were victims of a personal crime once or more, excluding fraud and computer misuse, remained stable at 4%. There were statistically significant decreases in the number of victims for personal crimes since 2015/16 in the Black (from 7% to 4%) and Asian (from 4% to 2%) ethnic groups.
Personal crime against children
In 2019/20, an estimated 6% of children were a victim of a personal crime once or more, based on findings from the CSEW. Similar to trends in adults, children from the Asian ethnic group (3%) were significantly less likely to be victim of personal crime than those from the White ethnic group (7%). Of children, 4 to 6% were reported as being victims in Black, Mixed and Chinese or Other ethnic groups.
Since 2015/16, there has been a statistically significant decrease in children reporting experience as a victim of a personal crime (down 49%). This decrease was also significant for White (down 44%), Black (down 80%) and Asian (down 67%) children, in isolation.
Figure 3.01: Percentage of adults who reported as victims of a CSEW personal crime by ethnic group, England and Wales 2015/16 and 2019/20[footnote 12]
3.2 Homicide
In the three-year period 2017/18[footnote 13] to 2019/20, there were 1,951[footnote 14] homicides in the Home Office Homicide Index[footnote 15], where ethnicity of the victim was recorded. In previous years homicide data has been presented in relation to population data, by giving the number of deaths per million of the population of each ethnic group. As discussed in the Introduction, the 2011 Census data used to create these estimates is now several years old and may not accurately represent the distribution of ethnic groups in the population. As such, the homicide data in this chapter will not be related to population numbers[footnote 16].
Almost three quarters (1,405 or 72%) of all homicide victims (where ethnicity was known) over the three-year period were from the White ethnic group. There were 292 (15%) victims in the Black, 147 (8%) in the Asian and 107 (5%) in the Other ethnic groups[footnote 17]. The proportion of White victims decreased by 7 percentage points (pp) since the previous three-year period (2014/15 to 2016/17), with corresponding increases in the proportions of victims from Black (up 3pp), Asian (up 2pp), and Other (up 2pp) ethnic groups. Since this previous period, homicides, overall, increased by 17%. In comparison to the period 2011/12 to 2013/14, homicides increased 25%, with a 4pp increase in the proportion of victims from the Black ethnic group, whilst the proportion of those from the White ethnic group decreased 6pp.
Sex
There was a greater number of male than female homicide victims in all ethnic groups. The proportion of male homicides was highest in the Black ethnic group (89%), followed by the Other ethnic group (77%), and the Asian ethnic group (68%). The lowest proportion of male homicides was in the White ethnic group (65%).
Age
White victims accounted for over three quarters (77%) of homicide victims in both the 0-14 and 21+ age groups. Almost half (49%) of homicide victims aged 15-17 and 37% of those aged 18-20 were from the Black ethnic group. Around 34% of all Black homicide victims were aged between 15 and 20. In comparison, these age groups accounted for 6% of victims from the White, 17% from Asian and 27% from Other ethnic groups.
Geography
London showed a markedly different pattern than the rest of England and Wales. There were a total of 426 homicides in London, where ethnicity of the victim was recorded, in the three-year period (2017/18 to 2019/20). This was the only region in which homicide victims were more likely to be from the Black ethnic group (42%), followed by White ethnic group (40%). This may partly reflect the different distributions of ethnic groups in the population in different locations, as London is more ethnically diverse than England and Wales as a whole.
Location
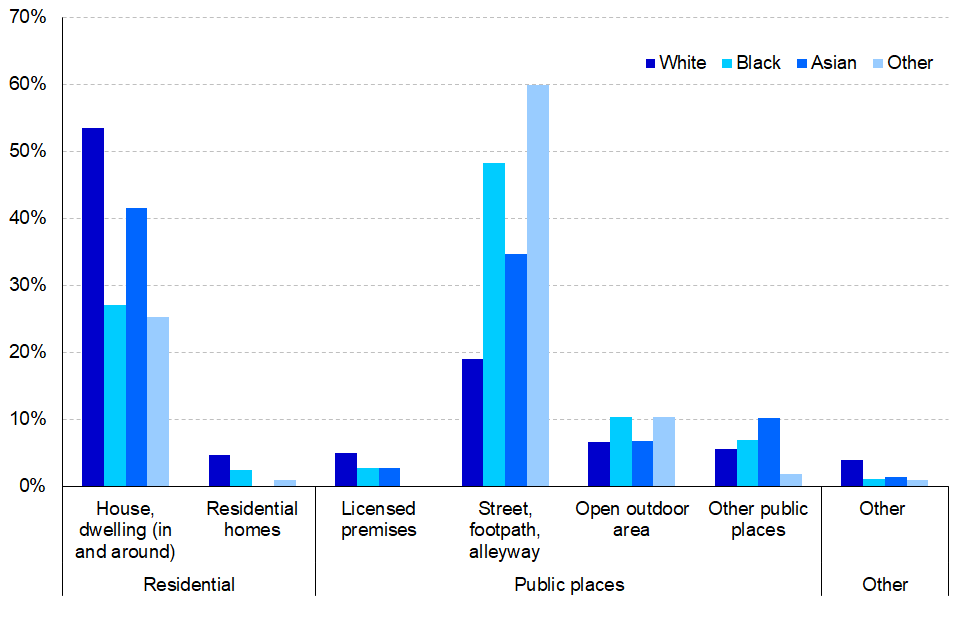
The location in which a homicide was committed showed marked differences between ethnic groups. In the three-year period from 2017/18 to 2019/20, the most frequent location for homicides with White or Asian victims was in and around the house (53% and 41%, respectively), whereas those with victims from Black or Other ethnic groups were more likely to take place on the street (including footpaths/alleyways; 60% and 48%, respectively).
Figure 3.02: Homicides currently recorded by location of homicide and ethnic appearance of victim: England and Wales, combined data for 2017/18 to 2019/20
Method of killing
A sharp instrument was the most frequent apparent method of killing across most ethnic groups, accounting for 40% of all homicides in the period between 2017/18 and 2019/20. This method accounted for 69% of homicides with Black victims, but only 35% of those with White victims. The most frequent method of killing in homicides with Asian victims was Strangulation (38%), closely followed by sharp instrument (35%).
Relationship with suspect[footnote 18]
The relationship between the homicide victim and principal suspect[footnote 19] varied across ethnic groups. Principal suspects in homicides with White victims were most likely to be a friend/acquaintance (29%). Principal suspects in homicides with all other ethnicities were most likely to be a stranger (Black 43%, Asian 28%, Other 65%). The Asian ethnic group had a higher proportion of homicides where the principal suspect was a family member (17%) or partner/ex-partner (22%), compared to all other ethnic groups.
4. Police Activity
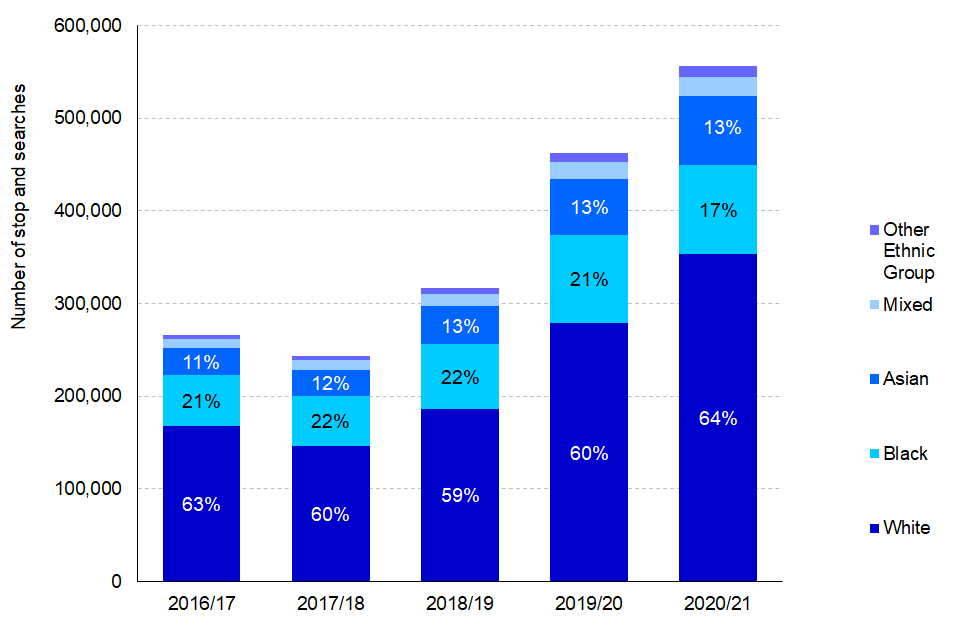
The total number of stop and searches, where ethnicity was known, increased between 2017/18 (266,000) and 2020/21 (557,000).
The proportion of suspects stopped and searched remained relatively stable across most ethnic groups, with a decrease from 21% to 17% for the Black ethnic group.
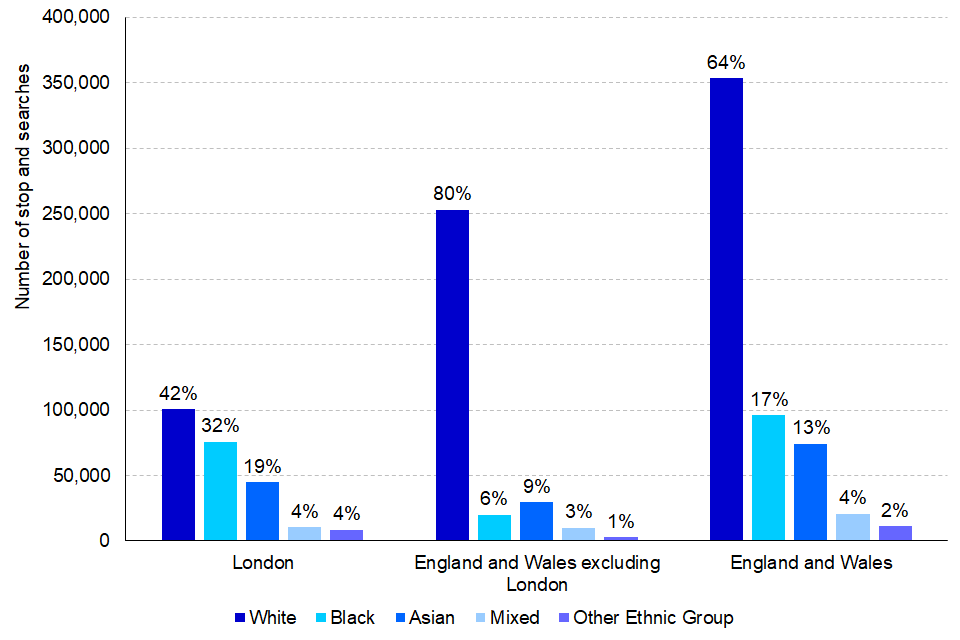
In 2020/21, 43% of all stop and searches (where ethnicity is known) were conducted in London, involving a higher proportion of persons from minority ethnic groups when compared to the rest of England and Wales.
There was a decrease in the proportion of stop and searches conducted on Black individuals in London, from 36% in 2016/17 to 32% in 2020/21.
Black suspects had the highest proportion of arrests that resulted from stop and search, accounting for 23% of total arrests, which has increased from 17% in 2016/17.
This was driven by the overrepresentation of Black individuals in the proportion of stop and searches; 17% of all stop and searches were of Black individuals.
In 2020/21, two thirds (66%) of children arrested in London were from minority ethnic groups, compared to 20% of children arrested in the rest of England and Wales.
Similarly, just over half (53%) of adults arrested in London were from minority ethnic groups, compared to 15% of adults arrested in the rest of England and Wales.
This chapter explores police activity by ethnicity of persons stopped and searched and/or arrested. It covers statistics on stop and searches and arrests, which are published by the Home Office in the Police powers and procedures: Stop and search and arrests, England and Wales, year ending 31 March 2021[footnote 20].
4.1 Stop and searches[footnote 21]
Police officers have the power to stop and search individuals under different pieces of legislation. In this chapter, those conducted under section 1 of the Police and Criminal Evidence Act 1984 (PACE) and section 60 of the Criminal Justice and Public Order Act 1994 have been combined[footnote 22].
Where ethnicity is known[footnote 23], the total number of stop and searches increased between 2017/18 (266,000) and 2020/21 (557,000). Over the last 5 years, the proportion of suspects who were stopped and searched remained relatively stable across most ethnic groups, with a slight decrease in those from the Black ethnic group (21% to 17%).
Figure 4.01: Numbers of stop and searches by ethnicity, England and Wales, 2016/17 to 2020/21
Comparisons between London and the rest of England and Wales
The overall ethnicity trends for stop and searches tend to be influenced by stop and searches conducted in London, due to London’s ethnic composition compared with the rest of England and Wales. In 2020/21, 43% of all stop and searches (where ethnicity is known) were conducted in London and involved higher proportions of persons searched from minority ethnic groups when compared to the rest of England and Wales (Figure 4.02).
Over the last 5 years, there has been a decrease in the proportion of stop and searches conducted on Black individuals in London, from 36% in 2016/17 to 32% in 2020/21. There was a corresponding increase in stop and searches conducted on Asian suspects (15% to 19%) whilst all other ethnic groups remained relatively constant.
Figure 4.02: Distribution of stop and searches in London and England and Wales, by ethnicity, 2020/21
Reasons for stop and search
When conducting a stop and search, police record the reason for the stop and search as well as the ethnicity of the person searched[footnote 25]. There are various reasons why the police may carry out a stop and search, for example they may suspect an individual is carrying drugs or a weapon.
In the latest year, suspicion of drugs and offensive weapons were the two most common reasons for stops across all ethnic groups. In 2020/21, 77% of stop and searches conducted on individuals from the Asian ethnic group were for drugs, compared to 67 to 68% of all other ethnic groups. Black suspects had the highest proportion of stop and searches for offensive weapons (including firearms) at 19%, compared to 10 to 15% for all other ethnic groups[footnote 26].
Arrests resulting from stop and search
Stop and search is an important detection tool for the police – it allows officers to search individuals without an arrest taking place[footnote 27].
Over the last 5 years, the rates of arrests following stop and searches for all ethnic groups continued to converge. The arrest rate for all ethnic groups decreased over this period, each within the range of 4 percentage points (pp) in 2020/21 (10 to 14%).
Reasons for searches that resulted in arrest[footnote 28]
For all ethnicities, drugs were the most common reason for searches that resulted in an arrest after a stop and search, accounting for 57% of resultant arrests for White suspects, 59% for Black suspects, 69% for Asian suspects, 60% for Mixed suspects and 54% for Other suspects.
Stop and Search arrests
In 2020/21, stop and searches which resulted in arrests accounted for 12% of total arrests made in England and Wales (where ethnicity is known). Black suspects had the highest proportion of arrests that resulted from stop and search, accounting for 23% of total arrests, which has increased from 17% in 2016/17. This proportion varied between 10% and 17% for all other ethnic groups in 2020/21. This overall trend is influenced by the higher number of stop and searches carried out in London, where stop and search arrests accounted for 26% of total arrests, which has increased from 17% in 2016/17. In the rest of England and Wales, stop and search arrests accounted for 8% of total arrests, increasing from 4% in 2016/17.
Stop and Search outcomes [footnote 29]
This section focusses on disaggregating the outcomes that are a result of a professional judgement (i.e. the officer found what they were searching for), and those where the item found was not what the officer was searching for, or where nothing was found.
In 2020/21, 21% of all stop and searches (where ethnicity is known) resulted in an outcome that was linked to the reason for the search, i.e. the officer found what they were searching for[footnote 30]. Mixed ethnicity suspects had the highest proportion of stop and searches in which the outcome was linked (25%) compared to all other ethnic groups, these ranged from 21% to 22%. Black and Other ethnicity suspects had the highest proportion of stop and searches where nothing was found (both 76%), followed by Asian suspects (74%).
In 2020/21, three quarters (77%) of stop and searches resulted in the principal outcome ‘no further action’[footnote 31]. Arrests were the principal outcome in 12% of stop and searches, community resolutions in 7% and other outcomes in 6% . A higher proportion of Mixed suspects received the principal outcome of arrest at 14%, compared to 13% of Black suspects, 12% of White suspects, 11% of Other ethnicity suspects and 10% of Asian suspects.
4.2 Arrests[footnote 33]
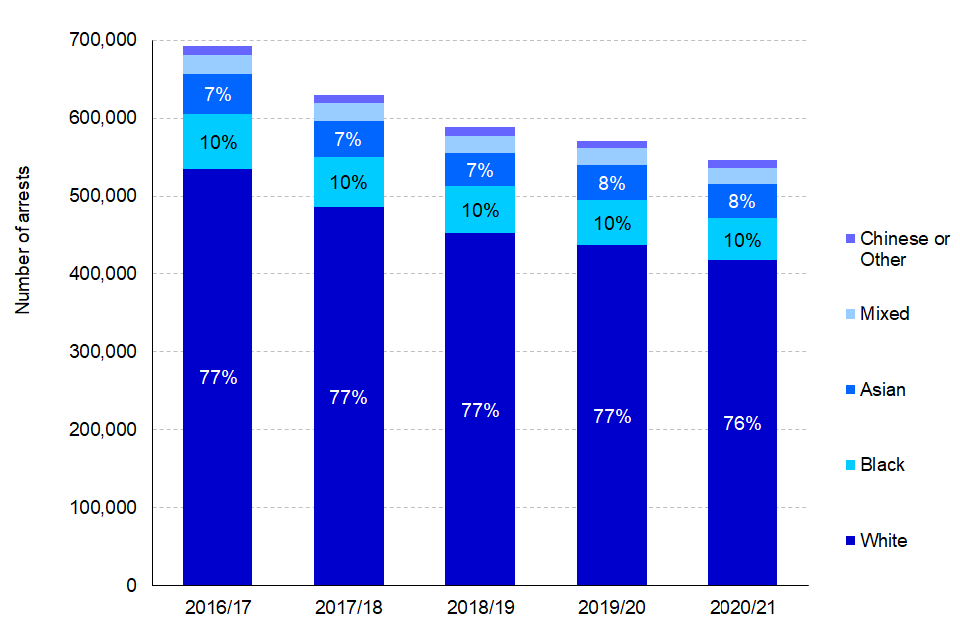
The total number of all arrests (where ethnicity is known) decreased by 21% between 2016/17 and 2020/21; this decrease was relatively consistent across most ethnic groups.
In 2020/21, White suspects accounted for 76% of arrests, 10% were for Black suspects, 8% were for Asian suspects, 4% were for Mixed ethnicity suspects and 2% were for Other ethnicity suspects. Relative proportions of arrests across ethnic groups remained stable between 2016/17 and 2020/21.
Arrests by Police Force Area: London
In 2020/21, 20% of all arrests (where ethnicity is known) were made in London[footnote 34]. A larger proportion of arrests in London were for suspects from minority ethnic groups, at 55%, compared to 16% across the rest of England and Wales. This is expected given the more diverse population of London. Over the last 5 years, the proportion of arrests in London and across England and Wales have remained relatively stable by ethnic group.
Children from minority ethnic groups accounted for two thirds (66%) of arrests of children made in London in in 2020/21. Over the last 5 years, the proportion of children arrested in London from White ethnic groups has decreased from 38% to 34%, with corresponding marginal increases in arrests of children from across minority ethnic groups.
Figure 4.03: Arrests in England and Wales by ethnicity, 2016/17 to 2020/21[footnote 35]
Age groups[footnote 36]
Arrests for children have been declining at a faster rate than arrests for adults, down 33% and 20% respectively since 2016/17. This trend varied by ethnic group and reduction in the number of arrests was more pronounced for White (-35%) and Black (-33%) children. Arrests for Asian, Mixed and Other ethnicity children declined 24% to 25%. Arrests declined 21% and 22%, respectively, for White and Black adult suspects, a higher rate than other ethnic groups.
Offence groups[footnote 37]
Violence against the person offences have accounted for the largest proportion of total arrests (where ethnicity is known) since 2017/18, at 42% in 2020/21. The proportion of total arrests for which theft offences account has been decreasing over this period (20 to 13%) with a corresponding increase in the proportion accounted for by drug offences (9 to 12%).
In 2020/21, 19% of arrests of Black suspects were for drug offences. This was a higher proportion than any other ethnic group, for example, only 10% of arrests of White suspects were for drug offences.
Across all minority ethnic groups, the most common reason for arrest was violence against the person, followed by drug offences. However, for White suspects, the proportion of arrests for drug offences (10%), was exceeded by the proportion of arrests for theft offences (14%).
5. Defendants
Ethnic minority groups were more likely to be remanded in custody at Crown Court in comparison to White defendants.
In 2020, 40% of White defendants were remanded in custody compared to 51% of Chinese or Other and 49% of Black defendants.
Custody rates have largely converged across ethnic groups between 2016 and 2019.
Since 2019, Black and Asian defendants have been less likely to receive a custodial sentence relative to White defendants.
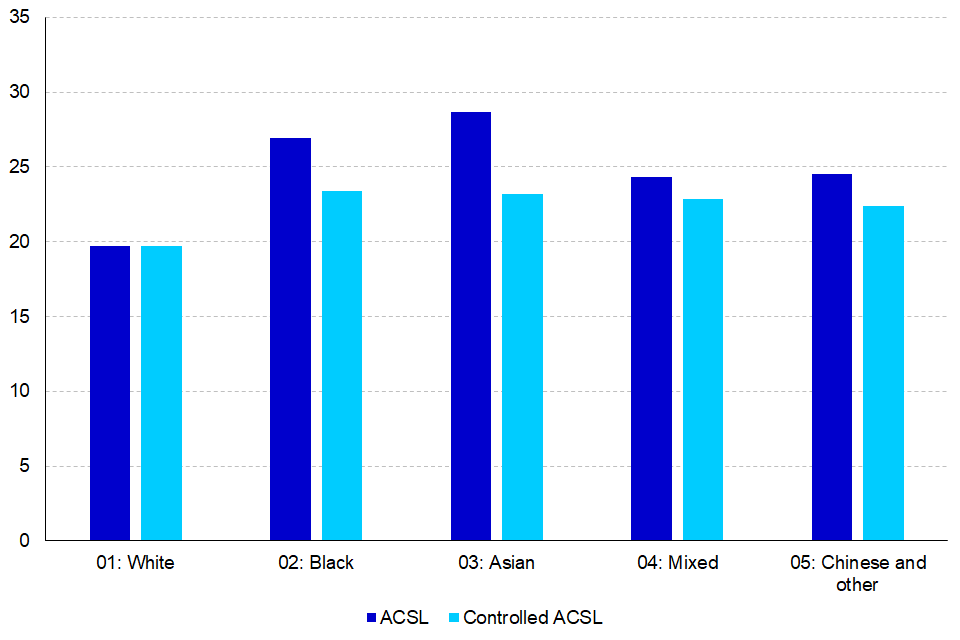
Since 2016, White defendants have had a consistently lower average custodial sentence length (ACSL) than other ethnic groups.
In 2020, White offenders had an ACSL of 19.6 months in comparison with 26.8 for Black offenders, 28.6 for Asian offenders, and 24.4 for offenders of Mixed and Chinese or Other ethnic groups.
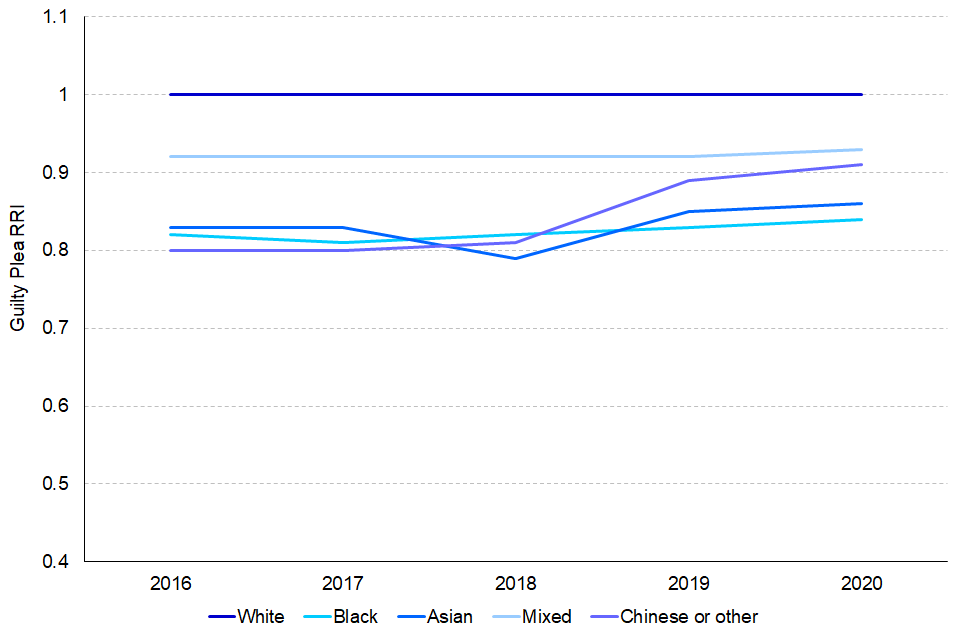
Guilty plea rate (GPR) has increased across all ethnic groups across the past 5 years, showing a sharp rise since 2018.
Across the past 5 years, White defendants have consistently had the highest guilty plea rate, at 79% in 2020, compared to Black defendants at 66%.
This chapter explores outcomes for defendants[footnote 38] in the Criminal Justice System (CJS) predominantly drawing on indictable offence data from the Criminal Justice Statistics quarterly: December 2020 publication. Other sources in this chapter include Criminal Courts Statistics and Legal Aid Statistics. When a suspect is formally charged, they are brought before a magistrates’ court (as a defendant) as soon as possible. Following prosecution (which can include being sent to Crown Court), defendants found guilty are subsequently convicted and sentenced. The defendant can be directed to appear in court or remanded on bail or in custody. The most recent figures in this publication show the impact of the COVID-19 pandemic on criminal court prosecutions and outcomes following guidance and restrictions since March 2020. The latest trends are mostly reflective of the impact of the pandemic on court processes and prioritisation rather than a continuation of the longer-term series.
5.1 Prosecutions and Convictions
In 2020, of the defendants prosecuted, 76% were White, 12% were Black, 7% were Asian, 4% were of Mixed ethnicity groups, and 2% were Chinese or Other ethnic groups. Despite the large decrease in both prosecutions and convictions over the past 5 years, proportions across ethnic groups have remained stable. The largest proportionate change was seen in prosecutions of White defendants, decreasing from 79% of all prosecutions to 76% (resulting in a 1% proportionate increase across all ethnic minority groups).
5.2 Offence groups
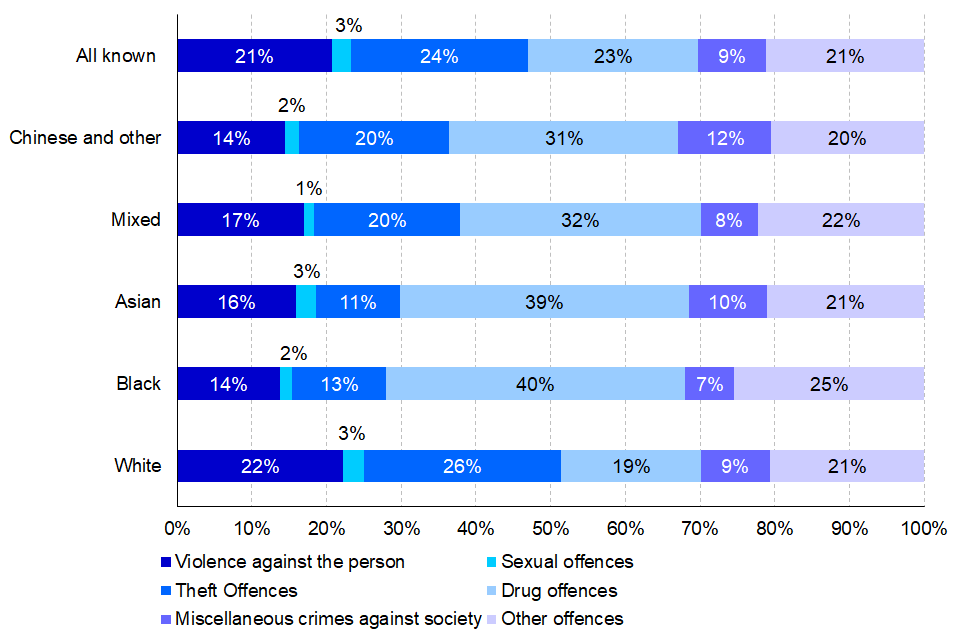
Convictions across indictable offence groups varied between ethnic groups in 2020, with drug offences accounting for the highest proportion of offenders within each ethnic group except for White offenders, where the highest proportion of convictions was for theft offences. Drug offences accounted for 40% of convictions for Black offenders, 39% for Asian offenders, 32% for Mixed ethnicity offenders, 31% for Chinese or Other ethnic groups, and 19% for White offenders.
Convictions by offence group may be influenced by factors other than ethnicity. For example, in 2020, 40% of all convictions of Black individuals were for drug offences. Many of these offences were dealt with in London by the Metropolitan police force, where greater levels of stop and search activity likely lead to increased arrests and subsequent charges for drug possession. See police activity chapter for more information on stop and searches.
Figure 5.02: Proportions of convictions for all ethnicities, by offence groups, 2020, England and Wales
5.3 Remands
As shown in figure 5.03, the Chinese or Other and Black ethnic groups were more likely to be remanded in custody at Crown Court in 2020, at 51% and 49% respectively.
Figure 5.03: Proportions of remand status by ethnic groups at Crown Court, 2020, England and Wales
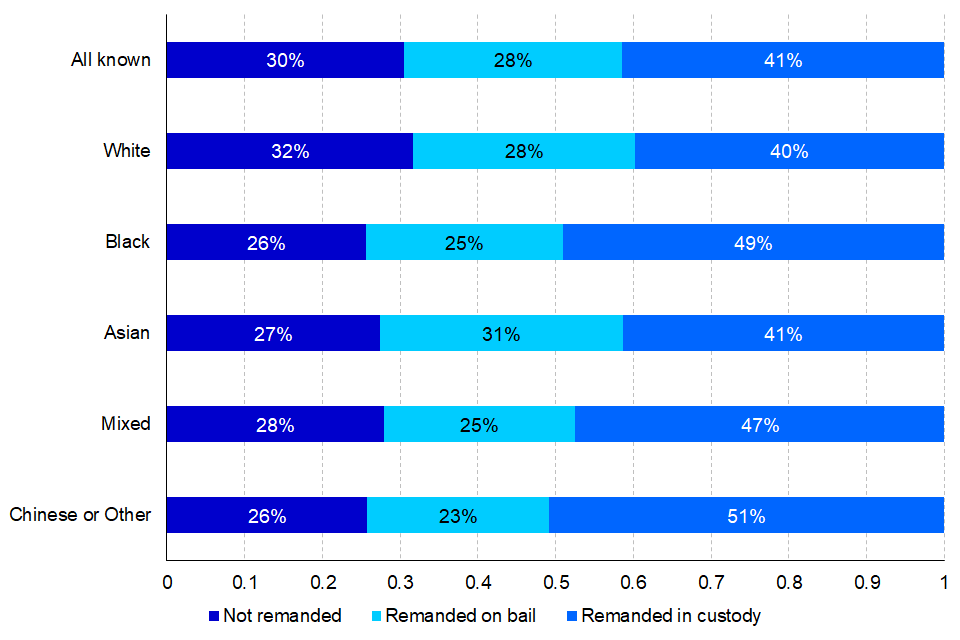
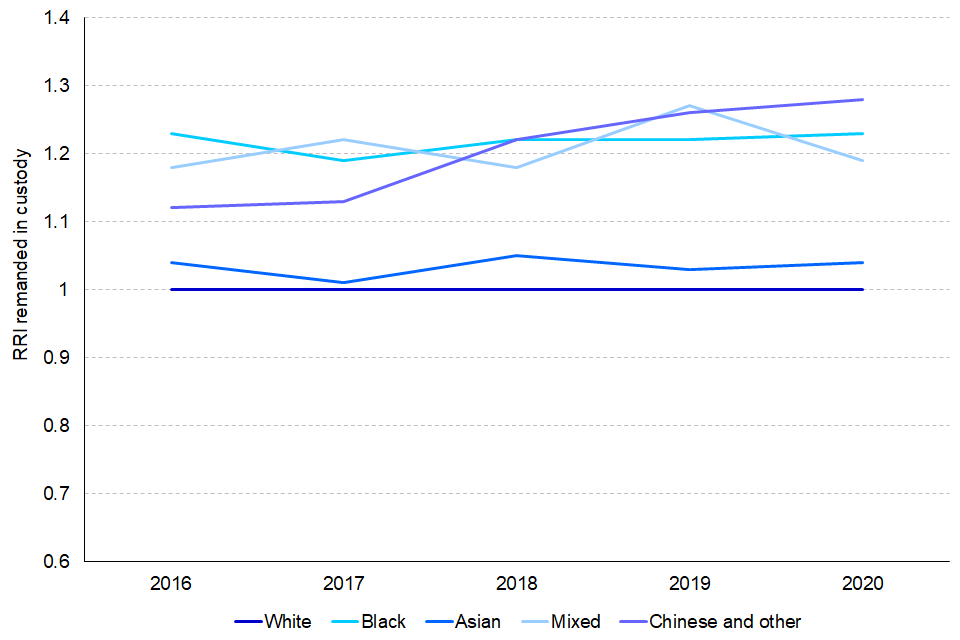
Relative Rate Index (RRI) analysis for individuals dealt with at Crown Court in 2020 showed that defendants of Chinese or Other ethnic group were 28% more likely, Black defendants 23% more likely, defendants of Mixed ethnicities 19% more likely and Asian defendants 4% more likely to be remanded in custody than White defendants (Table 5.15).
Figure 5.04: RRI of remands in custody at Crown Court, 2016-2020, England and Wales
In 2020, of all defendants remanded in custody for indictable offences at Crown Court, 77% were sentenced to immediate custody; an increase from 72% in 2016. Similar proportions were seen across ethnic groups, ranging from 72% for Black defendants to 78% for White defendants. Larger proportions of defendants from Black, Asian and Chinese or Other ethnic groups who were remanded in custody were acquitted or not tried (ranging from 13% to 15%) compared with defendants of White and Mixed ethnicities (9% and 10% respectively).
5.4 Pre-sentence Reports[footnote 39]
This section looks at the Pre-Sentence Reports (PSRs) received and the agreement (concordance) between recommendations made in PSRs and sentences issued at court, and whether they differ between ethnic groups.
Over the past five years, concordance rates[footnote 40] for immediate custodial sentences across all ethnic groups (excluding ‘Missing/Not Stated’) increased from 73% in 2016 to 90% in 2018, followed by a small decrease to 87% in 2020. In 2020, the ethnic group with the highest concordance rate with their PSR for immediate custodial sentences was the Mixed ethnic group, at 89%; this has remained consistent since 2018. Concordance rates for all PSR figures can be found in the defendants tables (5.14b)[footnote 41].
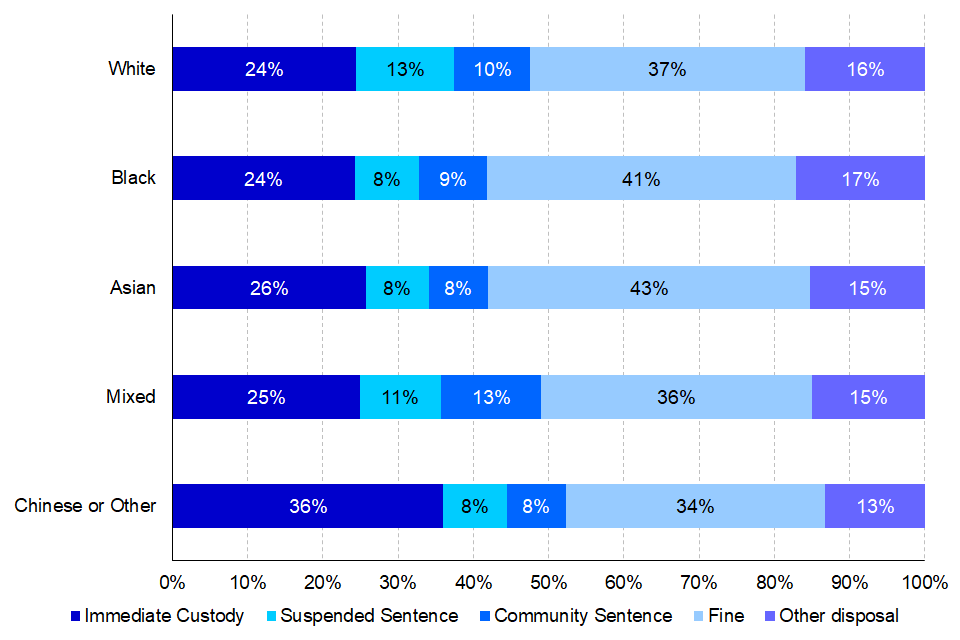
5.5 Sentencing Outcomes
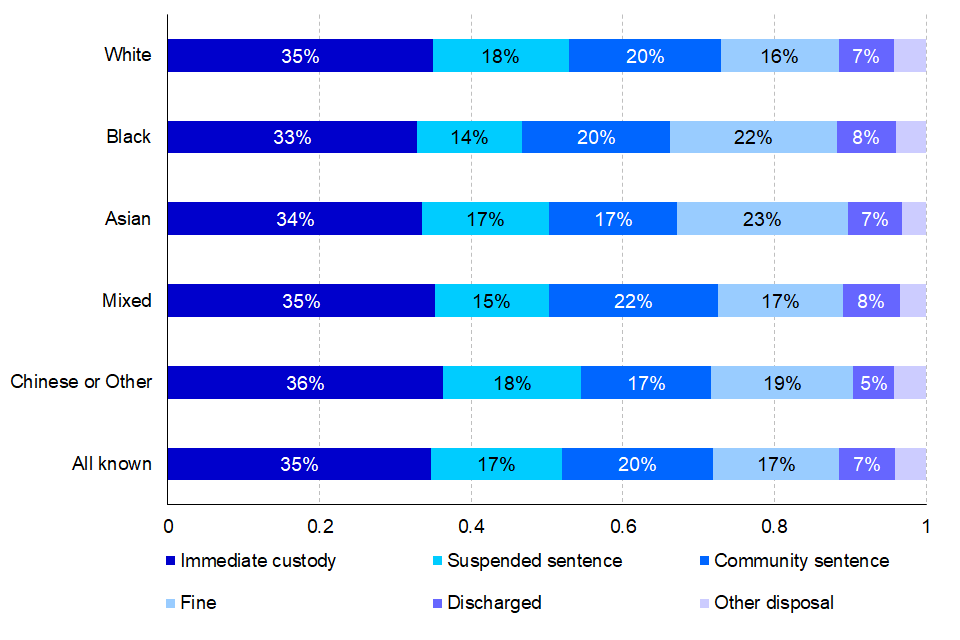
Over the past 5 years, the most common sentence given for indictable offences across all ethnic groups was immediate custody, accounting for 35% of all offenders sentenced in 2020 (where ethnicity is known). Sentencing outcomes across ethnic groups are heavily influenced by the offence mix; a major factor in determining sentencing outcomes. See figure 5.04 for all sentencing outcomes.
Individuals from the Black ethnic group were proportionally less likely to be sentenced to immediate custody in 2020. Individuals from the Black ethnic group also had the lowest proportion of suspended sentences, at 14% in 2020. Asian individuals had the highest proportion of fines given, at 23%, in comparison to White individuals (16%). Broadly, all ethnic groups had similar overall sentencing outcomes.
Figure 5.05: Percentages of sentencing outcomes for all ethnicities, 2020, England and Wales
Custody Rate[footnote 42]
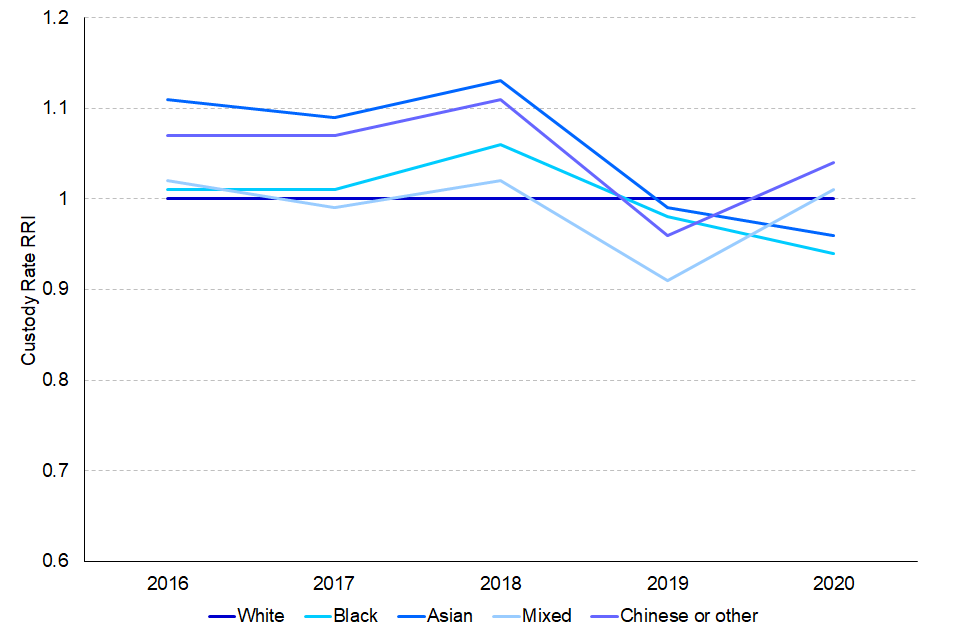
Over the past 5 years, custody rates have largely converged across ethnic groups. The most common sentence given for indictable offences across all ethnic groups was immediate custody, accounting for 35% of all offenders sentenced in 2020 (where ethnicity is known). The greatest increase in custody rate was seen in the White ethnic group, increasing from 29% to 35%, and Mixed ethnic groups (28% to 35%)[footnote 43]. Increases in custody rates in 2020 may be due to court prioritisation during the early stages of the Covid-19 pandemic, and it is difficult to know how this may have affected different ethnic groups. RRI analysis shows that defendants from Mixed and Chinese or Other ethnic groups were not significantly more or less likely to be sentenced to immediate custody compared to White defendants, and Black and Asian defendants were 6% and 4% less likely to be sentenced to immediate custody in comparison with White defendants respectively.
Figure 5.06: Relative Rate Index (RRI): The custodial sentencing rate for defendants expressed as a proportion of the of the overall sentencing rate for all defendants sentenced for indictable offences, 2016 to 2020, England and Wales
Average Custodial Sentence Length (ACSL)
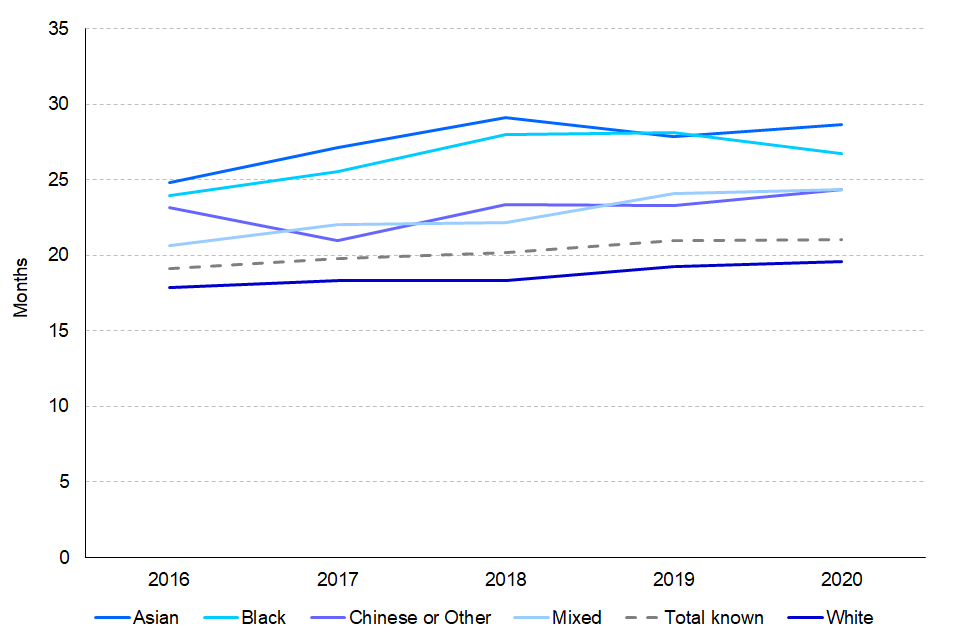
The ACSL for indicatable offences[footnote 44] has gradually increased over the past 5 years, from 19.0 months in 2016 to 21.0 months in 2020[footnote 45]. ACSL was consistently lower for White defendants from 2016 to 2020, at 19.6 months in 2020, compared to 28.6 for Asian defendants (46% longer), 26.8 for Black defendants (37% longer), and 24.4 for both defendants of Mixed and Chinese or Other ethnicity groups (25% longer). The difference in ACSL can be attributed to a range of factors, including the varying offence mix across ethnic groups (see figure 8.01). The lower ACSL for White defendants may be a result of a higher percentage of guilty plea rates for this ethnic group, resulting in shorter custodial sentences.
Figure 5.07: The average custodial sentence length in months for offenders sentenced to immediate custody for indictable offences at all courts, by ethnicity, 2016 to 2020, England and Wales.
5.6 Crown Court cases
Guilty plea
The guilty plea rate (GPR) of defendants who were committed for trial at Crown Court increased across all ethnic groups from 2018-2020. This overall increase in guilty plea rates of defendants dealt with in the latest year is due to restrictions courts faced on progressing jury trials (not-guilty pleas) as a result of the response to COVID-19. Across the past 5 years, White defendants consistently had the highest guilty plea rate, at 79% in 2020, followed by defendants of the Mixed ethnic group at 73%, Chinese or Other ethnic groups at 72%, Asian at 68% and Black defendants at 66%.
RRI analysis showed that White defendants were more likely than all other ethnic groups to plead guilty at Crown Court. For example, in 2020, Black defendants were 16% less likely to enter a guilty plea than White defendants in Crown Court [footnote 48].
Figure 5.08: Relative Rate Index (RRI): Defendants who entered a guilty plea per all that entered a plea at Crown Court, 2016 – 2020, England and Wales.
Election of defendants to Crown Court
In 2020, the Black ethnic group had the highest proportion of defendants electing themselves to be heard at a Crown Court, at 20%. This was followed by defendants from the Chinese or Other ethnic groups (16%), Asian defendants (14%), Mixed defendants (12%) and White defendants (12%). This trend has remained relatively stable over the past 5 years, with the Black ethnic group consistently having the highest proportion of defendants electing themselves to be heard at Crown Court. Lower GPRs of defendants from minority ethnic groups will likely be related to the higher proportion deciding to elect to be tried by a jury at Crown Court.
Representation at Crown Court
When defendants appear in court, they have the right to either speak for themselves, or to be represented and to have someone with legal expertise speak on their behalf. Across all ethnic groups, the majority of defendants dealt with at Crown Court are represented at their first hearing, ranging from 91% to 94% across ethnic groups in 2020. These proportions have remained relatively stable across the past 5 years.
Crown Court timeliness
The average number of days spent ‘at court’ (from first listing in magistrates’ courts to completion in Crown Court) for defendants dealt with in Crown Court cases varies across ethnicities. In 2020, White defendants spent the lowest mean number of days (156) at court, while defendants from Chinese or Other ethnic groups had the highest (199). Time spent at court increased in 2020 from previous years for all ethnic groups and offences, due to restrictions in response to COVID-19[footnote 47].
5.7 Criminal legal aid
Criminal legal aid consists of legal advice and representation provided to people being investigated or charged with a criminal offence. Criminal legal aid can be split into two categories, crime higher and crime lower[footnote 48].
Crime lower
In 2020, 76% of crime lower legal aid workload was for White clients, with 7% for Black, 7% for Asian, 7% for Other and 3% for clients from Mixed ethnic groups. These proportions have remained relatively stable over the last 5-year period.
A larger proportion of White defendants (24%) received representation at magistrates’ court compared to all other ethnic groups, with the lowest proportion at 16% for Asian defendants. The trend is the reverse for pre-charge advice at police stations, where 82% of Asian defendants received pre-charge advice compared to 74% of White defendants.
Crime higher
In 2020, 79% of crime higher legal aid workload was for White clients, with 10% for Black, 8% for Asian, and 3% for Mixed clients. These proportions have remained relatively stable over the last 5 years. The largest proportion of crime higher workload is for offences which can be tried either before the magistrates’ court or the Crown Court, at 50% overall where ethnicity is known in 2020 and ranged between 46% and 52% when broken down by ethnic group. Compared to ethnic minority groups, White clients had a higher proportion of representation at committals for sentence at 22%, whereas 15% of Asian and Black clients and 16% of Mixed were represented at committals. Conversely, higher proportions of clients from ethnic minority groups received representation for indictable trials at 30% for Asian, 36% for Black and 36% for Mixed compared to 27% for White.
Prison representation
In 2020, 70% of the legally aided prison law workload related to White defendants, 11% to Black, 8% to Other, 6% to Mixed and 5% to Asian. These proportions were similar to those of the ethnic breakdown of the prison population.
6. Offender Management
A greater number of children in prison were from minority ethnic groups
In 2020, 32% of children in prison were Black despite Black prisoners accounting for only 13% of the entire prison population. In contrast, despite White prisoners making up 73% of the entire prison population, only 47% of prisoners aged under 18 were White.
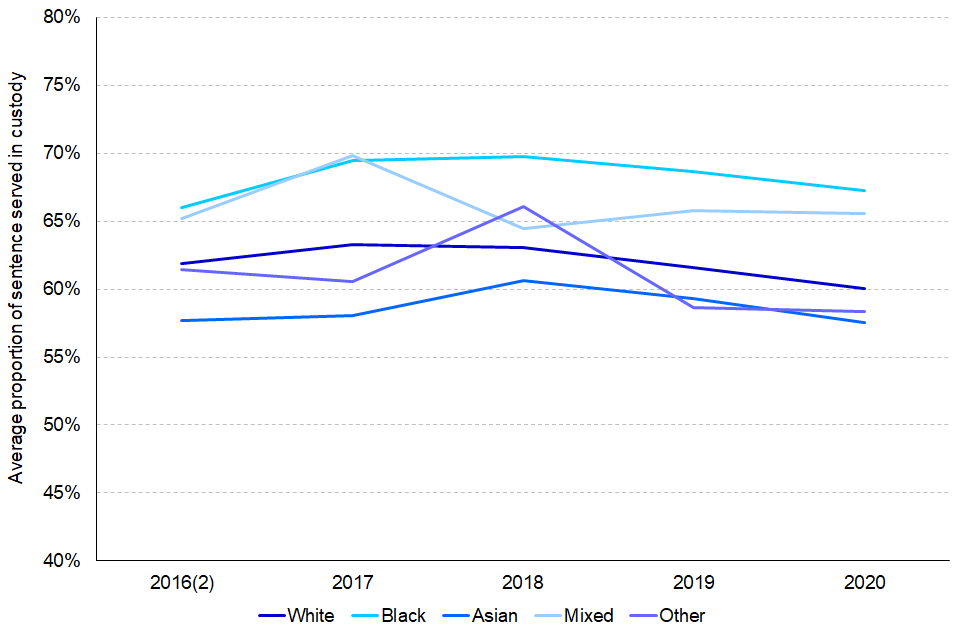
Black prisoners served the greatest proportion of their original sentence in custody
In line with previous years, Black defendants continued to serve a greater proportion of their original determinate sentence in custody (67% in 2020) when compared with Mixed (66%) White (60%), Asian (58%) and prisoners from Other ethnic groups (58%).
In the 2020/21 HM Inspectorate of Prisons survey, prisoners from ethnic minority groups reported more negative results across the survey.
In comparison to all other ethnic groups, higher proportions of White prisoners reported more positive experiences, including feeling respected by staff, feeling safe from COVID and having enough cleaning facilities.
This chapter provides statistics relating to offenders in custody or under supervision in the community. Much of this information has previously been published in the Offender Management statistics quarterly publication, where statistics on adjudications, Home Detention Curfew, Release on Temporary Licence and Licence Recalls can also be found.
Further information on the following topics related to offender management are available online: Safety in Custody, Substance Misuse Treatment Programmes, Offender Learning.
The HMPPS Offender Equalities report 2020/21 also includes information on: Mother and Baby units, Sexual Orientation in the Prison Population, Transgender Prisoners, Accredited Programmes, Incentives and Earned Privileges and Electronic Monitoring.
6.1 Prison Population
The total prison population in England and Wales was 79,000 on 30th June 2020, the lowest in 14 years. The proportions of ethnic groups in the prison population has remained stable across the past 5 years. In 2020, of prisoners whose ethnicity was known[footnote 49], 73% were White, 13% Black, 8% Asian, 5% Mixed and 1% from Other ethnic groups.
The ethnicity of prisoners varied across age groups, with a higher proportion of younger prisoners being from minority ethnic groups (53% of under 18-year olds). In contrast, 85% of prisoners aged 50 or over were White.
Figure 6.01: Number and proportion of prisoners in England and Wales, 2016 to 2020, by ethnicity
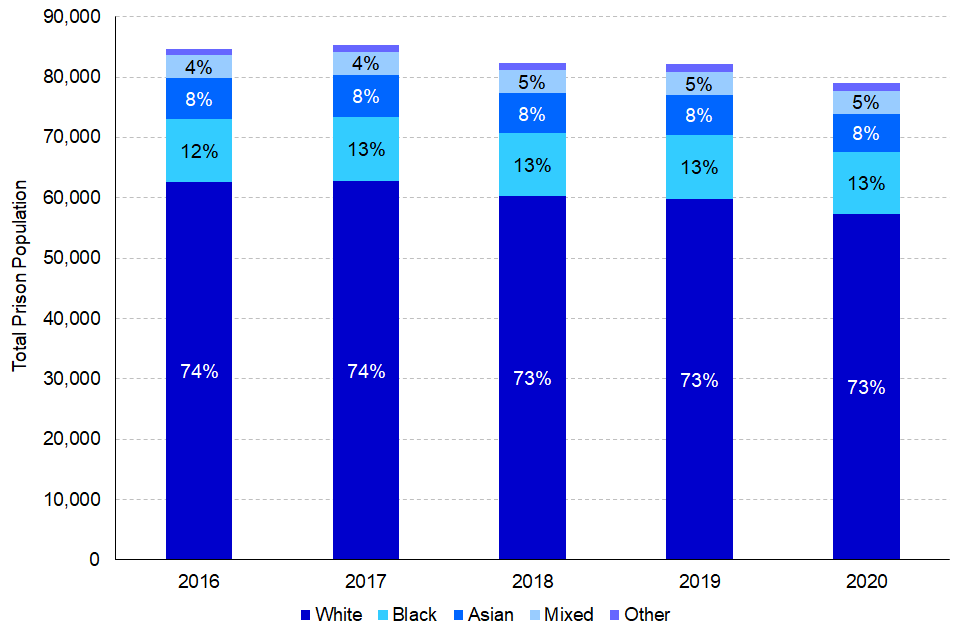
Figure 6.02: Proportion of prisoners by ethnicity and age group, England and Wales, 30th June, 2020
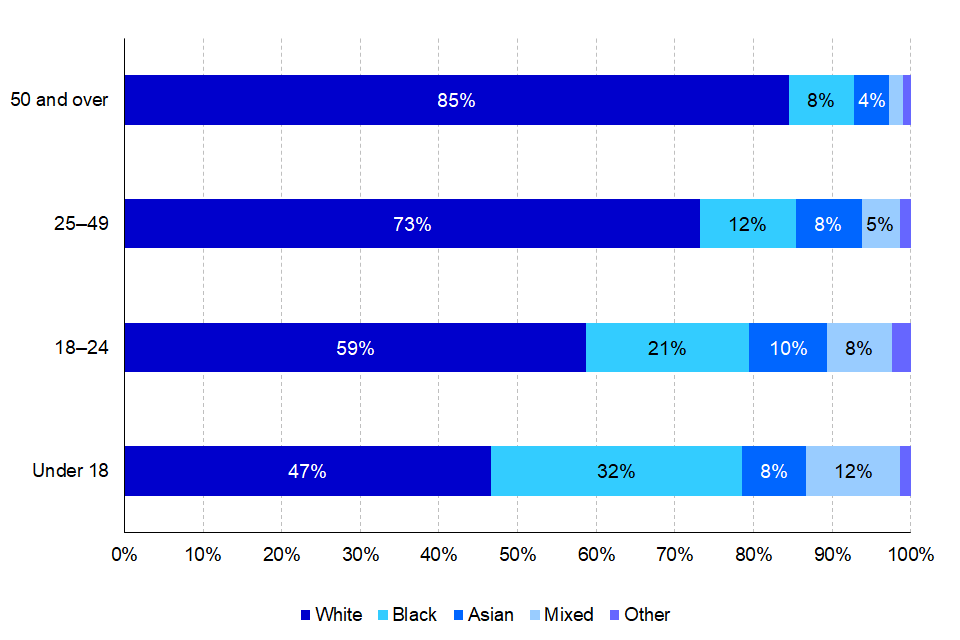
In 2020, Black offenders made up 32% of the prison population for under-18-year olds, despite accounting for only 13% of the whole prison population. Similarly, prisoners of Mixed ethnic groups made up 12% of all prisoners under 18, yet only accounting for 5% of the entire prison population. Black and Mixed ethnicity prisoners were disproportionately represented across all younger age groups, making up 21% and 8% respectively of all prisoners aged under 25.
6.2 Proportion of custodial determinate sentence served
As observed in Chapter 5, White prisoners have consistently received the shortest ACSL in comparison to other ethnic groups. This section looks at the proportion of determinate[footnote 50] sentence served[footnote 51].
Asian prisoners, on average, served the smallest proportion of their original sentence, serving 58% of their determinate sentence in custody in 2020; a trend that has remained stable since 2016. In contrast, across all years (except 2017), Black prisoners have consistently served a higher proportion of their determinate sentence, at 67% in 2020. Proportion of sentence served is affected by factors such as offence mix and behaviour in prison. See table 6.02 for all proportions of determinate sentences served.
Figure 6.03: Average proportion of determinate sentence served in custody, by ethnicity, England and Wales, 2016 to 2020
6.3 Prison Experience
Her Majesty’s Inspectorate of Prisons for England & Wales (HMI Prisons) aims to ensure independent inspection of places of detention, report on conditions and treatment, and promote positive outcomes for those detained and the public. The HMI Prisons Annual Report 2020-21 identifies differences in reported prison experiences between racial groups[footnote 52][footnote 53].
High proportions of prisoners from all ethnic groups reported that they knew what the COVID restrictions were in the prison and that reasons for restrictions had been explained to them. Despite this, only 49% of prisoners from Mixed ethnic groups felt that they had been kept safe from the virus, in comparison to 65% of White prisoners.
White prisoners reported more positive experiences on their wing/houseblock compared to prisoners of other ethnicities, with 90% of White prisoners reporting that they could shower every day, in comparison with 80% of Black prisoners.
White prisoners reported more positive relationships with staff, with 80% reporting feeling that they were treated with respect by staff, in comparison to 63% of prisoners from Mixed ethnic groups. A higher proportion of prisoners from ethnic minority groups reported experiencing a type of bullying/victimisation from staff in the prisons, at 46% for Black and Mixed prisoners, 44% for Asian, and 43% for prisoners of Other ethnic groups, compared to 30% of White prisoners. In contrast, fewer Black (15%), Mixed (18%) and Asian (20%) prisoners reported bullying/victimisation from other prisoners, compared to prisoners from White (23%) and Other ethnic groups (24%).
6.4 Parole board[footnote 54]
The parole board carry out risk assessments on prisoners to determine whether they can be safely released into the community. Recommendations can also be made for a prisoner to remain in the open prison estate.
In the year ending March 2021, there were 5,777 oral parole board hearings where ethnicity was recorded[footnote 55]. Of these, 79% were White, 12% Black, 4% Asian, 4% Mixed ethnicity, and 1% Chinese or Other ethnicities. These proportions have remained stable across the past 5 years.
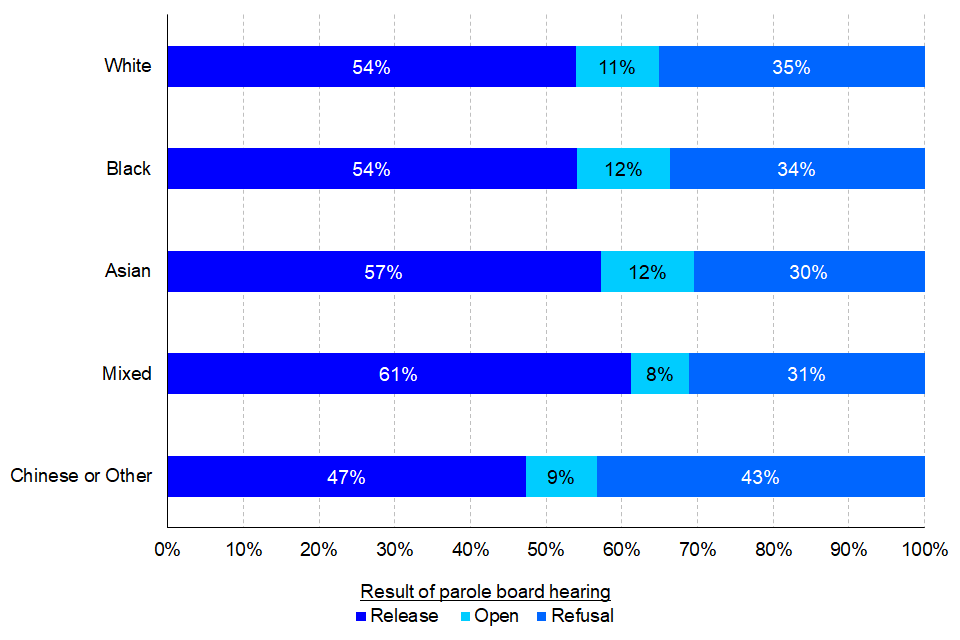
The proportion of White, Black and Asian offenders that received an oral parole hearing in the year ending March 2021 remained relatively stable with a range of 54-57% receiving a release result, 11-12% remain in open prison estate, and 30-35% refusal of release. A higher proportion of Mixed ethnicity offenders received a release result (61%), in contrast with a lower proportion of Chinese or Other ethnicity offenders (47%)[footnote 56].
Figure 6.04: Outcomes of Parole Board hearings, year ending March 2021, England and Wales, by ethnicity
6.5 Probation
The Probation Service supervises offenders living in the community under a court order[footnote 57], including those starting supervision as a result of a community or suspended sentence and those who have been released from prison on licence.
In 2020, where ethnicity was known, the number of requirements started under community orders fell to 72,400[footnote 58]; a decrease of 33% since 2018. A 21% decrease was seen in requirements started under suspended sentence orders. These decreases are mainly due to court restrictions as a result of COVID-19^59]. Of offenders receiving either type of order, 84% were White, 6% Black, 5% Asian, 3% Mixed ethnic groups and 1% Chinese or Other ethnic groups. These proportions have remained relatively stable when compared to 2018.
Figure 6.05: Requirements commenced under community orders and suspended sentence orders by ethnicity and requirement, England and Wales, 2020
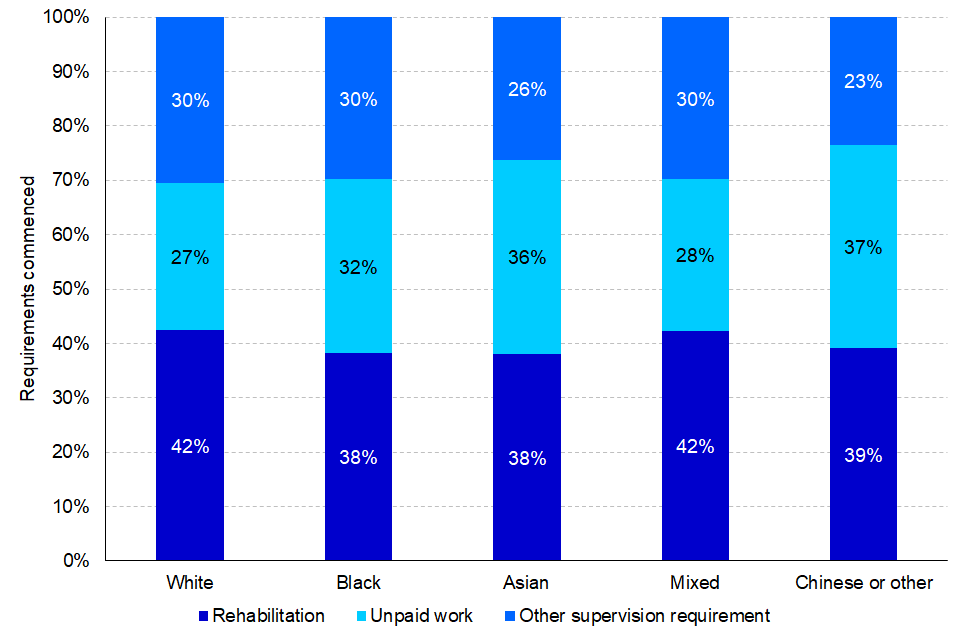
Of those who received a suspended sentence order, higher proportions of White and Mixed ethnicity offenders received rehabilitation requirements[footnote 60], whereas higher proportions of Black, Asian and Chinese or Other ethnicity offenders received unpaid work requirements.
Of the 63,100 offenders supervised on post release licence in 2020[footnote 61], the proportions across ethnic groups remained in line with that of the previous 5 years, 76% were White, 11% Black, 7% Asian, 4% Mixed and 2% Chinese or Other ethnicities. A small proportional decrease of White offenders was observed, with a decrease of 2 percentage points since 2016.
7. Offender characteristics
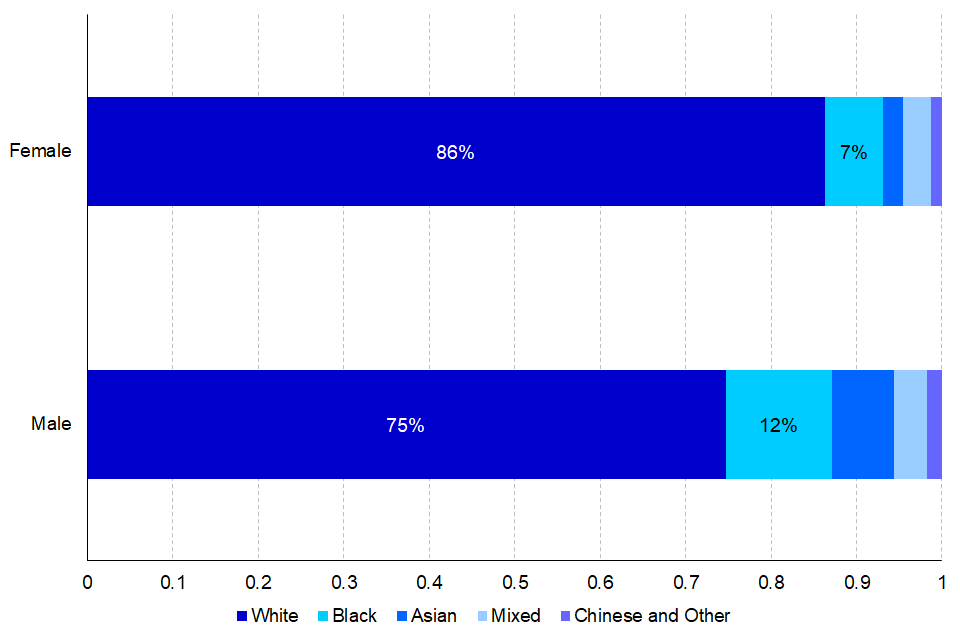
In 2020, of all males prosecuted for an indictable offence 75% were White, whilst for all females prosecuted 86% were White.
Black males accounted for 12% of all male prosecutions, compared to Black females, accounting for 7% of all female prosecutions.
A higher proportion of prosecutions for Black and Mixed ethnic groups were against children, 12% and 14% respectively, compared to 5% for White defendants.
In 2020, minority ethnic children also had a higher proportion remanded in custody, had a higher custody rate and received on average longer custodial sentences.
The reoffending rate of adults was highest for those aged 18-20 for ethnic minority groups.
The reoffending rate for Black adult offenders was highest for 18-20 year olds at 35%. For White adult offenders, the reoffending rate was highest for those aged 35-39 at 35%.
This chapter looks at the interaction between ethnicity, sex, age, offending history, and reoffending throughout the Criminal Justice System[footnote 62].
7.1 Sex
Prosecutions and convictions
For indictable offences, ethnic minority groups accounted for a higher proportion of male prosecutions and convictions compared to females. In 2020, Black males accounted for 12% of all male prosecutions and 11% of all male convictions, compared to Black females, accounting for 7% of all female prosecutions and 7% of all female convictions. Similarly, Asian males accounted for a higher proportion of all male prosecutions and convictions at 7%, compared to Asian females, accounting for 2%, of all female prosecutions. These proportions have remained broadly consistent across the last 5 years.
Figure 7.01: Proportion of prosecutions for Indictable offences by sex and ethnicity, England and Wales, 2020
Average Custodial Sentence Length (ACSL)
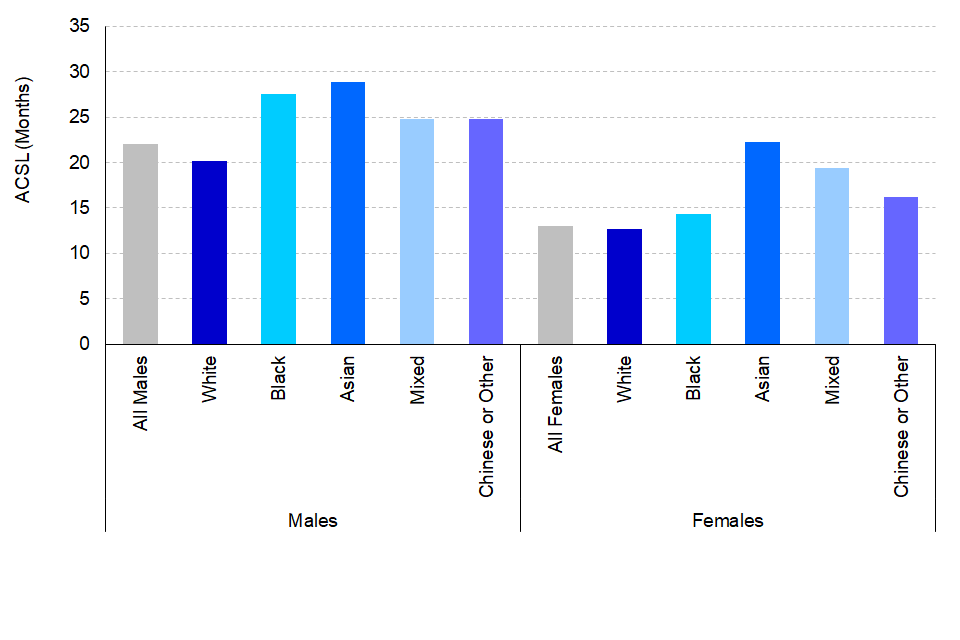
In 2020, White male and female offenders had the shortest ACSL, 20.2 months and 12.6 months respectively, while Asian male and female offenders had the longest ACSL, 28.9 months and 22.3, respectively.
The ACSL, for indictable offences, for male offenders has increased over the last five years for all ethnic groups. The ACSL has been consistently lower for White male offenders than all ethnic minority groups, a disparity that has increased over the last 5 years for male offenders.
Figure 7.02: Average custodial sentence lengths (ACSL) for indictable offences, by sex and ethnicity, England and Wales, 2020
7.2 Age
Prosecutions
Figure 7.03: Age of defendant proceeded against at court for indictable offences by ethnicity, England and Wales, 2020
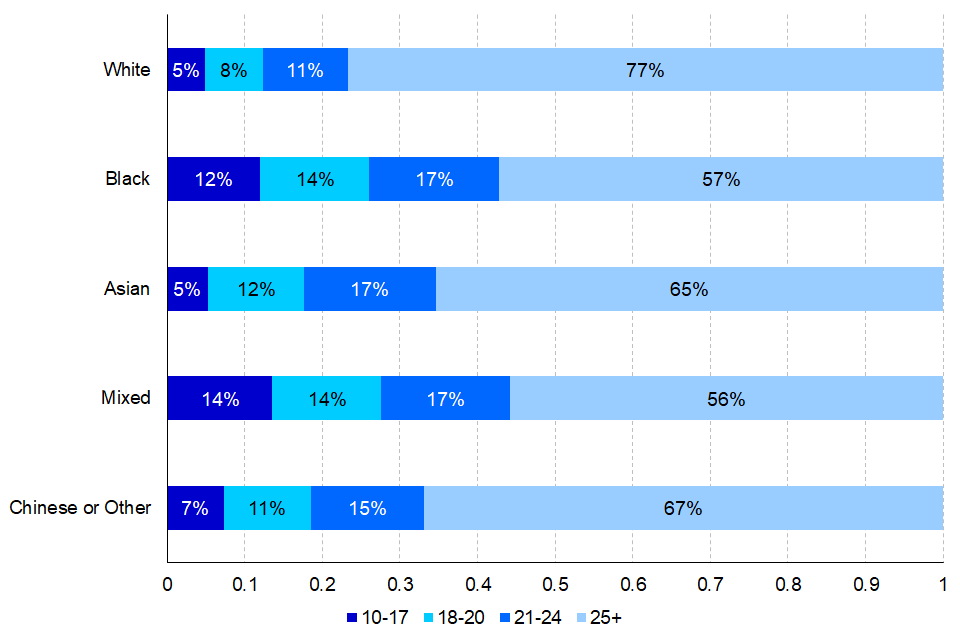
In 2020, a higher proportion of prosecutions of Black and Mixed defendants were against children, 12% and 14% respectively, compared to 5% of White defendants[footnote 63].
In the last 5 years, the numbers of children prosecuted for indictable offences has fallen for all ethnic groups, however, the proportion of children from Black, Mixed and Chinese or Other ethnic groups has increased collectively from 33% in 2016 to 39% in 2020.
Remands
In 2020, children from the Black ethnic group had a higher proportion of defendants remanded in custody at Crown Court, at 55%, compared to children from the White ethnic group (45%). Due to the small population of children from Asian, Mixed and Chinese or Other ethnic groups they are subject to greater variance across the years and have therefore been omitted from this comparison. The proportion of White children remanded at Crown Court has been increasing over the last 5 years from 26% in 2016 to 45% in 2020, converging with the proportion of children remanded in custody from minority ethnic groups.
Custody Rate and Average Custodial Sentence Length (ACSL)
Due to the small population of children sentenced to immediate custody from Asian, Mixed and Chinese or Other ethnic groups trends should be viewed with caution. The custody rate for White children was consistently lower than for Black children (by 3 to 5 percentage points, pp) between 2016 and 2020.
Over the last five years the proportion of children from ethnic minority groups sentenced to immediate custody has increased from 36% in 2016 to 43% in 2020. In comparison, the proportion of adults from ethnic minority groups sentenced to custody has remained stable at 20% between 2016 and 2020.
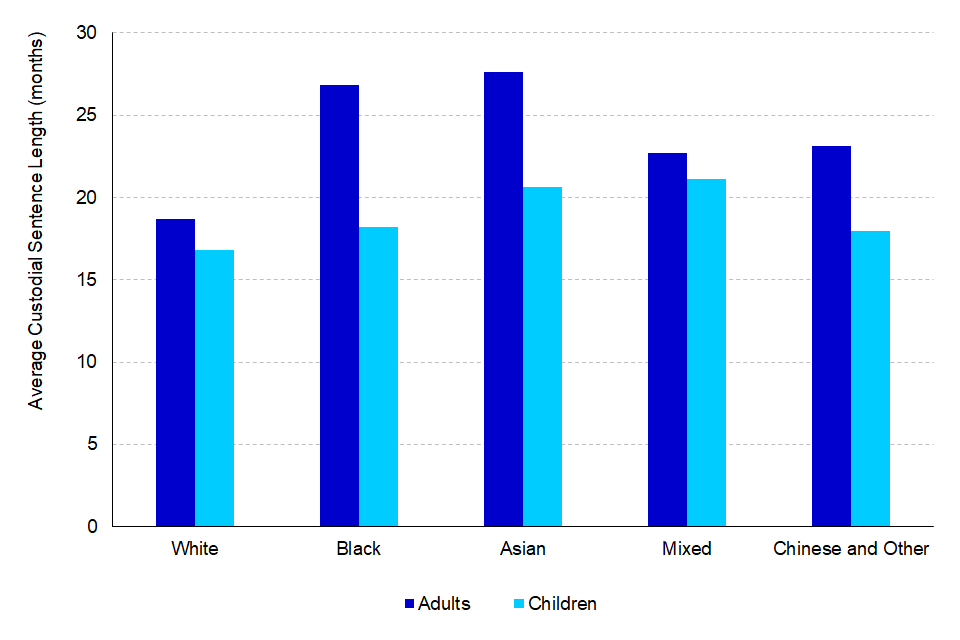
Of all children sentenced to immediate custody in the last 5 years, White children had the shortest ACSL at 16.8 months and Mixed children had the longest ACSL at 21.1 months. The ACSL for Asian children was 20.6 months, 18.2 months for Black children and 18 months for Chinese or Other children.
Figure 7.04: Average custodial sentence length (ACSL) for indictable offences, by age and ethnicity, England and Wales, 2016/20
7.3 Offender Histories
Where ethnicity was known, first time offenders[footnote 64] accounted for 16% of all adult offenders cautioned or convicted for an indicatable offence in 2020. Asian and Chinese or Other[footnote 65] offenders had a higher proportion of first-time offenders at 23% and 35% respectively, compared to White and Black offenders at 16% and 14% respectively[footnote 66].
A higher proportion of White offenders had a long history of offending, 35% of White offenders had 15 or more previous convictions or cautions, compared to Black offenders at 26%, Asian offenders at 16% and Chinese or Other at 9%, for adults [footnote 67].
Similarly, for children, a higher proportion of child offenders in the Asian and Chinese or Other ethnic groups were first time offenders. In 2020, 59% of Asian child offenders had no previous offender history, compared to 50% for White, 47% for Black and 57% for Chinese or Other children. In 2020, 1% of children had long criminal histories, this was similar across all ethnic groups.
7.4 Proven reoffending
A proven reoffence is defined as any offence committed in a one-year follow-up period that resulted in a court conviction, caution, reprimand or warning in this timeframe, or a further six-month waiting period to allow the offence to be proven in court[footnote 68].
Adults
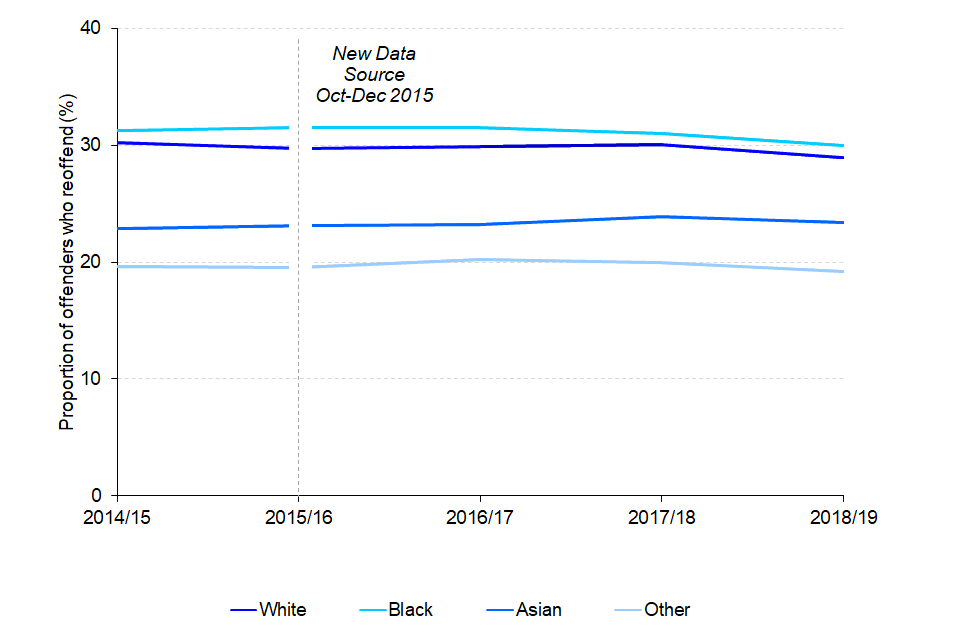
In the 2018/19 cohort, the reoffending rate for adults was highest for Black offenders at 30%, 29% for White offenders, 23% for Asian offenders and 19% for Other offenders. Whilst the reoffending rate for Black offenders was highest, White reoffenders had the highest average number of reoffences per reoffender at 4.1 reoffences. This was followed by Black (3.5), Asian (3.3) and Other ethnic groups (3.2).
Figure 7.05: Proven reoffending rate by ethnicity for adults, annual averages (2014/15 to 2018/19), England and Wales.
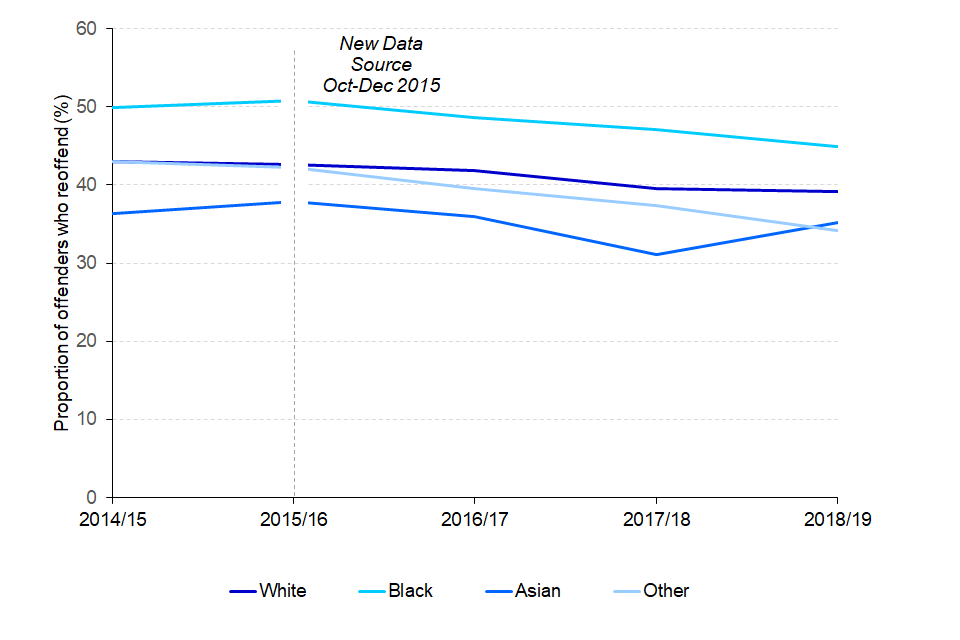
The proportion of offender reoffending by age was highest for those aged 18 to 20 for Black, Asian and Other offenders. In contrast, for White offenders those aged 35 to 39 had the highest proportion of offenders reoffending.
Figure 7.06: Adult reoffending rate by age group and ethnicity, April 2018 to March 2019 offender cohort, England and Wales
Children
The reoffending rate was highest for children across all ethnic groups compared to adults. The reoffending rate among children was higher for the Black ethnic group at 45% and has consistently been higher over the last five years than the White (39%), Asian (35%) and Other (34%) ethnic groups.
In the latest year, the Other ethnicity for children had the highest average number of reoffences per reoffender at 4.5, followed by White (4.1), Black (3.5), and Asian (3.4) average number of reoffences.
Figure 7.07: Proven reoffending rate by ethnicity for children, annual averages (2014/15 to 2018/19), England and Wales
7.5 Educational background of young offenders in Key Stage 4 (KS4)[footnote 69]
Findings from a data sharing exercise between the MoJ and the Department for Education (DfE) are presented here, with analysis on a matched cohort of those who were in year 6 in either 2008/09 or 2009/10 and who were aged ten at the start of those academic years[footnote 70]. To avoid inconsistency in the length of their offending histories, for those with an academic year of 2008/09 their offending data has been considered up to 31 August 2016 and for those with an academic year of 2009/10 it has been considered up to 31 August 2017.
The following analysis cannot be used to make conclusions about the overall pupil population that have the characteristics described as the matched dataset is of offenders only[footnote 71].
This analysis compares the police identified ethnicity in the matched young offender cohort by total sentence/cautioned and those sentenced to custody (12 months or less and more than 12 months). For those sentenced to custody, where there are differences between groups that are statistically significant to the 95% level, this will be stated. Where differences are not referred to as being statistically significant these are either not statistically significantly different, or differences have not been tested.
Educational attainment Key Stage 4
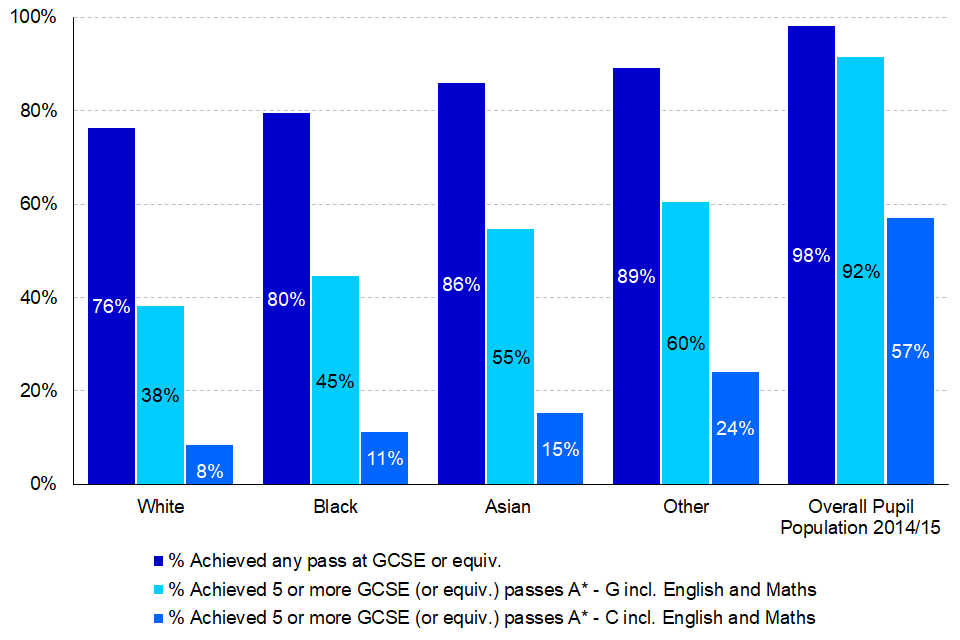
Educational attainment of all young offenders was lowest for the White ethnic group and highest for the Other ethnic group. This was largely consistent across all disposal types and all three measures of attainment; however, caution should be taken when breaking down proportion achieving 5 or more GCSEs A*-C by disposal type due to the small population[footnote 72].
Educational attainment of those sentenced to custody was lower than the attainment of all young offenders. The proportion of Black and Asian young offenders, sentenced to custody, achieving any pass at GCSE or 5 GCSEs A*-G was significantly higher than the proportion of White young offenders. For example, the proportion of Black and Asian young offenders sentenced to 12 months custody or less, achieving any pass at GCSE, was 64% and 71% respectively, significantly higher than the proportion of White young offenders, at 53%.
Figure 7.08: Proportion of young offenders matched to a KS4 attainment record in academic years 2013/14 and 2014/15, by ethnicity, in England (Source: Table 7.1 and Table CH1)
Pupil characteristics
In this section, all analysis looks at those in the matched offender cohort who were eligible for Free School Meals (FSM) and/or had Special Education Needs (SEN), at any point during KS4.
Free School Meals (FSM)[footnote 73]
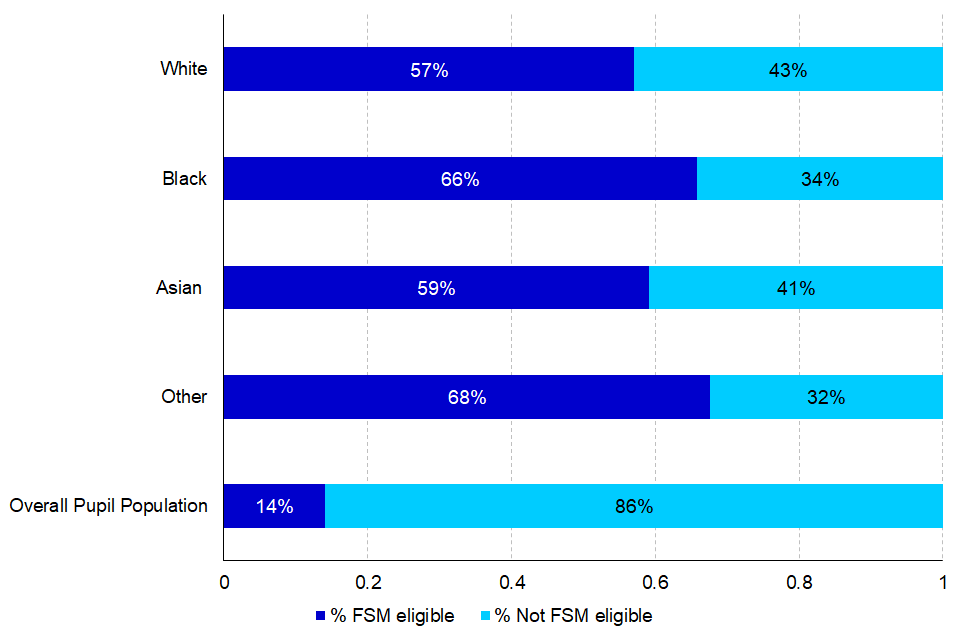
Where ethnicity was recorded in the data, for all young offenders sentenced or cautioned, over half were eligible for FSM: White (57%), Black (66%), Asian (59%), and Other (68%). This contrasts with the proportion of pupils in the overall population where 14% are eligible for FSM.
Where young offenders received a custodial sentence, the proportion eligible for FSM increased across all ethnic groups. The proportion of Black young offenders eligible for FSM (72%) sentenced to more than 12 months in custody was significantly higher than the proportion for White young offenders (62%).
Figure 7.09: Proportion of young offenders matched to a KS4 academic year of 2013/14, 2014/15, known to be eligible for Free School Meals by ethnicity, in England (Source: Table 7.2 and Impact Indicator 3.8)[footnote 74]
Special Educational Needs (SEN)[footnote 75]
Over half of young offenders sentenced or cautioned had SEN. The highest proportion of offender with SEN with statement was highest for the White ethnic group (18%) and the highest proportion of offenders with SEN without statement was highest for the Other ethnic group (68%)[footnote 76]. The Black ethnic group had the highest proportion of young offenders with SEN at 79%, combining SEN with statement and without statement.
Figure 7.10: Proportion of young offenders who finished Key Stage 4 in either 2013/14 or 2014/15 with Special Educational Needs, by ethnicity, in England (Source: Table 7.3 and Table CH2c)[footnote 77]
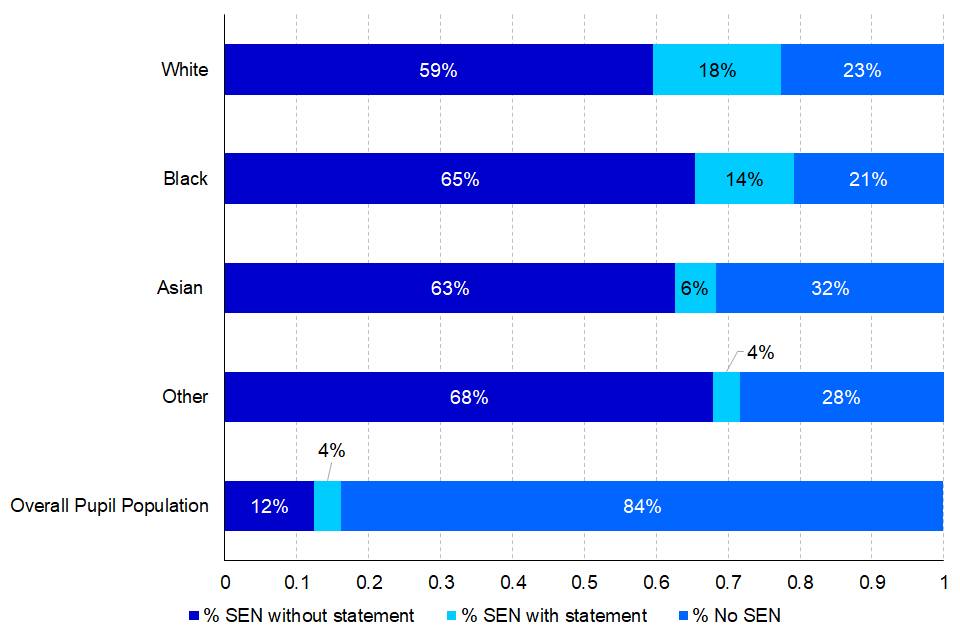
Where young offenders were received a custodial sentence of more than 12 months, Black and Asian children had a higher proportion of SEN, without statement, at 72% and 74% respectively, compared to White children, at 59%. A significantly higher proportion of Black offenders with SEN, without statement, received a 12-month sentence or less (71%), compared to White offenders (60%).
Persistent absence and exclusion
The matched cohort data also provided information on the proportion of those sentenced/cautioned that have a history of being persistently absent from school, have a previous record of being permanently excluded from school, or have received a suspension, at any point during KS4.
Persistent absence[footnote 78]
Of the total sentenced or cautioned, White young offenders had the highest proportion recorded as persistently absent at 83%. Other young offenders had the lowest proportion recorded as persistently absent at 66%.
The proportion of young offenders persistently absent was higher for White, Black and Asian ethnic groups receiving a custodial sentence compared to the total sentenced/ convicted. Where young offenders received a custodial sentence, the proportion of White offenders persistently absent was significantly higher than the proportion of Black offenders, both for custody for 12 months or less (by 7pp) and for more than 12 months (by 11pp).
Exclusions
Overall, of the young offenders sentenced/ cautioned, a larger proportion of Black offenders (18%) had been permanently excluded, compared to White (14%), Asian (9%) and Other (9%) offenders[footnote 79]. This trend is similar across all disposal types.
Similarly, a higher proportion of Black young offenders (83%) had been recorded as being suspended, compared to White (79%), Asian (74%) and Other (74%) offenders[footnote 80].
8. Offence analysis
Controlling for offence mix across ethnic groups showed reduced disparity in Average Custodial Sentence Lengths and Custody Rates.
When offence mix was controlled for, a decrease in ACSL was seen for all ethnic groups, closer to that of the White ethnic group.
The ACSL for possession of weapons offences fell by 41%, between 2016 and 2020, for Asian offenders and 23% Black offenders.
ACSL for possession of weapons offences decreased between 2016 and 2020 for all ethnic groups except Mixed, decreasing the largest for Asian and Black offenders.
In 2020, Asian offenders had the longest ACSL for drug offences, at 46.2 months.
Asian offenders had a longer ACSL for drug offences compared to all other ethnic groups, which ranged from 31.8 to 39.8 months.
Of defendants prosecuted for sexual offences at Crown Court, Black defendants were more likely to be remanded in custody.
In 2020, 52% of Black defendants were remanded in custody, compared to 36% of White defendants. This trend has fluctuated across the past 5 years.
This chapter looks at particular indictable offences to investigate the relationship between ethnicity and court outcomes. It investigates the differences between ethnic groups[footnote 81] for these offences, and whether this picture has changed over time. The following offence groups will be of particular focus:
- Possession of Weapons Offences
- Drug Offences
- Sexual Offences
As noted in the introduction, comparisons across ethnic groups do not account for previous offending history, detailed offence mix and other offender characteristics and that should be considered when interpreting results in this section.
It is important to note when looking at more detailed offences that the Chinese or Other ethnic group accounted for only 2% of all prosecutions and convictions in 2020, therefore small changes in offending can lead to artificially high apparent increases/decreases in associated rates and percentages.
We have crudely attempted to control for different offence mixes across ethnic groups by applying a similar pattern of offences being sentenced across all ethnic groups, fixing this to the White group. Although it is impossible to make it perfectly consistent, this will reduce the differences in types of offending and enable a more comparable comparison across groups.
When controlling for offence mix across ethnic groups, a decrease in ACSL was observed across all ethnic groups. The greatest difference was observed in the Asian ethnic group, where controlling for offence mix resulted in a 19% decrease in ACSL, from 28.6 to 23.1 months. This highlights that controlling for offence mix reduces the disparity between ethnic groups.
Figure 8.01: Comparison of ACSL before and after controlling for offence mix, all indictable offences, 2020, England and Wales.
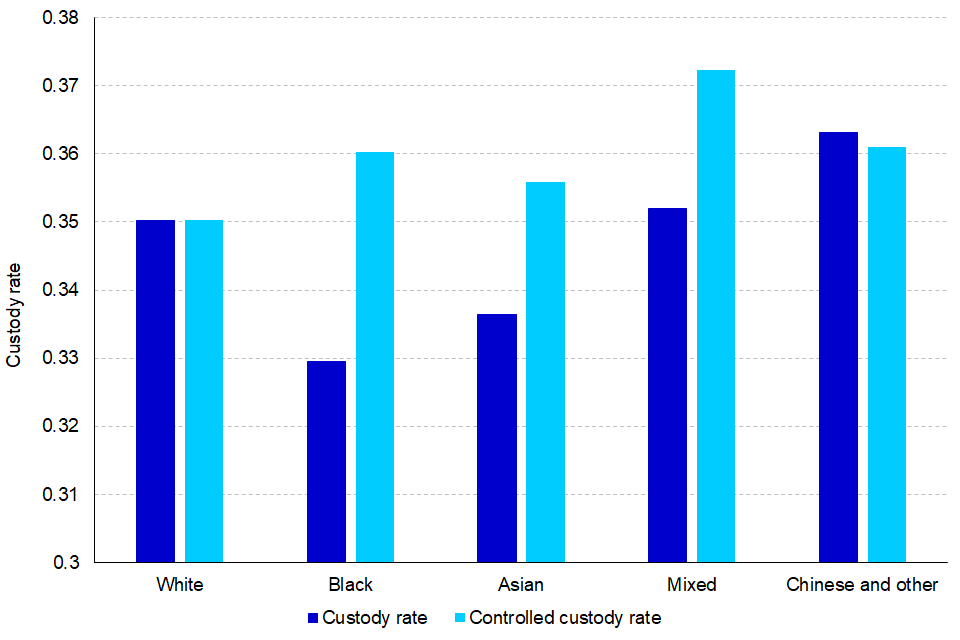
Controlling for offence mix between ethnic groups also impacted on custody rates. The largest difference was observed in the Black ethnic group, which saw a 3 percentage point difference between custody rate and controlled custody rate, at 33% and 36% respectively.
Figure 8.02: Comparison of custody rates before and after controlling for offence mix, all indictable offences, 2020, England and Wales.
8.1 Possession of Weapons Offences
Between 2019 and 2020, the number of prosecutions for possession of weapons offences fell by 17%. This goes against the trend from 2016 where the numbers of prosecutions had been rising each year for all ethnic groups except Black. In 2020, Black and Mixed ethnic groups were particularly overrepresented in the proportion of prosecutions for possession of weapons offences, this has remained largely unchanged from 2016. In 2020, 70% of defendants were from the White ethnic group, 17% Black ethnic group, 7% Asian ethnic group, 5% Mixed and 2% Chinese or Other.
Remands and Custody rate
Between 2016 and 2020, the proportion of defendants remanded in custody at Crown Court has increased for all ethnic groups and the proportion remanded has remained highest for Chinese or Other, Black and Mixed defendants. In 2020, the proportion remanded in custody was higher for Chinese or Other (51%), Black (49%) and Mixed (47%) defendants compared to Asian (41%) and White (40%) defendants.
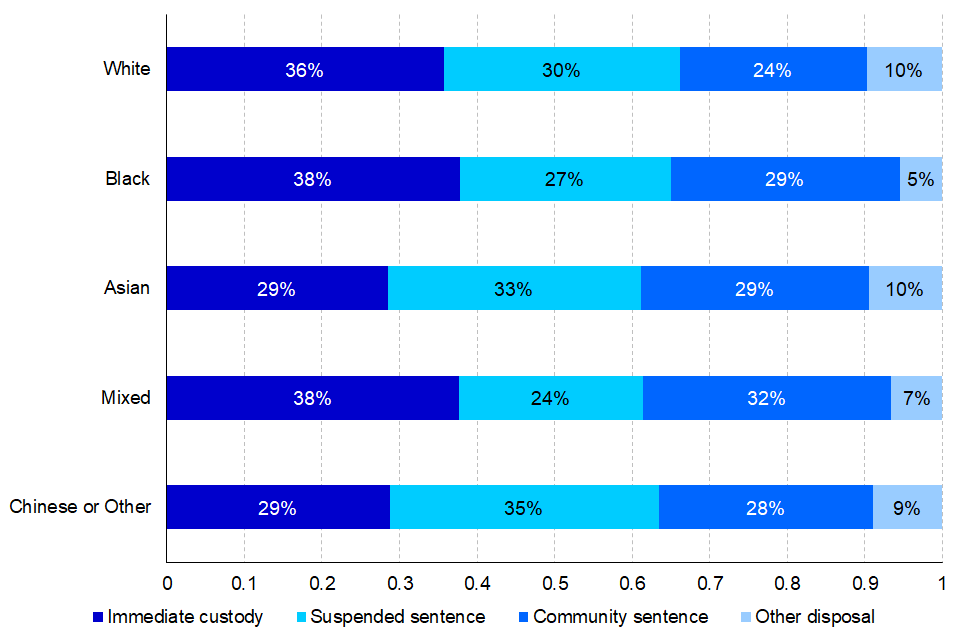
In 2020, the custody rate for possession of weapons offences was highest for Black and Mixed offenders at 38%, the custody rate for White offenders was 36%, and 29% for both Asian and Chinese or Other offenders.
Figure 8.03: Sentencing outcomes for possession of weapons offences, by ethnicity, 2020
Average Custodial Sentence Length (ACSL)
The ACSL was longest for Chinese or Other offenders at 14.7 months, followed by Black at 13.7 months, Mixed 13.2 months, Asian 12.1 months and White 10.6 months. The ACSL for possession of weapon offences fell between 2016 and 2020 across all ethnic groups, except for the Mixed ethnic group . ACSL decreased the most for Asian offenders (decreasing 41%) and Black offenders (decreasing 23%) over the last 5 years.
8.2 Drug Offences
As outlined in the defendants chapter, drug offences accounted for the highest proportion of convictions within each ethnic group except for White offenders. Drug offences accounted for 21% of all prosecutions and 22% of all convictions for all indictable offences in 2020. The proportions across ethnic groups have remained relatively stable in the past 5 years.
Drug offences vary both in nature and severity. This section focuses on the following high-volume indictable drug offences: * Possession (Class A) * Possession (Class B, excluding cannabis) * Possession (Class B, cannabis) * Production, supply, intent to supply (Class A) * Production, supply, intent to supply (Class B)
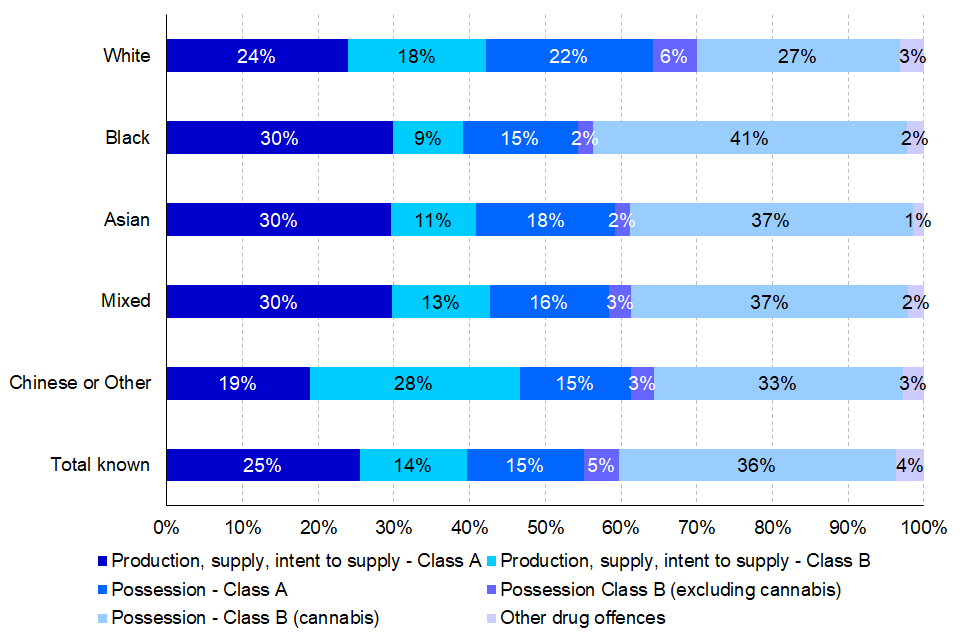
Together, these five offence groups equate to 97% of all prosecutions and convictions for indictable drug offences where ethnicity is known. However, the proportion of prosecutions for these offences varies by ethnicity, as illustrated in the figure below.
Figure 8.04: Proportion of prosecutions for selected drug offences, by ethnicity, 2020, England and Wales
The number of prosecutions for drug offences has decreased by 15% in the past 5 years. The largest proportionate decrease was seen in the White and Black ethnic groups (-18% and -17% respectively).
Across the past 5 years, “possession of a Class B drug (cannabis)” was consistently the most common drug offence for all ethnic groups, accounting for 31% of all drug offences in 2020. 53% of prosecutions for this offence were for White defendants, 25% Black, 13% Asian, 6% Mixed and 2% Chinese or Other ethnic groups. Within ethnic groups, Black defendants had the largest proportion of prosecutions for this offence in each of the past 5 years. In 2020, 41% of drug offence prosecutions of Black defendants were for “possession of a Class B drug (cannabis)”. The equivalent proportion for White defendants was 27%. In contrast, White defendants had the largest proportion of prosecutions for “possession of a Class A drug” (22% in 2020). Proportions of defendants prosecuted for “production, supply and intent to supply” varied by year, with Black, Asian and Mixed defendants accounting for the highest proportions of defendants for Class A drugs (each 30% in 2020), while the Chinese or Other ethnic group accounted for t he highest proportion for Class B drugs (28% in 2020).
Of all offenders sentenced in 2020, the most common outcome was a fine, at 38%. A fine was the most common outcome for all ethnic groups, except for the Chinese or Other group, where immediate custody was higher.
Figure 8.05: Sentencing outcomes for all drug offences, 2020, England and Wales
Average Custodial Sentence Length (ACSL)
The ACSL for drug offences has increased across all ethnic groups over the past 5 years. In 2020, Asian offenders had the longest ACSL for drug offences, at 46.2 months, the Chinese or Other group had the shortest (31.8 months), while all other ethnic groups ranged from 38.0 to 39.8 months. A contributing factor to the long ACSL for Asian offenders is due to the high proportions of Class A drug related offences.
Custody Rate
The overall custody rate for drug offences has increased from 21% in 2016 to 25% in 2020. In 2020, the custody rate was relatively stable across ethnic groups, between 24 and 26%. A higher custody rate, however, was seen in the Chinese or Other group (36%).
Remands
In 2020, 45% of all defendants prosecuted for drug offences at Crown Court were remanded in custody . The Chinese or Other ethnic group had the highest number of defendants remanded in custody, at 62%, whereas the White ethnic group had the lowest number of defendants remanded in custody, at 42%.
Overall, 81% of defendants who were remanded in custody at Crown Court for drug offences went on to receive an immediate custodial sentence. This has remained relatively stable across the past 5 years and across ethnic groups.
8.3 Sexual Offences
In 2020, sexual offences accounted for 4% of all prosecutions for indictable offences; this has remained broadly stable across the last 5 years.
Custody Rate
The most common sentencing outcome across all ethnic groups for sexual offences was immediate custody. Of the offenders sentenced, 53% were sentenced to immediate custody. The overall custody rate has remained relatively stable between 2016 and 2019, ranging from 57% to 61%. A decline in custody rate was observed in 2020, likely a result of the impact of COVID-19 restrictions on courts and the prioritisation of non-jury trials . In 2020, the custody rate was highest for the Chinese or Other ethnic group, at 64% and lowest for the Mixed ethnic group at 48%.
Average Custodial Sentence Length (ACSL)
The ACSL for sexual offences varied by ethnic group. In 2020, the ethnic group with the highest ACSL for sexual offences was Black, at 67.3 months, and the lowest the Asian group at 51.6 months. This trend has fluctuated across recent years, with the Mixed ethnic group having the highest ACSL in 2019 (at 71.4 months), and the Chinese or Other group having the lowest (at 46.7 months).
Remands
In 2020, 37% of all defendants prosecuted for sexual offences at Crown Court were remanded in custody . The Black ethnic group had the highest proportion of defendants remanded in custody, at 52%, whereas the White ethnic group had the lowest, at 36%.
Overall, 79% of offenders who were remanded in custody at Crown Court received an immediate custodial sentence; this has increased by 13 percentage points (pp) since 2016. This varied by ethnic group; in 2020, 81% of White offenders who were remanded in custody went on to receive an immediate custodial sentence, compared to 79% of Asian offenders and 70% of Black offenders .
Of all defendants who entered a plea at Crown Court for sexual offences, 94% entered a guilty plea in 2020 . This is an increase of 5 pp since 2019; a difference likely due to the prioritisation of non-jury trials as a result of COVID-19 restrictions . From 2016 to 2019, the guilty plea rate remained relatively stable at between 88% and 89%. In 2020, White defendants had the highest guilty plea rate for sexual offences, at 95%. Guilty plea for all other ethnic groups ranged between 89% and 92% in 2020.
9. Practitioners
The ethnic profile of practitioners in the Criminal Justice System (CJS) has become slightly more diverse over the last 5 years.
The proportion of staff from White backgrounds has decreased between 1 and 2.4 pp across all CJS organisations over the last 5 years, largely driven by increases in the proportion of staff from Asian and Mixed ethnic backgrounds.
This chapter reports on the trends in the composition of staff and practitioners throughout the CJS by ethnicity [footnote 90].
9.1 Trends in CJS organisations
Ministry of Justice: Between 2016 and 2020, there has been an increase of 1.3 percentage points (pp) in the proportion of staff from the Asian ethnic group and a decrease of 1.6 pp in the proportion of staff from the White ethnic group[footnote 91].
Crown Prosecution Service (CPS): The ethnic background of the CPS, where ethnicity was known, has remained broadly similar between 2016 and 2020[footnote 92]. The largest change in the proportion of staff was a 1.2 pp increase in the Asian ethnic group[footnote 93].
Police officers: The proportion of White practitioners is highest for police officers of all the CJS organisations at 92.4%[footnote 94]. The proportion of police officers from minority ethnic groups has increased from 6.3% to 7.6% between 2017 and 2021[footnote 95].
Her Majesty’s Prison and Probation Service (HMPPS): Between 2017 and 2021, the proportion of White HMPPS staff (excluding National Probation Service) has decreased, from 92.6% to 90.3%, due to an increase in the proportion of staff from Black (1 pp), Asian and Mixed (0.7 pp) backgrounds[footnote 96].
Judiciary: The proportion of White judges has fallen by 1.9 pp, between 2017 and 2021, driven mainly by an increase in the proportion of practitioners from Asian (1.5 pp) and Mixed (0.6 pp) ethnic groups[footnote 97].
Magistrates: Between 2017 and 2021, the proportion of practitioners from minority ethnic groups has increased, leading to a decrease in the proportion of White practitioners, by 2.4 pp mainly driven by an increase in the proportion of practitioners from Asian (1.3 pp) and Black (0.8) ethnic groups[footnote 98]. This is the largest decrease in the proportion of White practitioners of all the CJS organisations.
Figure 9.04: Proportion of staff and practitioners in CJS organisations by ethnicity[footnote 99], latest year and 2016 or 2017, England and Wales
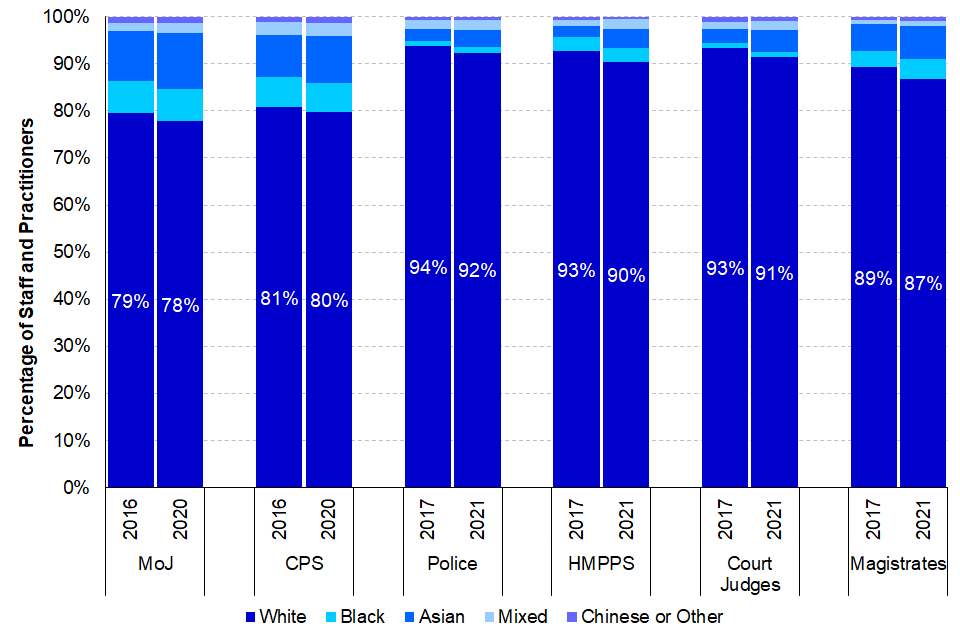
9.2 Trends in senior staff and practitioners
Caution should be taken when considering the ethnic breakdown of senior staff because the number of individuals represented is small and changing a single case could have a noticeable effect. Higher proportions of staff and practitioners in more senior roles were White for all organisations, when compared to the ethnic breakdowns of less senior staff[footnote 100].
10. Revisions policy
In accordance with Principle 2 of the Code of Practice for Official Statistics, the Ministry of Justice is required to publish transparent guidance on its policy for revisions. A copy of this statement can be found at:
http://www.justice.gov.uk/downloads/statistics/mojstats/statistics-revisions-policy.pdf
The Ministry of Justice aims to avoid the need for revisions to publications unless they are absolutely necessary and put systems and processes in place to minimise the number of revisions.
Within the Ministry of Justice’s statistical publications there can be three main reasons for statistics to be revised:
-
Changes in how either source administrative systems collect information or a change in statistical methodology to improve accuracy and measurement.
-
Receipt of subsequent information which alters our understanding of previous periods (for example – late recording on one of the administrative IT systems used operationally).
-
Errors in our statistical systems and processes.
Our policy in handling revisions is to be transparent with users about:
-
The need for revisions.
-
How and when to expect revisions as part of our standard processes.
-
The processes by which other revisions will be communicated and published.
To meet these commitments, all of our statistical publications will:
-
Ensure that the need for major revisions for any series are pre-announced on the Ministry of Justice website.
-
Include a detailed revisions policy within every release.
-
Detail how users will be informed of the need for revisions.
-
Give detailed and full explanations as to why the revisions were necessary.
In addition, the annual report from the Head of Profession to the National Statistician will:
-
Provide information on how many revisions were required to our publications and the reasons for these.
-
Publish a time-series of revisions due to errors in our statistical processes and procedures so we can monitor the quality of our outputs.
11. Further information
11.1 National Statistics status
National Statistics status means that official statistics meet the highest standards of trustworthiness, quality and public value.
All official statistics should comply with all aspects of the Code of Practice for Statistics. They are awarded National Statistics status following an assessment by the Authority’s regulatory arm. The Authority considers whether the statistics meet the highest standards of Code compliance, including the value they add to public decisions and debate.
It is the Ministry of Justice’s responsibility to maintain compliance with the standards expected for National Statistics. If we become concerned about whether these statistics are still meeting the appropriate standards, we will discuss any concerns with the Authority promptly. National Statistics status can be removed at any point when the highest standards are not maintained and reinstated when standards are restored.
11.2 Contact
Press enquiries should be directed to the Ministry of Justice press office:
Tel: 020 3334 3536
Email: newsdesk@justice.gov.uk
Other enquiries about these statistics should be directed to the Data and Evidence as a Service division of the Ministry of Justice:
Damon Wingfield, Responsible Statistician and Head of Criminal Justice System Statistics
Ministry of Justice, 3rd Floor, 10 South Colonnade, London, E14 4PU
Email: CJS_Statistics@justice.gov.uk
General enquiries about the statistical work of the Ministry of Justice can be e-mailed to: ESD@justice.gov.uk
Feedback
The structure and content of this report is continually being reviewed to reflect user requirements. If you have any feedback about the changes referred to in the introduction, or the report more generally, please contact the production team through the Justice Statistics Analytical Services division of the Ministry of Justice: Email: CJS_Statistics@justice.gov.uk
© Crown copyright
Produced by the Ministry of Justice
Alternative formats are available on request from ESD@justice.gov.uk
-
Population estimates for 2016 as provided in data accompanying the Research report on population estimates by ethnic group and religion. This article presents research into a method for producing population estimates by ethnic group and by religion, combining Annual Population Survey (APS) and census data. These research outputs are not official statistics on the population. ↩
-
More information of ethnic group classifications can be found in Appendix I ↩
-
Officer identified ethnicity can refer to ethnicity recorded by any third party, such as a police officer, clerk or a member of the data entry team. ↩
-
See Appendix I for further details of how detailed ethnicity categorisations are aggregated. ↩
-
See Appendix II for concordance in ethnicity reporting between these sources ↩
-
More information on Relative Rate Indexes can be found in the technical guide. ↩
-
Available at https://www.statisticsauthority.gov.uk/code-of-practice/ ↩
-
Data provided by the Home Office listing offences recorded as homicide as of 15th December 2020. ↩
-
As a survey that asks people whether they have experience as a victim of crime, the CSEW does not cover homicides or crimes where there is no direct victim, such as possession of drugs or motoring offenses. Where there are differences between groups that are statistically significant this will be stated. ↩
-
For more information, see Crime in England and Wales: year ending March 2020. ↩
-
Personal crime includes violence, robbery, theft from the person and other theft of personal property excluding fraud and computer misuse. ↩
-
Statistical significance between groups over the time series is represented with a ‘*’ ↩
-
This section reports on three years of combined data, 2017/18 to 2019/20. ↩
-
This figure includes 96 victims of Hillsborough and four victims of the Westminster Bridge attack in the year ending 2017, and 31 victims of the terrorist attacks that involved multiple victims, including the Manchester Arena bombing, and the London Bridge attack recorded in the year ending 2018. ↩
-
Offences recorded as homicide as at 15 December 2020; figures are subject to revision as cases are dealt with by the police and by the courts, or as further information becomes available. ↩
-
The Homicide in England and Wales - Office for National Statistics (ons.gov.uk) publication utilises 2016 population estimates to derive homicide rates relative to the population. ↩
-
All groups defined by officer-identified ethnicity classification – see Appendix I. ↩
-
A suspect in a homicide case is defined as either: a person who has been arrested in respect of an offence initially classified as homicide and charged with homicide, including those who were subsequently convicted or a person who is suspected by the police of having committed the offence but is known to have died or committed suicide prior to arrest or being charged. ↩
-
There is only ever one principal suspect per homicide victim. Where there are multiple suspects if any conviction information is available the suspect with the longest sentence or most severe conviction is determined to be the principal suspect. In the absence of any court outcome, the principal suspect is either the person considered by the police to be the most involved in the homicide or the person with the closest relationship to the victim. ↩
-
Data from 2019/20 for the Asian (or Asian British) ethnic group includes people who identify as Chinese. Prior to 2019/20, Chinese arrests are counted within ‘Other Ethnic Group’. Therefore, trends within these broad ethnic groups will be less comparable over a 5-year time series. ↩
-
Data for stop and searches is published by Home Office in Stop and search open data tables ↩
-
Stop and searches under s60 Criminal Justice and Public Order Act 1994 accounted for approximately 1% of all stop and searches (s1 and s60) in the latest year. For more information on stop and search legislation, please see the accompanying guidance document. ↩
-
Ethnicity is self-identified, and coverage has decreased from 93% in 2016/17 to 86% in 2020/21. ↩
-
See technical guide for information on the use of section 136 of the Mental Health Act (1983). ↩
-
In 2018/19 Lancashire, Warwickshire and West Mercia stated that new IT systems and/or processes had led to changes in recording of detentions under section 136 of the Mental Health Act. Therefore, to ensure comparability across year, these forces have been excluded from the calculations for the year on year change. ↩
-
See technical guide for more information on what this service covers. ↩
-
2% of adults identified as intersex or did not disclose this information. They have been excluded from all analyses in this chapter. ↩
-
Some police forces were unable to supply complete data, please see footnotes in the BUSS open data tables. ↩
-
Excluding ‘unknown link’ and ‘unknown whether article found’ ↩
-
‘No further action’ includes a wide range of scenarios, such as where words of advice would be given, or an individual is detained under section 136 of the Mental Health act. ↩
-
Arrests analysis excludes Lancashire as they could not supply complete data for 2017/18. The data for this section is available in the Arrests open data tables published by Home Office. ↩
-
Includes City of London and Metropolitan Police forces. ↩
-
Data from 2019/20 for the Asian (or Asian British) ethnic group includes people who identify as Chinese. Prior to 2019/20, Chinese arrests are counted within ‘Other Ethnic Group’. Therefore, trends within these broad ethnic groups will be less comparable over a 5-year time series. ↩
-
Children includes individuals aged up to 17 and adults includes individuals aged 18 and over. ↩
-
Offence groups from this chapter are not directly comparable to offence groups from the MoJ Court Proceedings database – see technical guide for further details ↩
-
Ethnicity coverage is more complete for triable either way and indictable only offences. This section is limited to these offences (referred to indictable) and to defendants aged 10 or over unless otherwise is explicitly stated. ↩
-
Pre-sentence reports (PSRs) are prepared by the Probation Service to provide information to the court about the offender and any circumstances surrounding the offence, to help decide on a suitable sentence. ↩
-
Concordance rates are calculated by dividing the number of those who were recommended to receive a sentence disposal and did receive it, by all those who were recommended to receive it. ↩
-
The decrease in numbers of sentences in 2020 is mainly a result of court closures due to COVID-19 lockdown restrictions. ↩
-
The custody rate is the proportion of all offenders sentenced to immediate custody, out of all offenders sentenced. ↩
-
Further custody rate figures can be found here: Criminal justice system statistics quarterly: December 2020 - GOV.UK (www.gov.uk) ↩
-
Where ethnicity is known. ↩
-
The overall increase in ACSL may be due to a change in sentencing guidelines. ↩
-
Crime higher concerns legal representation in the Crown Court and above. Crime lower work is carried out by legal aid providers at police stations, in magistrates’ courts and prison. Crime lower work tends to be relatively high volume, lower cost units of criminal legal aid work. ↩ ↩2
-
See technical guide for further information relating to the impact of COVID-19 on the courts. ↩
-
Ethnicity was known for 99.29% of prisoners in England and Wales on 30th June 2020. ↩
-
A determinate sentence is for a fixed period of time, and differs from indeterminate sentences that have a minimum fixed period, known as a tariff, that must be served before release is considered by the parole board. ↩
-
52,617 prisoners were released from determinate sentences in 2020, of whom 99.14% were of known ethnicity. ↩
-
The HMI Prisons section refers to ‘race’ rather than ‘ethnicity’ as this was the term used in the survey. ↩
-
Detailed results of the survey can be found in table 6.06 in the tables document published alongside this report. 2,574 White, 355 Black, 296 Asian, 226 Mixed and 107 prisoners from Other ethnic groups completed the questionnaires. ↩
-
See technical guide for information relating to parole board. ↩
-
Ethnicity was known in 99.7% of oral parole board hearings in the year ending March 2021. Cases where ethnicity was not known have not been included in this commentary. ↩
-
Caution must be taken with interpreting data from the Chinese or Other group as the population size is very small. ↩
-
Court Orders can contain more than one requirement. ↩
-
Ethnicity was recorded for 85.7% of community orders and 87.6% of suspended sentence orders commenced in 2020. Those where ethnicity was not known/recorded are not included in this commentary. ↩
-
The Rehabilitation Activity Requirement was introduced in 2014 under the Offender Rehabilitation Act and requires the offender to attend appointments and participate in activities selected by their responsible officer to support their rehabilitation and reduce reoffending. ↩
-
Ethnicity was recorded for 96.5% of offenders supervised on post-release licence in 2020. Those where ethnicity is not known are not included in this commentary. ↩
-
Where ethnicity and protected characteristic was known, not controlling for offence mix. ↩
-
Excluding adults where their age bracket is unknown (2 defendants). ↩
-
A first-time offender is an offender who has been arrested by the police in England and Wales and has received a first conviction, caution or youth caution for any offence recorded on the Police National Computer. ↩
-
Chinese or other combines the following categories from the published criminal history pivot table for 2020 Q4; Chinese or Japanese or S E Asian, and Middle Eastern. ↩
-
The Police National Computer has a 6+1 ethnicity classification. ↩
-
A long criminal history is defined as 15 or more previous cautions or convictions. ↩
-
New methodology introduced in the 2015/16 cohort, used to measure proven reoffending, reduced twelve-monthly cohort to a three-monthly cohort and changed data source following probation services reforms. Therefore, users should be careful when comparing cohort 2015/16 and earlier to subsequent annual figures. ↩
-
Pupils at the end of Key Stage 4 are typically aged 15 and 16; please see A Technical Guide to Statistics on Ethnicity and the Criminal Justice System, 2020 for further details. ↩
-
Equivalently, a Key Stage 4 academic year of 2013/14 and 2014/15; analysis of the attainment data focuses on those sentenced/cautioned that were at the end of KS4 in the 2013/14 and 2014/15 academic years. Analysis of offender characteristics such as SEN and FSM is also based on academic years 2013/14 and 2014/15. ↩
-
We were only able to match data on those children who are both in DfE and MoJ datasets so cannot provide analysis specifically for non-offenders with these characteristics. ↩
-
Source: GCSE and equivalent results in England 2014/15 (Revised) ↩
-
A young person may be eligible to claim for FSM if they or their family meet certain criteria related to their income and benefits received. ↩
-
Overall pupil population referring to cohort 2014/15. ↩
-
A SEN statement is a document which sets out a child’s SEN and any additional help that the child should receive. Having a SEN statement may indicate a higher level of need. ↩
-
For 2014/15, following SEN reforms, SEN pupils are categorised as ‘SEN with a statement or Education, health and care (EHC) plan’ and ‘SEN support’. SEN support replaces school action and school action plus but some pupils remain with these provision types in first year of transition. More detailed information on the reforms can be found at the following: SEND code of practice: 0 to 25 years. ↩
-
Overall pupil population referring to cohort 2014/15. ↩
-
Persistent absence is when a pupil enrolment’s overall absence equates to 10 per cent or more of their possible sessions. ↩
-
A permanent exclusion refers to a pupil who is excluded and who will not come back to that school (unless the exclusion is overturned). ↩
-
Suspended refers to a pupil who is excluded from a school for a set period of time. Being suspended can involve a part of the school day and it does not have to be for a continuous period. A pupil may be excluded for one or more suspensions up to a maximum of 45 school days in a single academic year. This total includes exclusions from previous schools covered by the exclusion legislation. ↩
-
Where ethnicity is known. ↩
-
Figures given to 1 decimal place. ↩
-
Data are self-declared from HR records, as at 31 March 2020; not including figures from HMPPS. ↩
-
Data is self-declared from HR records, as at 31 December 2020. These data are based on the ONS headcount specification and may differ from other published figures due to differing specifications. ↩
-
Excludes declarations of ‘prefer not to say’. ↩
-
Due to a change in the data collection framework in 2021, officers who identify as Chinese are now counted under the “Asian” ethnic group, in line with the 2011 ONS Census classifications. Previously, these officers have been counted under the “Chinese or Other ethnic group”. For this reason, comparisons over time for the “Asian” and “Other” ethnic group should be made with caution. ↩
-
Data are self-declared from Home Office, as at March 2021, some small discrepancies may result from revisions of data for previous years compared to figures here. ↩
-
Data used in the HMPPS workforce quarterly statistics are self-declared from HR records, as at 31 March 2021. ↩
-
Self-declared from HR records reported table ‘3_1_JO_Appt’ in the Judicial Diversity Statistics, 2021 publication, the quoted figure covers all court judges; Judicial Diversity Statistics 2017. ↩
-
Self-declared from HR records reported table ‘3_5_JO_Magistrates’’ Judicial Diversity Statistics, 2021 publication, the quoted figure covers all court judges; Judicial Diversity Statistics 2017. ↩
-
Excludes declarations of ‘prefer not to say’. ↩
-
Senior roles are as follows: CPS - Senior Legal Manager and Senior Civil Servant; MoJ – Senior Civil Servant; HMPPS - Senior Civil Servant; Police - Chief Inspector, Superintendent, Chief Superintendent, and Chief Officers; Judiciary – High Court Judges, Heads of Division and Lord Justices of Appeal. ↩