Detailed analysis of non-fire incidents: England, April 2025 to March 2026
Published 30 September 2026
Applies to England

© Crown copyright 2026
This publication is licensed under the terms of the Open Government Licence v3.0 except where otherwise stated. To view this licence, visit nationalarchives.gov.uk/doc/open-government-licence/version/3 or write to the Information Policy Team, The National Archives, Kew, London TW9 4DU, or email: psi@nationalarchives.gov.uk.
Where we have identified any third party copyright information you will need to obtain permission from the copyright holders concerned.
This publication is available at https://www.gov.uk/government/statistics/detailed-analysis-of-non-fire-incidents-year-ending-march-2026/detailed-analysis-of-non-fire-incidents-england-april-2025-to-march-2026
Frequency of release: Annual
Forthcoming releases: Ministry of Housing, Communities and Local Government statistics release calendar
MHCLG responsible statistician: Paul Gaught-Allen
Press enquiries: newsdesk@communities.gov.uk
Public enquiries: firestatistics@communities.gov.uk
The statistics in this release are sourced from the Fire and Rescue Data Platform (FaRDaP) and include statistics on all non-fire incidents and related fatalities and non-fatal casualties, with long-term comparisons. This release also includes, for the first time, analysis of response times to non-fire incidents. Fire service incident data were collected by the Incident Recording System (IRS) until November 2025. Since November 2025, these data have been collected by the Fire and Rescue Data Platform (FaRDaP) that includes statistics on non-fire incidents as well as fatalities, non-fatal casualties and response times to non-fire incidents.
This release provides more detailed analysis of the already published trends in non-fire incidents for the year ending March 2026. For the latest headline findings on non-fire incident numbers see the latest Fire and rescue incident statistics; England, year ending March 2026, published on 22 July 2026.
Fire and Rescue Services (FRSs) attend many types of incidents that are not fires or fire false alarms. These are known as non-fire incidents or special service incidents. Examples include flooding incidents, responding to road traffic collisions (RTCs), animal assistance, effecting entry/exit and assisting other agencies (see FIRE0901 for the full list of non-fire incident types). While this release covers trends across all non-fire incidents, each year a selection of topics are explored in greater detail. The topics covered vary between years to reflect areas of current interest and those not covered in recent years. This year’s areas of detailed focus are:
- collaboration incidents, as a major driver of non-fire incidents
- flooding and water rescues, as one of the main discrete categories of non-fire incidents
- animal assistance, as a topic not covered in previous releases that users have shown interest in
Key results
-
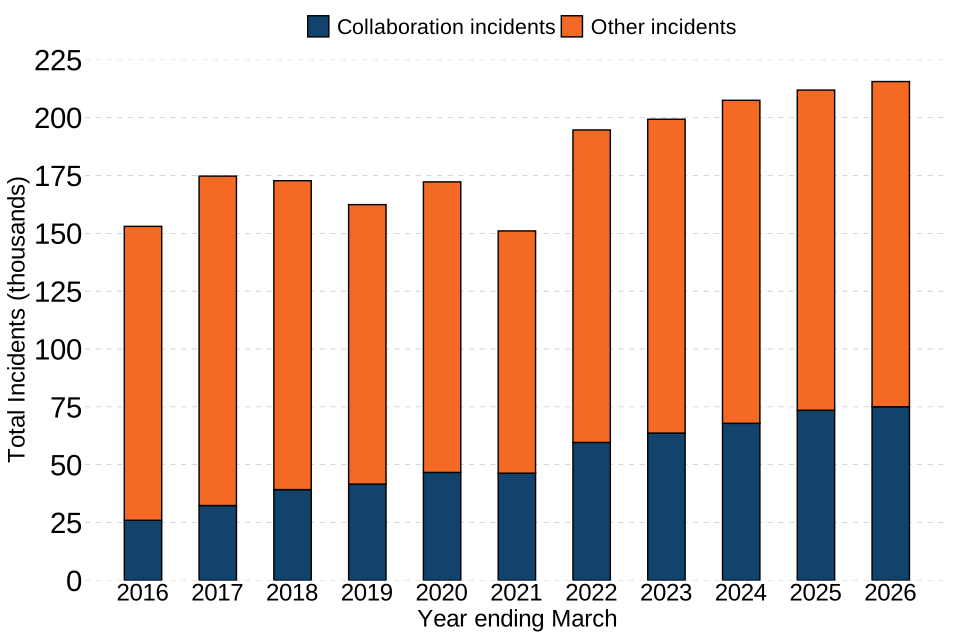
FRSs attended 215,583 non-fire incidents in the year ending March 2026, the highest financial year figure since comparable data became available in the year ending March 2010, representing an increase of 1.7% compared with the previous year (211,900), and 41% compared with 10 years ago (153,006)
-
over the past decade collaboration incidents showed an increase of 189% from 25,998 to 75,060 and their share of all non-fire incidents increased from 17% to 35%
Figure KR.1: Total non-fire incidents attended by FRSs, England; year ending March 2016 to year ending March 2026
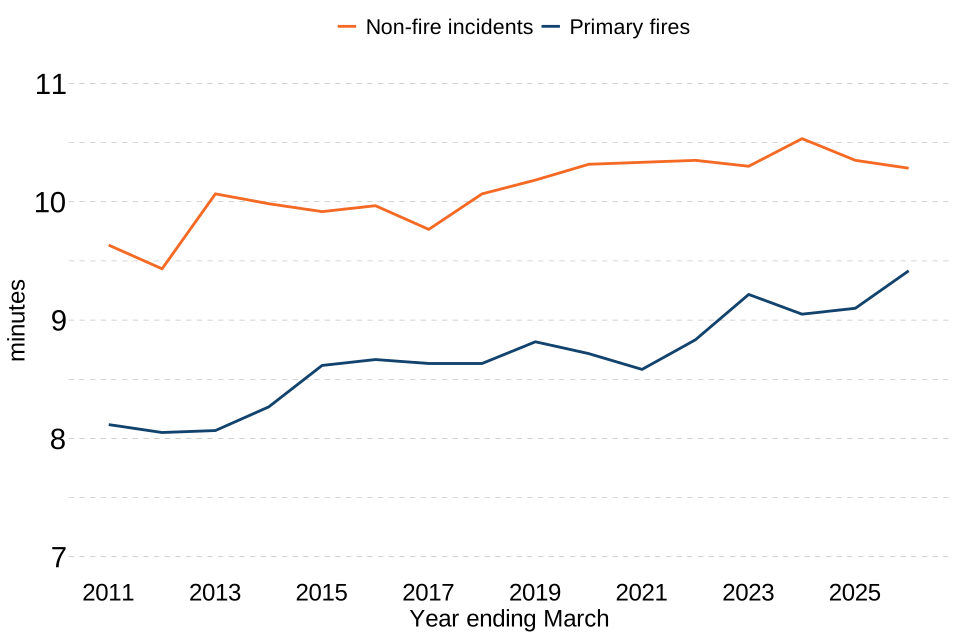
- the average response time to all non-fire incidents was 10 minutes and 17 seconds in the year ending March 2026, compared with 10 minutes and 21 seconds in the previous year (a decrease of 4 seconds), 10 minutes and 20 seconds 5 years ago (a decrease of 3 seconds) and 9 minutes and 58 seconds 10 years ago (an increase of 19 seconds)
Figure KR.2: Average total response times (minutes) to non-fire incidents and primary fires, England; year ending March 2011 to year ending March 2026
Source: FIRE1005
Note: 1. Y-axis is from 7 to 11 minutes.
1. Overview of non-fire incidents attended
This section provides a summary of non-fire incident trends.
FRSs attend a wide range of incidents that are neither fires nor fire false alarms. These incidents are called non-fire incidents or special service incidents and can include incidents such as attending effecting entry/exit incidents, flooding incidents, non-fire false alarms and lift release. As these are a disparate set of incidents the trends tend to vary. Table FIRE0901 shows the groups mentioned many times in this release and which of the 23 specific non-fire incident categories they fall into.
Key results
In the year ending March 2026, FRSs attended:
- the highest number of non-fire incidents for a financial year since comparable data became available (215,583), an increase of 1.7% compared with the previous year (211,900), an increase of 43% (151,031) compared with 5 years ago, and an increase of 41% compared with 10 years ago (153,006)
These incidents are split into 7 groups of non-fire incidents attended, which are:
-
collaboration incidents, 75,060 incidents attended in the year ending March 2026, the highest financial year figure since comparable data became available and an increase of 2.1% compared with the previous year (73,526)
-
medical incidents, 10,602 incidents, a decrease of 22% compared with the previous year (13,632)
-
flooding and water rescues, 17,502 incidents, a decrease of 5.8% compared with the previous year (18,570)
-
Road Traffic Collisions (RTCs), 32,713 incidents, an increase of 1.5% compared with the previous year (32,216)
-
no action incidents, 21,587 incidents, the highest financial year figure since comparable data became available and an increase of 11% compared with the previous year (19,453)
-
non-fire false alarms, 10,841 incidents, an increase of 8.2% compared with the previous year (10,015)
-
remaining non-fire incidents, 47,278 incidents, a decrease of 6.3% compared with the previous year (50,479)
1.1 Trends in total non-fire incidents
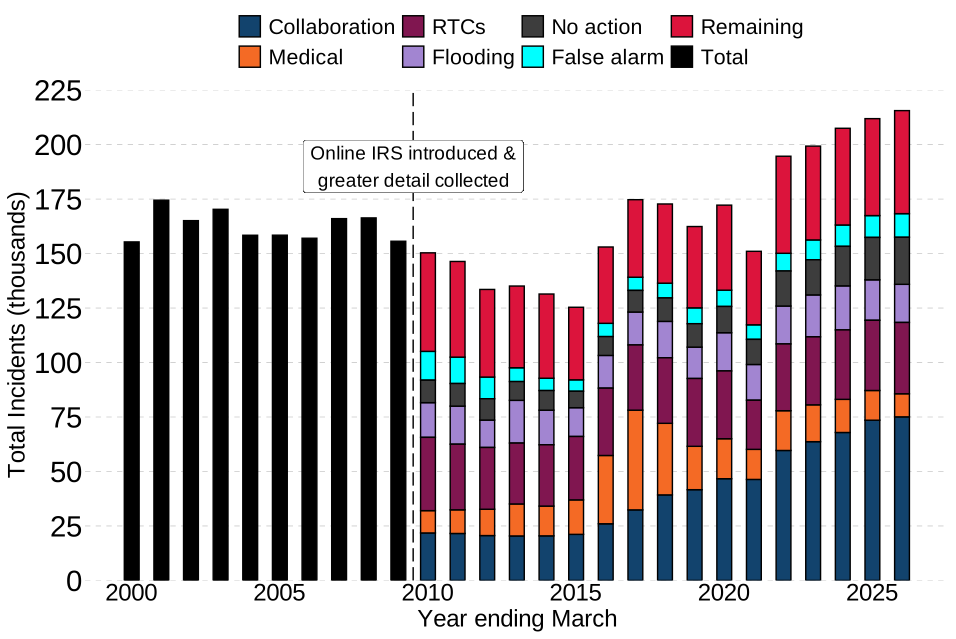
Figure 1.1 shows that the number of non-fire incidents attended by FRSs remained broadly stable between the years ending March 2000 and 2008, before declining to a low of 125,351 incidents in the year ending March 2015. Since then, the number of non-fire incidents attended has been on an upward trend with 2 clear step changes:
-
in the year ending March 2016, driven largely by growth in medical incidents following the introduction of the Emergency Medical Response (EMR) trials, where FRSs formed agreements with ambulance trusts to undertake health and care related work, in particular co-responding
-
in the year ending March 2022, driven largely by growth in collaboration incidents following the government’s commitment to driving increased collaboration between the emergency services as well as a recovery after COVID-19 lockdowns
The number of non-fire incidents attended over the last 10 years has increased both in terms of the absolute number and as a proportion of all incidents attended. In the year ending March 2026, non-fire incidents accounted for 34% of all incidents (215,583), compared to 29% (153,006) 10 years previously.
Figure 1.1: Total non-fire incidents attended by FRSs, England; year ending March 2000 to year ending March 2026
Source: FIRE0901
Notes
- X axis labelling is every 5 years from 2000 onwards
- More information on the FaRDaP categories included in the groups in this chart can found below and in FIRE0901
For more detail on trends in total non-fire incidents see tables FIRE0901 and FIRE0902
2. Fatalities and non-fatal casualties in non-fire incidents
Fatalities and non-fatal casualties in non-fire incidents are influenced by the volume of incidents attended by FRSs, with higher incident numbers generally associated with higher numbers of fatalities and casualties. Therefore, the rates of fatalities and non-fatal casualties per 1,000 incidents are also presented to understand the changing profile of fatalities and non-fatal casualties.
Another key factor is the type of incidents FRSs attend, as different incident types have varying rates of fatalities (see Figure 2.1 for more detail). The proportional mix of incident types has also changed over time and may continue to do so in future.
The rates of fatalities and non-fatal casualties per 1,000 incidents exclude non-fire false alarms, as non-fire false alarms by definition cannot result in a fatality or non-fatal casualty.
Key results
In the year ending March 2026, there were:
- 4,760 fatalities in non-fire incidents, a decrease of 9.9% compared with the previous year (5,281), an increase of 73% compared with 5 years ago (2,749) and an increase of 53% compared with 10 years ago (3,116)
- 23 fatalities per 1,000 non-fire incidents, compared with 26 in the previous year, 19 in the year ending March 2021 and 21 10 years ago
- 45,032 non-fatal casualties in non-fire incidents, virtually unchanged compared with the previous year (44,979), an increase of 48% compared with 5 years ago (30,382) and an increase of 6.4% compared with 10 years ago (42,334)
- 220 non-fatal casualties per 1,000 non-fire incidents attended, a decrease of 1.3% compared with 223 in the previous year, 210 5 years ago and 288 10 years ago
2.1 Fatalities in non-fire incidents
Detailed comparable data on fatalities in non-fire incidents attended by FRSs first became available for the year ending March 2011 and remained stable at around 1,600 fatalities in each year up to and including the year ending March 2014. There was then a period of sharp increases (coinciding with the introduction of EMR trials), peaking in the year ending March 2017 at 5,113. Following this peak, the number of fatalities declined substantially as EMR trials ended, before fluctuating in subsequent years. In the year ending March 2026, there were 4,760 fatalities in non-fire incidents.
The non-fire fatality rate was relatively stable from the year ending March 2011, with 12 fatalities per 1,000 incidents, to the year ending March 2015, with 14. During the period of EMR trials, the rate increased to a peak of 30 in the year ending March 2017, reflecting the nature of the incident type - medical incidents - that increased in that period, before falling to 16 in the year ending March 2019. Since then, the rate has been on an upward trend, reaching 23 fatalities per 1,000 incidents in the year ending March 2026.
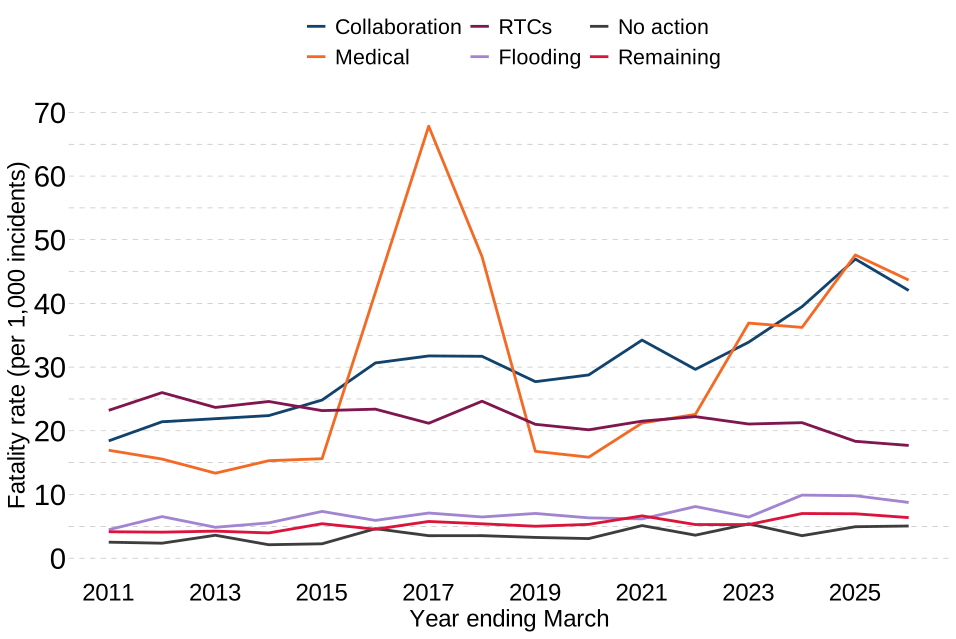
As can be seen in Figure 2.1, fatality rates varied considerably by incident group. In the year ending March 2026, collaboration incidents (42) and medical incidents (44) had the highest fatality rates, while no action incidents (5), remaining non-fire incidents (6) and flooding incidents (9) had the lowest.
The fatality rate for collaboration incidents has increased steadily over the last decade, from 18 fatalities per 1,000 incidents in the year ending March 2011, to 42 in the latest year. By contrast, the RTC fatality rate has remained relatively stable and was 18 in the year ending March 2026.
Medical incidents have shown the greatest variation over time. The fatality rate peaked at 68 fatalities per 1,000 incidents in the year ending March 2017 before falling to 16 in the year ending March 2020. Since then, it has increased to 44 in the latest year.
Figure 2.1: Rate of fatalities for each non-fire incident group per 1,000 incidents, England, year ending March 2011 to year ending March 2026
Source: FIRE0904b
2.2 Non-fatal casualties in non-fire incidents
Non-fatal casualties are split into 4 sub-categories:
Hospital severe - at least an overnight stay in hospital as an in-patient
Hospital slight - attending hospital as an outpatient (not a precautionary check)
First aid given - first aid given at scene (by anyone), including after a precautionary check
Precautionary check - a precautionary check (to attend hospital or to see a doctor) was recommended (by anyone)
Where an FRS has not recorded injury severity, the casualty was recorded as unknown.
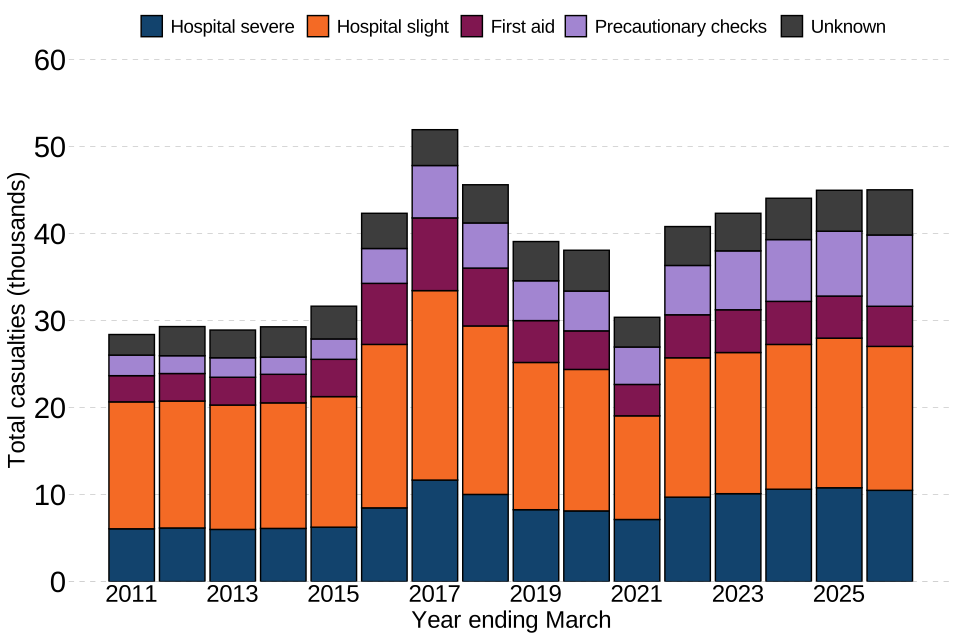
The number of non-fatal casualties in non-fire incidents remained relatively stable until the year ending March 2015 - a similar trajectory to fatalities. There were then 2 large year-on-year increases in the years ending March 2016 and 2017, which coincided with the EMR trials, increasing from 31,656 in the year ending March 2015 to 51,943 in the year ending March 2017. After that the number of non-fatal casualties in non-fire incidents fell each year, reaching 51,943 in the year ending March 2021. This was likely due to the reduction in the number of medical incidents attended by FRSs during this time, and the COVID-19 restrictions in place for much of the year ending March 2021. Since the year ending March 2021 the number of non-fatal casualties in non-fire incidents has increased, reaching 45,032 in the year ending March 2026.
The 45,032 non-fatal casualties in non-fire incidents were recorded as the following in terms of injury severity:
- 10,491 as ‘hospital severe’, a decrease of 2.7% on the previous year
- 16,547 as ‘hospital slight’, a decrease of 3.8% on the previous year
- 4,610 as ‘first aid given’, a decrease of 4.7% on the previous year
- 8,193 as recommended a ‘precautionary check’, an increase of 9.9% on the previous year
- 5,191 as ‘unknown’, an increase of 10% on the previous year
Figure 2.2: Number of non-fatal casualties in non-fire incidents, by injury severity, England, year ending March 2011 to year ending March 2026
Source: FIRE0904b
For more detail on fatalities and non-fatal casualties in total non-fire incidents see tables FIRE0904 and FIRE0905
3. Collaboration incidents
Collaboration incidents are incidents that involve co-operation with other emergency services, not including medical incidents.
The following non-fire incident categories are classed as incidents that could involve collaborating:
- effecting entry or exit
- assist other agencies
- suicide (including attempts)
Key results
In the year ending March 2026, FRSs attended:
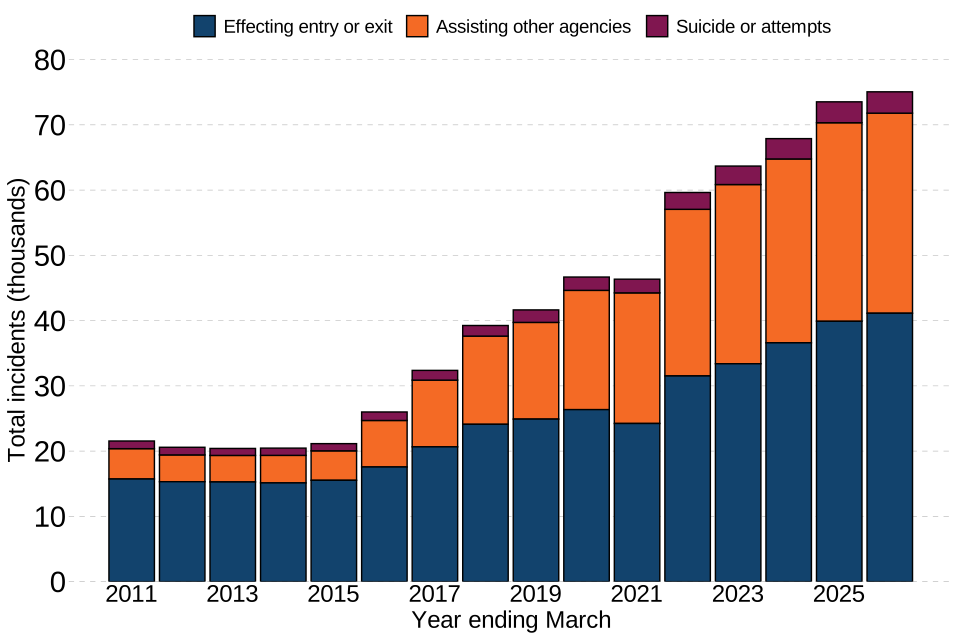
- 41,130 effecting entry or exit incidents, an increase of 3.1% compared with the previous year (39,894), an increase of 70% compared with 5 years ago (24,237) and an increase of 134% compared with 10 years ago (17,572)
- 30,660 assist other agency incidents, an increase of 0.8% compared with the previous year (30,430), an increase of 53% compared with 5 years ago (20,014) and an increase of 330% compared with 10 years ago (7,124)
- 3,270 suicide (including attempts) incidents, an increase of 2.1% compared with the previous year (3,202), an increase of 56% compared with 5 years ago (2,095) and an increase of 151% compared with 10 years ago (1,302)
3.1 Trends in collaborating incidents
Between the years ending March 2010 and 2015, the 3 collaborating incident types showed little change. Since then, all 3 have increased, with the exception of effecting entry or exit in year ending March 2021 (possibly due to COVID-19 restrictions in that year). The upward trend coincided with the government’s commitment to driving increased collaboration between the emergency services, which led to the Policing and Crime Act 2017 introducing a statutory duty to collaborate, imposed on all 3 emergency services. It also overlapped with the EMR trials, which ran from 2015 to 2017 and are discussed more in Chapter 4 on Medical Incidents.
These policy changes may have contributed to the growth in collaboration incidents during this period. Between the year ending March 2015, the last year before the increases in this incident type started, and the year ending March 2026:
-
the number of effecting entry or exit incidents increased by 165%
-
the number of assisting other agencies incidents increased by 578%
-
while a category with fewer incidents (compared to the two above), the number of suicides incidents increased by 197%
Figure 3.1: Number of collaborating incidents, England, year ending March 2010 to year ending March 2026
Source: FIRE0901
Between the years ending March 2015, the last year before the increases mentioned above started, and 2026, the type of actions recorded within effecting entry or exit incidents changed. In both years, the most common action was ‘for able bodied person not in distress’ with 14,710 incidents (36%) in the year ending March 2026 compared with 5,733 incidents (37%) in the year ending March 2015. However, there were noteworthy changes in two action types, FRSs attended 4,220 incidents (10%) assisting a child or children in effecting entry or exit incidents in the year ending March 2026 compared with 4,190 incidents (27%) in the year ending March 2015. In comparison FRSs attended 11,274 incidents (27%) categorised as a medical case in effecting entry or exit incidents in the year ending March 2026 compared with 1,753 incidents (11%) in the year ending March 2015.
The number of collaborating incidents attended per 100,000 people for each of the 3 collaborating incident types follow a similar pattern, remaining relatively stable between the year ending March 2010 and the year ending March 2015 (coinciding with a period where the number of fire incidents attended decreased) before increasing thereafter. The only exception was a slight reduction in the rate of effecting entry or exit incidents in the year ending March 2021.
In the year ending March 2026:
-
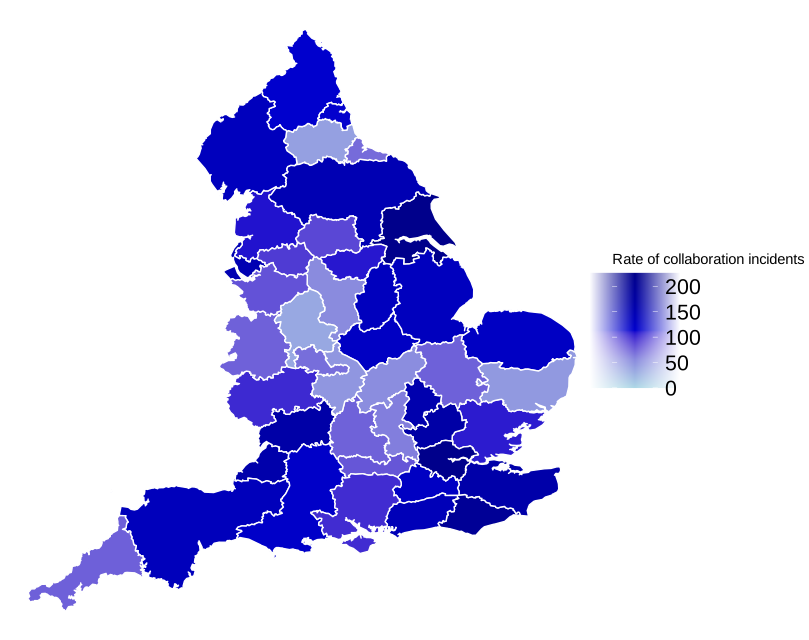
FRSs attended 70 effecting entry or exit incidents per 100,000 people in England, compared with a rate of 68 the previous year and a rate of 28 in the year ending March 2015
-
the FRS which attended the most effecting entry or exit incidents per 100,000 people was Greater London with a rate of 161.2, while Derbyshire attended the least with a rate of 16.2
-
FRSs attended 52 assisting other agencies incidents per 100,000 people in England, compared with a rate of 52 the previous year and a rate of 8 in the year ending March 2015
-
the FRS which attended the most assisting other agencies incidents per 100,000 people was Gloucestershire with a rate of 118.3, while Tyne and Wear attended the least with a rate of 7.6
-
FRSs attended 6 suicides and attempted suicide incidents per 100,000 people in England, compared with a rate of 5 the previous year and a rate of 2 in the year ending March 2015
-
the FRS which attended the most suicides and attempted suicide incidents per 100,000 people was Cleveland with a rate of 17.8, while Warwickshire attended the least with a rate of 0.6
Figure 3.2: Collaboration incidents per 100,000 people by FRSs, year ending March 2026
3.2 Fatalities in collaborating incidents
There was a similar story for fatalities in collaboration incidents. Between the year ending March 2015, the final year before the increases mentioned above started, and the year ending March 2026 the number fatalities in effecting entry or exit incidents showed an increase of 1322% to 1,436, the number of assisting other agency incidents showed an increase of 521% to 1,322 and, while a smaller category, the number of suicide incidents showed an increase of 88% to 397.
Fatality rates varied considerably between the 3 collaboration types. Between the year ending March 2015 and 2026, the fatality rate for effecting entry or exit incidents showed an increase of 437% from 7 to 35 fatalities per 1,000 incidents. In comparison the fatality rate for assisting other agencies incidents decreased by 8.5% from 47 to 43 per 1,000 incidents, while the rate for suicide (including attempts) incidents showed a decrease of 37% from 192 to 121 per 1,000 incidents. The increase in the fatality rate for effecting entry or exit incidents may reflect the different mix of effecting entry or exit incident types FRSs are attending, as mentioned in the section on collaboration trends.
For more detail on collaboration incidents see tables FIRE0901, FIRE0902, FIRE0903 and FIRE0904 and the collaboration incidents incident level dataset
4. Medical incidents
Medical incidents are incidents defined as ‘the mobilisation of trained fire crews to provide emergency medical assistance to members of the public’.
The following non-fire incident categories are classed as medical incidents:
- medical incident - co-responder, incidents where a formal agreement is in place with ambulance trusts involving both fire and ambulance services deploying to time critical incidents such as cardiac arrests
- medical incident - first responder, incidents where no such agreement is in place
In the year ending March 2026:
- FRSs attended 10,602 medical incidents, a decrease of 22% compared with the previous year (13,632), a decrease of 23% compared with 5 years ago (13,807), and a decrease of 66% compared with 10 years ago (31,339)
The number of medical incidents showed a large increase in the years ending March 2016 and 2017, due to emergency medical responding (EMR) trials, reaching 45,761 in the year ending March 2017. Either side of the trials the number of these incidents have been broadly similar, they were 10,602 in the year ending March 2026 compared to 15,815 in the year ending March 2015, before the trials took place.
For more detail on medical incidents attended see Detailed analysis of non-fire incidents: England, April 2024 to March 2025, tables FIRE0901, FIRE0902, FIRE0903 and FIRE0904 and the medical incidents incident level dataset
5. Flooding and water rescue incidents
The following non-fire incident categories are classed as flooding and water rescue incidents:
- flooding
- rescue or evacuation from water
These data were first collected for the year ending March 2010 when the online IRS was introduced.
Flooding incidents include those caused by:
- burst water mains
- flooding in open ground
- weather-related incidents, such as flash flooding
The types of incidents recorded in FaRDaP range from those where no action was required, to those involving pumping out, making safe or evacuation. In instances where a flood affects more than one property, FRSs record a separate incident for each property they visit. In extreme circumstances, however, it may be difficult for FRSs to accurately record each incident attended, as they may need to move rapidly from one property to another when assisting with a flood.
Rescues or evacuations cover a wide range of circumstances from those where people are rescued from a swimming pool, river, lake, or the sea, to being in a vehicle surrounded by water.
Key results
In the year ending March 2026, there were:
- 17,502 flooding and water rescue incidents, a decrease of 5.8% compared with the previous year (18,570), an increase of 6.8% compared with 5 years ago (16,394), and an increase of 17% compared with 10 years ago (15,007)
- 15,920 flooding incidents, a decrease of 4.2% compared with the previous year (16,615), an increase of 6.7% compared with 5 years ago (14,924), and an increase of 16% compared with 10 years ago (13,714)
- 1,582 rescue or evacuation from water incidents, a decrease of 19% compared with the previous year (1,955), an increase of 7.6% compared with 5 years ago (1,470), and an increase of 22% compared with 10 years ago (1,293)
5.1 Trends in flooding and water rescue incidents
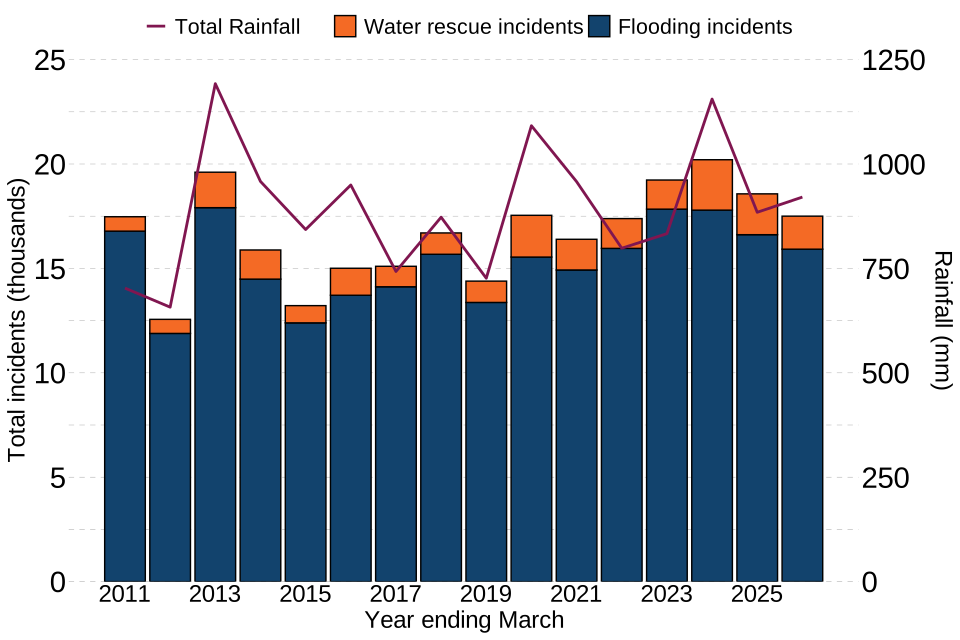
The number of flooding and water rescue incidents has fluctuated since data became available in year ending March 2010, with a notable low point in year ending March 2012 (12,560 incidents). As shown in Figure 5.1, the fluctuation in the number of incidents generally aligns with the annual changes in rainfall. In the year ending March 2026, there were 17,502 flooding and water rescue incidents, of which 15,920 (91%) were flooding incidents and 1,582 (9.0%) were rescue or evacuation from water incidents.
Figure 5.1: Rainfall (mm) and the number of flooding and water rescue incidents, England, year ending March 2011 to year ending March 2026
Source: FIRE0901 and the Met Office
5.2 Flooding and water rescue incidents per 100,000 people
Similarly to the number of incidents, the rate of flooding and water rescue incidents attended per 100,000 people in England has fluctuated since the data were first collected in year ending March 2010.
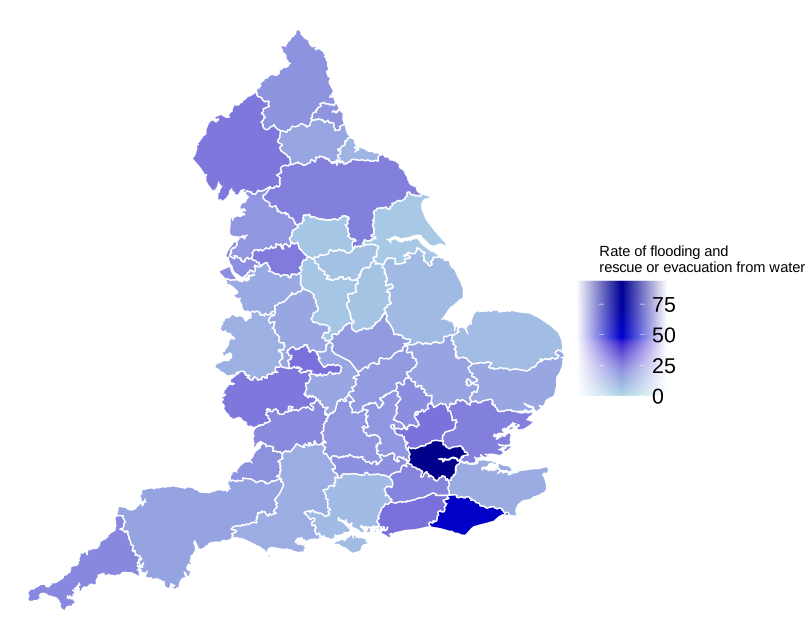
In the year ending March 2026, FRSs attended 30 flooding and water rescue incidents per 100,000 people in England. At an FRS level, Greater London attended the highest rate at 94 incidents per 100,000 people, followed by East Sussex (50) and West Sussex (29). Humberside attended the lowest rate, at 4.4, excluding Isles of Scilly, where incident numbers were very low.
Figure 5.2: Flooding and water rescue incidents per 100,000 people by FRSs, year ending 2026
For more detail on flooding and water rescue incidents attended see tables FIRE0901, FIRE0902, FIRE0903, FIRE0904, FIRE0908 and FIRE0909 and the Flooding and water rescue incidents incident level dataset
6. Road traffic collisions (RTCs)
Road Traffic Collisions are incidents where the fire service attends a road collision that is not a road vehicle fire.
Only one FaRDaP category is included in this group:
- Road Traffic Collision (RTC)
In the year ending March 2026:
- FRSs attended 32,713 RTCs, an increase of 1.5% compared with the previous year (32,216), an increase of 45% compared with 5 years ago (22,545), and an increase of 5.9% compared with 10 years ago (30,901)
The number of RTC incidents attended by FRSs has steadily increased since comparable data became available in the year to March 2011, with the exception of a steep drop in the year ending March 2021, during which there were restrictions on life due to the COVID-19 pandemic. By the year ending March 2026 there were 32,713 such incidents, compared to 30,901 10 years earlier. However, RTCs accounted for a smaller share of all non-fire incidents, decreasing from 20% 10 years ago to 15% in the year ending March 2026, reflecting faster growth in other non-fire incident types.
For more detail on RTCs attended see Detailed analysis of non-fire incidents: England, April 2024 to March 2025, tables FIRE0901, FIRE0902, FIRE0903, FIRE0904, FIRE0906 and FIRE0907 and the road traffic collisions incident level dataset
7. No action or advice incidents
No action or advice incidents are incidents where by the time FRSs arrive they find the incident does not require any action, or attend and provide advice or standby support without taking operational action. They are different to false alarms where there was no incident to attend.
This group comprises three FaRDaP categories:
- advice only
- stand by
- no action (not false alarm)
In the year ending March 2026:
- FRSs attended 21,587 no action or advice incidents, an increase of 11% compared with the previous year (19,453), an increase of 87% compared with 5 years ago (11,531), and an increase of 150% compared with 10 years ago (8,647)
The number of no action or advice incidents decreased from 10,319 in the year ending March 2010 (the earliest year robust data are available) to a low of 7,539 in the year ending March 2015. Since then, the number of these incidents has been on an increasing trend, reaching 21,587 in the year ending March 2026. The pattern of growth since the mid 2010s broadly mirrors that seen for collaboration incidents, which may reflect the types of incidents that fire crews are called to including where attendance is required but no action is ultimately necessarily.
The largest category in the no action or advice group is ‘no action (not false alarm)’, accounting for 78% (16,759) of these incidents in the year ending March 2026. Regarding the other two categories in this group, FRSs attended 4,448 advice only incidents and 380 stand by incidents in the year ending March 2026.
For more detail on no action or advice incidents see Detailed analysis of non-fire incidents: England, April 2024 to March 2025, tables FIRE0901, FIRE0902 and FIRE0903 and the no action or advice incidents incident level dataset
8. Non-fire false alarms
False alarms are incidents FRSs attend where there never was an emergency requiring intervention. Non-fire false alarms are therefore those initially thought, at the time of the 999 call, to be a non-fire incident.
There are two FaRDaP categories within this group:
- malicious non-fire false alarm, where the caller to the fire service is aware there is no incident
- good intent non-fire false alarm, where the caller to the fire service genuinely believed there to be an incident
In the year ending March 2026:
- FRSs attended 10,841 non-fire false alarms, an increase of 8.2% compared with the previous year (10,015), an increase of 62% compared with 5 years ago (6,677), and an increase of 78% compared with 10 years ago (6,089)
The number of non-fire false alarms decreased from 13,208 in the year ending March 2010 (the earliest year robust data are available) to a low of 5,246 in the year ending March 2015. Since then, the number of these false alarms has been on an increasing trend, reaching 10,841 in the year ending March 2026.
Of these 10,841 non-fire false alarms in the year ending March 2026, the vast majority (10,515 or 97%) were good intent non-fire false alarms while only 326 (3.0%) were malicious non-fire false alarms. This share is broadly in line with all years for which consistent data are available.
For more detail on non-fire false alarms see Detailed analysis of non-fire incidents: England, April 2024 to March 2025, tables FIRE0901, FIRE0902 and FIRE0903 and the false alarms incidents incident level datasets
9. Remaining non-fire incidents
This group covers 10 incident categories, of which lift release has been clearly the largest in every year since consistent data are available. These categories are:
- lift release: 13,760 incidents in the year ending March 2026 (29% of remaining non-fire incidents)
- removal of objects from people: 7,167 incidents (15%)
- animal assistance incidents: 6,394 incidents (14%)
- other rescue or release of persons: 4,917 incidents (10%)
- making safe (not RTC): 4,165 incidents (8.8%)
- hazardous materials incidents: 5,094 incidents (11%)
- spills and leaks (not RTC): 3,151 incidents (6.7%)
- other transport incidents: 1,362 incidents (2.9%)
- evacuation (no fire): 1,246 incidents (2.6%)
- water provision: 22 incidents (rounded to 0.0%)
The total number of remaining non-fire incidents decreased from 48,697 in the year ending March 2010 (the earliest year for which robust data are available) to 33,295 in the year ending March 2015. The number of these incidents then increased gradually, reaching 44,541 in the year ending March 2022, aside from a dip in the year ending March 2021 (33,731 incidents) during the COVID-19 pandemic. Since the year ending March 2022, the figure has fluctuated around 45,000 incidents per year and was 47,278 in the year ending March 2026.
For more detail on the remaining non-fire incident group see Detailed analysis of non-fire incidents: England, April 2024 to March 2025, tables FIRE0901, FIRE0902, FIRE0903, FIRE0904 and FIRE0905 and the remaining non-fire incidents incident level datasets
9.1 Animal assistance incidents
Animal assistance incidents are non-fire incidents attended by Fire and Rescue Services (FRSs) involving assistance to animals. Incidents are recorded according to the type of animal and the type of assistance involved.
Incident records are based on the judgement of the lead fire officer at the time of the incident. Some incidents may cover multiple animal types or forms of assistance. In these cases, a single animal type and assistance type are recorded according to those considered the primary animal type and assistance provided.
Key results
In year ending March 2026:
- there were 6,394 animal assistance incidents attended by FRSs, compared to 5,888 in the previous year, 5,160 5 years ago and 4,416 10 years ago
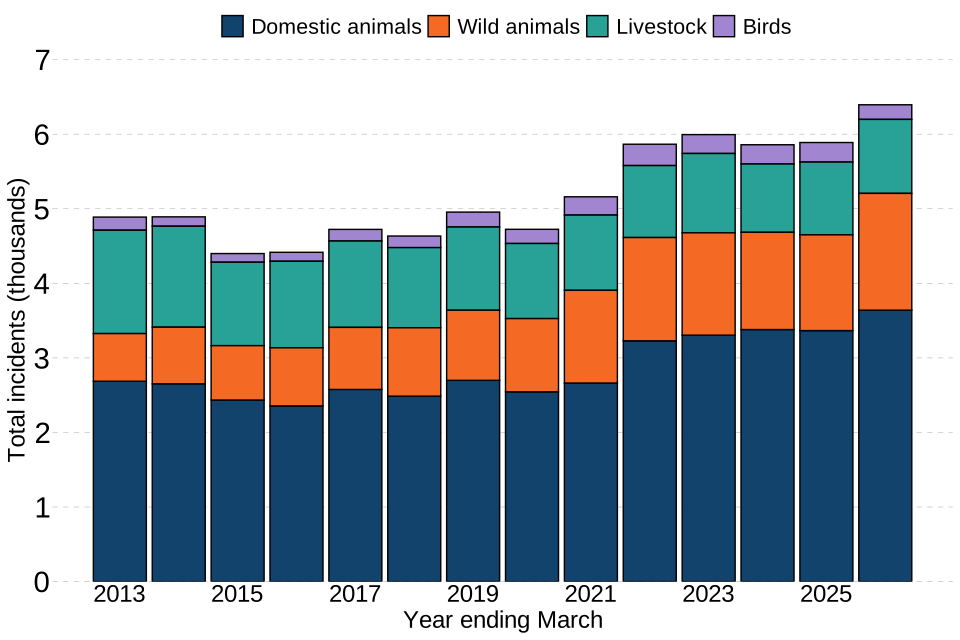
- 57% (3,640) of those 6,394 incidents were concerning domestic animals, whereas 24% (1,566) concerned wild animals, 16% (992) concerned livestock and 3.1% (196) concerned birds - these percentages were 53%, 18%, 26% and 2.7% respectively 10 years ago
- 44% (2,799) of those 6,394 incidents involved a trapped animal and a further 26% (1,652) involved an animal rescued from height - the two largest categories of assistance, compared with 38% (1,672) and 26% (1,151) respectively 10 years ago
9.1.1 Animal types assisted
As shown in Figure 9.1, the number of animal assistance incidents remained relatively stable between the year ending March 2013, when consistent data became available, and the year ending March 2021, at around 5,000 incidents per year. Since then, the number has increased to 6,394 incidents in the year ending March 2026.
The profile of animal type has remained broadly stable over time. In the year ending March 2026, 57% of incidents were concerning domestic, compared with 53% in the year ending March 2016. Domestic animals have consistently been the most common animal type in animal assistance incidents.
Wild animals accounted for 24% of animal assistance incidents in the year ending March 2026, making them the second largest animal group. This was an increase from 18% in the year ending March 2016, when they were the third largest group. Over the same period, the share of incidents involving livestock decreased from 26% to 16%. Birds remained the smallest animal group for these incidents attended in the year ending March 2026, accounting for 3.1% of animal assistance incidents, compared with 2.7% in the year ending March 2016.
Figure 9.1: Total animal assistance incidents attended by FRSs by animal type, England; year ending March 2013 to year ending March 2026
Note: X axis labelling is every other year starting 2013
9.1.2 Type of assistance
The types of animal assistance incidents have been relatively stable since comparable data became available. The most common type of assistance in the year ending March 2026 were incidents that involved a trapped animal, accounting for 44% of animal assistance incidents, compared with 38% 10 years ago. The second largest type of assistance in the year ending March 2026 involved an animal rescued from height, with 26% of animal assistance incidents, compared with 26% 10 years ago.
The other types of animal assistance are:
- rescue from water/mud (12% in the year ending March 2026)
- rescue from below ground (4.5%)
- dealing with animal harm (3.8%)
- lifting a heavy animal (2.7%)
- other (7.8%)
For more detail on animal assistance incidents see tables FIRE0901 and FIRE0902 and the animal assistance incident level datasets
10. Response times to non-fire incidents
This release includes, for the first time, statistics on average response times to non-fire incidents.
Total response time is defined as the minutes and seconds elapsed from the time of call to the arrival of the first vehicle at the incident.
The following incidents are not included in response time totals:
a. Where an FRS learned of the incident when it was known to have already been over (known as ‘late calls’)
b. Where the total response time for an incident was over an hour or less than 1 minute (to avoid erroneous data or exceptional incidents from skewing the averages)
c. Where the sequence of events (time of call - mobilisation - vehicle mobile - arrival at scene) in an incident is not recorded in a logical sequence, either through recording error (for example a vehicle appears to have arrived before it left) or absence of data (null values)
Key results
In year ending March 2026:
-
the average total response time to all non-fire incidents in England was 10 minutes and 17 seconds, which compares to 10 minutes and 21 seconds in the previous year (a decrease of 4 seconds), 10 minutes and 20 seconds 5 years ago (a decrease of 3 seconds) and 9 minutes and 58 seconds 10 years ago (an increase of 19 seconds)
-
the average total response time to collaboration incidents in England was 9 minutes and 52 seconds, which compared to 9 minutes and 49 seconds in the previous year (an increase of 3 seconds), 9 minutes and 49 seconds 5 years ago (an increase of 3 seconds) and 9 minutes and 54 seconds 10 years ago (a decrease of 2 seconds)
-
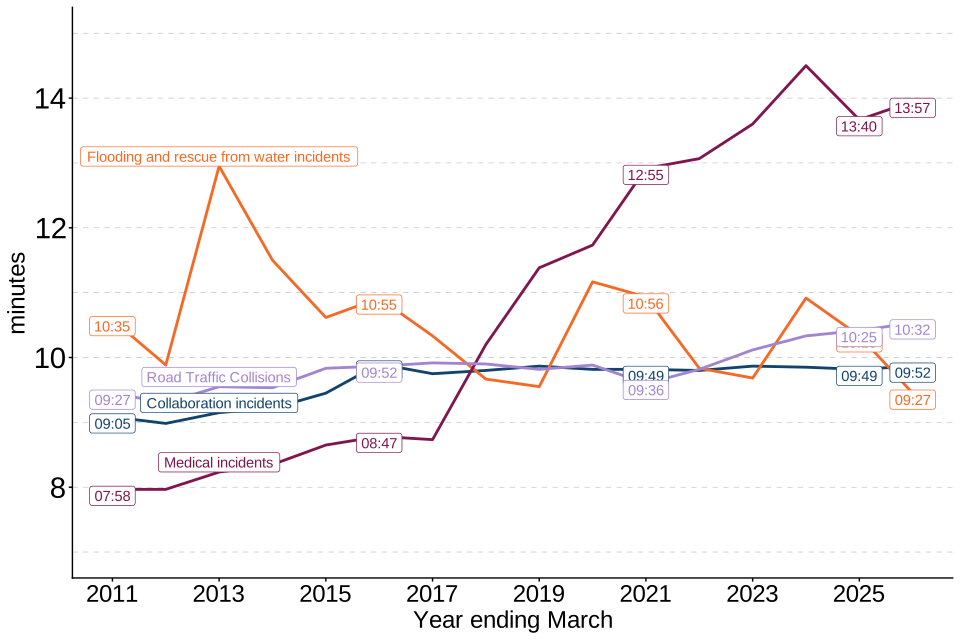
the average total response time to medical incidents in England was 13 minutes and 57 seconds, which compared to 13 minutes and 40 seconds in the previous year (an increase of 17 seconds), 12 minutes and 55 seconds 5 years ago (an increase of 1 minute 2 seconds) and 8 minutes and 47 seconds 10 years ago (an increase of 5 minutes 10 seconds)
10.1 Trends in average response times to non-fire incidents
Figure KR.2 and Figure 10.2 show that average response times to non-fire incidents steadily increased between the years ending March 2011, when comparable statistics became available, and 2020, increasing from 9 minutes and 38 seconds to 10 minutes and 19 seconds. Since 2020, average response times have largely plateaued, standing at 10 minutes and 17 seconds in the year ending March 2026. Average response times vary considerably between non-fire incident types.
10.2 Trends in average response times to non-fire incidents by incident group
As shown in Figure 10.1 average response times to medical incidents increased substantially over the period for which comparable data are available, increasing from 7 minutes and 58 seconds in the year ending March 2011 to 13 minutes and 57 seconds in the year ending March 2026. Response times increased relatively gradually up to the year ending March 2017 (8 minutes and 44 seconds) before increasing more rapidly and reaching a peak of 14 minutes and 30 seconds in the year ending March 2024.
The average response time to flooding and water rescue incidents was more volatile than for any other non-fire incident group over the period for which consistent data are available. The average response time peaked at 12 minutes and 57 seconds in the year ending March 2013 and 11 minutes and 10 seconds in the year ending March 2020. The average response time to flooding and water rescue incidents in the year ending March 2026 was 9 minutes and 27 seconds.
Both road traffic collisions and collaboration incidents showed slow increases over the period shown in Figure 10.1 that broadly tracked the overall figures for total non-fire incidents.
Figure 10.1: Average response times (minutes) to non-fire incidents for 4 incident groups, England; year ending March 2011 to year ending March 2026
Source: FIRE1005
10.3 Trends in average response times to non-fire incidents by time category
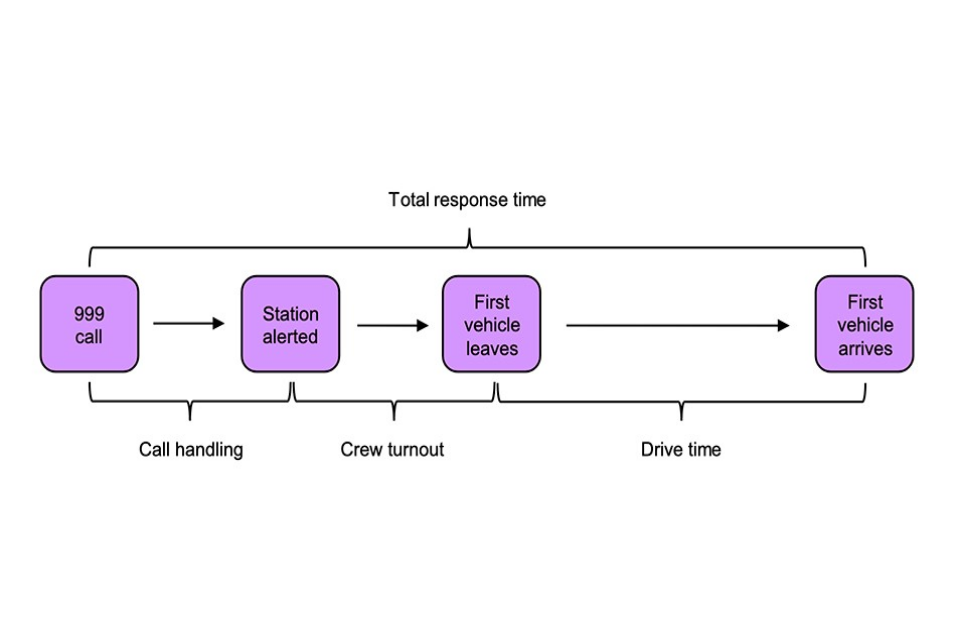
The total response time (from time of call to time of first arrival) can be divided into call handling time, crew turnout time and drive time. These data are drawn from the online data collection system and so are only available from year ending March 2011 onwards (see FIRE1001).
The components of response times are defined as:
- Call handling time is the duration between the time of call (when Command and Control in the Fire Control room received the call) and the point at which the station is alerted
- Crew turnout time is the duration between the time at which the station is alerted and the time the first vehicle departs (the time it takes for the firefighters to prepare to leave)
- Drive time is the duration between the time the first vehicle leaves to the time at which the first vehicle arrives at the scene of the incident (not necessarily the same vehicle)
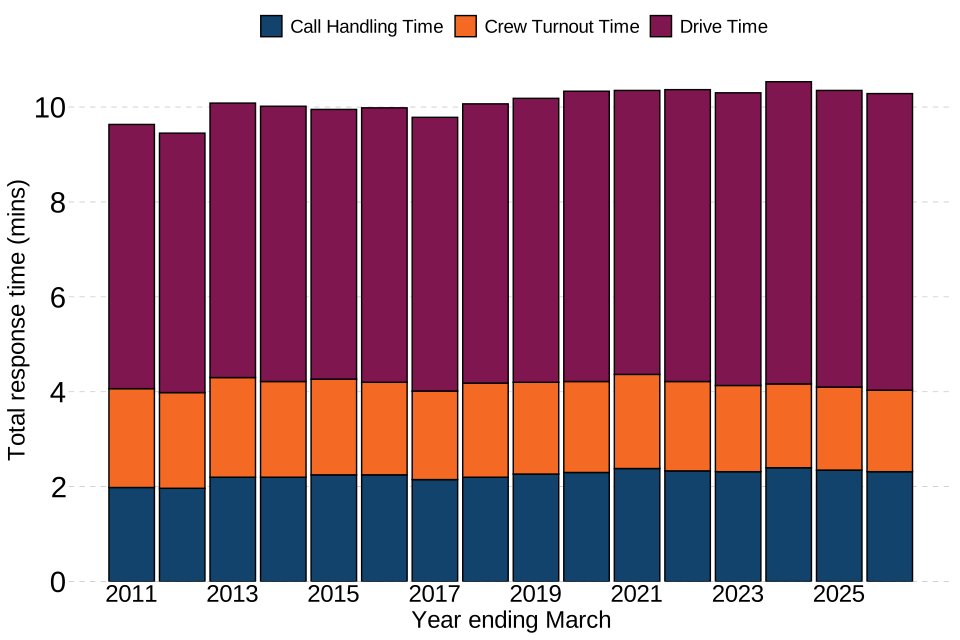
The main contributor to the slow upward trend in average response times to non-fire incidents was drive time. The total drive time in England in the year ending March 2011 was 5 minutes and 34 seconds, by the year ending March 2026 this was 6 minutes and 15 seconds. This increase broadly matches the increase in overall response time to non-fire incidents.
Figure 10.2: Average total response times (minutes) to non-fire incidents by time category, England; year ending March 2011 to year ending March 2026
Source: FIRE1005
For more detail on response times to non-fire incidents see table FIRE1005 and the various non-fire incident level datasets.
11. Summary of changes over time
Table 11.1: Number of non-fire incidents, comparing the year ending March 2026 with 1, 5 and 10 years previously
| Incident Group | Year ending March 2026 | Year ending March 2025 | One year change | Year ending March 2021 | Five year change | Year ending March 2016 | Ten year change |
|---|---|---|---|---|---|---|---|
| All non-fire | 215,583 | 211,900 | 1.7% | 151,031 | 43% | 153,006 | 41% |
| Collaboration | 75,060 | 73,526 | 2.1% | 46,346 | 62% | 25,998 | 189% |
| Medical | 10,602 | 13,632 | -22% | 13,807 | -23% | 31,339 | -66% |
| Flooding | 17,502 | 18,570 | -5.8% | 16,394 | 6.8% | 15,007 | 17% |
| RTCs | 32,713 | 32,216 | 1.5% | 22,545 | 45% | 30,901 | 5.9% |
| No action | 21,587 | 19,453 | 11% | 11,531 | 87% | 8,647 | 150% |
| False alarm | 10,841 | 10,015 | 8.2% | 6,677 | 62% | 6,089 | 78% |
| Remaining | 47,278 | 44,488 | 6.3% | 33,731 | 40% | 35,025 | 35% |
Source: FIRE0901
Table 11.2: Rate of fatalities per 1,000 non-fire incidents and percentage change, England, comparing the year ending March 2026 with 1, 5 and 10 years previously
| Incident Group | Year ending March 2026 | Year ending March 2025 | One year change | Year ending March 2021 | Five year change | Year ending March 2016 | Ten year change |
|---|---|---|---|---|---|---|---|
| All non-fire | 23 | 26 | -11% | 19 | 22% | 21 | 9.6% |
| Collaboration | 42 | 47 | -10% | 34 | 23% | 31 | 37% |
| Medical | 44 | 48 | -8.3% | 21 | 106% | 42 | 4.6% |
| Flooding | 8.7 | 9.8 | -11% | 6.2 | 42% | 5.9 | 47% |
| RTCs | 18 | 18 | -3.5% | 22 | -18% | 23 | -24% |
| No action | 5.0 | 4.9 | 2.3% | 5.1 | -1.3% | 4.6 | 9.2% |
| Remaining | 6.4 | 7.0 | -8.6% | 6.6 | -4.1% | 4.5 | 40% |
Note: Non-fire false alarms cannot result in a fatality and therefore are excluded from this summary table.
Source: FIRE0904b
Table 11.3: Average response times to non-fire incidents, England, comparing the year ending March 2026 with 1, 5 and 10 years previously
| Incident Group | Year ending March 2026 | Year ending March 2025 | One year change | Year ending March 2021 | Five year change | Year ending March 2016 | Ten year change |
|---|---|---|---|---|---|---|---|
| All non-fire | 10m 17s | 10m 21s | -4s | 10m 20s | -3s | 9m 58s | +19s |
| Collaboration | 9m 52s | 9m 49s | +3s | 9m 49s | +3s | 9m 54s | -2s |
| Medical | 13m 57s | 13m 40s | +17s | 12m 55s | +1m 2s | 8m 47s | +5m 10s |
| RTCs | 10m 32s | 10m 25s | +7s | 9m 36s | +56s | 9m 52s | +40s |
| Flooding and water rescues | 9m 27s | 10m 20s | -53s | 10m 56s | -1m 29s | 10m 55s | -1m 28s |
| No action | 10m 06s | 10m 02s | +4s | 10m 14s | -8s | 10m 58s | -52s |
| Remaining | 10m 26s | 10m 26s | 0s | 10m 24s | +2s | 10m 30s | -4s |
Note: Non-fire false alarms are excluded from this summary table.
Source: FIRE1005
If you have any comments, suggestions, or enquiries, please contact the team via email using firestatistics@communities.gov.uk.
12. Further information
Fire statistics tables, guidance and statistical releases
All fire-related Ministerial responsibilities moved from the Home Office to the Ministry of Housing, Communities and Local Government (MHCLG) on 1 April 2025. This change followed a recommendation from the Phase 2 report of the Grenfell Tower Inquiry, to bring all fire safety functions under one department. Therefore, as part of this move, all statistical publications and analysis on fire functions were also subject to the Machinery of Government (MoG) change.
Fire and rescue incident statistics and other MHCLG statistical releases are available via the Ministry of Housing, Communities and Local Government statistics release calendar pages on the GOV.UK website.
Fire Statistics publish 4 other statistical releases covering Fire and Rescue Services.
These include:
- Fire and rescue incident statistics: National Statistics on fires, casualties, false alarms and non-fire incidents attended by the fire and rescue services in England.
- Detailed analysis of fires and response times attended by fire and rescue services in England: focuses on fires attended by fire and rescue services across England, fire-related fatalities and non-fatal casualties in those fires; including analyses of the causes of fires, smoke alarm ownership and operation, average response times to fires attended by fire and rescue services
- Fire workforce and pension statistics: Information on total workforce, the diversity of the workforce, staff leaving and joining, firefighter injuries, attacks on firefighters, firefighters’ pensions
- Fire prevention and protection statistics, England: focuses on trends in smoke alarm ownership, fire prevention and protection activities by fire and rescue services
Data tables linked to this release and all other fire statistics releases can be found on MHCLG’s Fire statistics data tables page.
Guidance for using these statistics and other fire statistics outputs, including a Quality Report, is available on the fire statistics guidance page.
All fire-related Ministerial responsibilities moved from the Home Office to the Ministry of Housing, Communities and Local Government (MHCLG) on 1 April 2025. This change followed a recommendation from the Phase 2 report of the Grenfell Tower Inquiry, to bring all fire safety functions under one department. Therefore, as part of this move, all statistical publications and analysis on fire functions were also subject to the Machinery of Government (MoG) change.
Other related publications
The Ministry of Housing, Communities and Local Government (MHCLG) also publish statistical releases on fire.
These include:
- the English Housing Survey: fire and fire safety report focuses on the extent to which the existence of fire and fire safety features vary by household and dwelling type and this report focuses on whether people felt safe from fire in their homes by household and dwelling type
Fire statistics are published by the other UK nations:
Scottish fire statistics and Welsh fire statistics are published based on the FaRDaP Fire statistics for Northern Ireland are published by the Northern Ireland Fire and Rescue Service using data from a system similar to the FaRDaP, which means that it is not directly comparable to English, Welsh and Scottish data.
Fire and Rescue Data Platform (FaRDaP) data collection system
This release contains statistics on incidents attended by fire and rescue services (FRSs) in England. Incident data was collected through the Incident Recording System (IRS) until November 2025. Since then, the statistics have been sourced from the Fire and Rescue Data Platform (FaRDaP).
FaRDaP allows FRSs to complete an incident record for every incident attended, including fires, false alarms and non-fire incidents (also known as special service incidents).
Over the coming months, FRSs will begin transitioning to FaRDaP v2. The new version includes additional questions, amendments to existing questions, and new response options for some existing questions. For example, a new response option of ‘air fryer’ has been added to the question on sources of ignition.
We intend to publish statistics derived from some of these new data items. The scope and timing of these publications will depend on the rate at which FRSs transition to FaRDaP v2 and the quality and completeness of the data collected through the new and amended questions.
Revisions
FaRDaP is a continually updated database, with FRSs adding incidents daily. The figures in this release refer to records of incidents that occurred up to and including the end of March 2026. This includes incident records that were submitted to FaRDaP by 12 May 2026, when a snapshot of the database was taken for the purpose of analysis. As a snapshot of the data set was taken on 12 May 2026, the statistics published may not match those held locally by FRSs and revisions may occur in the future. This is particularly the case for statistics with relatively small numbers, such as fire-related fatalities. For instance, this can occur because coroner’s reports may mean the initial view taken by the FRS will need to be revised; this can take many months, even years, to do so.
Between September 2024 and June 2025 Suffolk FRS could not submit all incidents due to technical reasons. Figures for Suffolk over this time period are therefore an underestimate.
Accredited official statistics status
Following the National Statistics designation review by the Office for Statistics Regulation the term ‘Accredited Official Statistics’ was introduced to describe National Statistics in September 2023. This release was formerly badged as ‘National Statistics’ and should now be considered ‘Accredited Official Statistics’. National Statistics is the legal term set out in the Statistics and Registration Service Act 2007 for ‘Accredited Official Statistics’ that have been judged by the Office for Statistics Regulation (OSR)[footnote 1], to comply with the Code of Practice for Statistics (‘the Code’). This means these statistics meet the standards of trustworthiness, quality and value as set out in ‘the Code’. Further information about accredited official statistics can be found on the OSR’s website.
The information published in this release is kept under review, taking into account the needs of users and burdens on suppliers and producers, in line with the Code of Practice for Statistics. The Office for Statistics Regulation carried out a compliance check in 2021 of the fire and rescue incident statistics against the Code of Practice, this was conducted when fire policy was under Ministerial responsibility of the Home Office. The results can be found in a letter to the Head of Profession published on the OSR website.
If you have any comments, suggestions or enquiries, please contact the team via email using firestatistics@communities.gov.uk.
Percentages greater than or equal to 10% have been rounded to the nearest whole number. The term ‘virtually unchanged’ is used in relation to percentage changes of less than 0.5%.
-
OSR are the regulatory arm of the UK Statistics Authority. ↩