DESNZ Public Attitudes Tracker: Net zero and climate change, Summer 2026, UK
Published 27 October 2026

© Crown copyright 2026
This publication is licensed under the terms of the Open Government Licence v3.0 except where otherwise stated. To view this licence, visit nationalarchives.gov.uk/doc/open-government-licence/version/3 or write to the Information Policy Team, The National Archives, Kew, London TW9 4DU, or email: psi@nationalarchives.gov.uk.
Where we have identified any third party copyright information you will need to obtain permission from the copyright holders concerned.
This publication is available at https://www.gov.uk/government/statistics/desnz-public-attitudes-tracker-summer-2026/desnz-public-attitudes-tracker-net-zero-and-climate-change-summer-2026-uk
The DESNZ Public Attitudes Tracker is a nationally representative annual survey of adults (aged 16 and over) in the UK that tracks public awareness, attitudes, and behaviours relating to the policies of the Department for Energy Security and Net Zero (DESNZ), such as energy and climate change.
This report provides a summary of the headline findings relating to net zero and climate change from the Summer 2026 wave of the Tracker, which ran from 7 July to 12 August 2026.
Notes for interpretation of findings
Differences between groups are only reported where they are statistically significant at the 95% confidence level.
The annual personal income referred to in the report is a self-reported measure.
Line charts included in this report, based on a longer time series, use abbreviated season names in the x-axis (for example, Summer 2026 = Sum 2026).
The age-related findings are reported using six age groups (16-24, 25-34, 35-44, 45-54, 55-64, 65 and over). In some cases, findings across age groups have been combined to describe a general trend; for example, ‘between 78% and 88% of people aged 45 and above’ refers to the range of percentages for the three age groups 45-54, 55-64, and 65 and over.
Some of the geographical findings have fluctuated over time. These variations may, in part, be due to the base sizes in specific areas and the wide geographic area covered by regions. This also applies to other subgroup findings that have low base sizes.
Two summary self-reported measures are used in this report:
- ‘Awareness’ encompasses all respondents who said they had heard of a particular concept or technology, including those who said they knew ‘hardly anything but I’ve heard of this’, ‘a little’, ‘a fair amount’, or ‘a lot’.
- ‘Knowledge’ encompasses those who said that they knew ‘a fair amount’ or ‘a lot’ about a topic.
Awareness of net zero
In June 2019, the government announced a target which will require the UK to bring all greenhouse gas emissions to net zero by 2050. Before asking about the level of awareness, respondents were provided with a brief description as follows: ‘The UK government is aiming to reduce UK greenhouse gas emissions to ‘net zero’ by 2050. This will involve significantly reducing emissions produced by our industries, transport, food, and homes. Any remaining emissions will be balanced by actions that reduce greenhouse gases already in the atmosphere, such as planting trees’.
Figure 1.1 displays the longer-term trends in overall awareness (had at least heard of it) and knowledge (a lot/fair amount) of net zero (line chart). It also displays the detailed awareness and knowledge data for the most recent two waves alongside the baseline (bar chart).
In Summer 2026, overall awareness of net zero increased to 91%, back up from 89% in Spring 2026, while overall knowledge decreased to 50% from 53% in Spring 2026.
Over the longer term, awareness has remained broadly stable, at around nine in ten since Winter 2021. There has been slightly more fluctuation in levels of knowledge (between 46% and 53% over the period of tracking), but with no sustained change since Winter 2021.
Figure 1.1: Awareness of the concept of ‘net zero’ (% based on all people), Autumn 2021 to Summer 2026
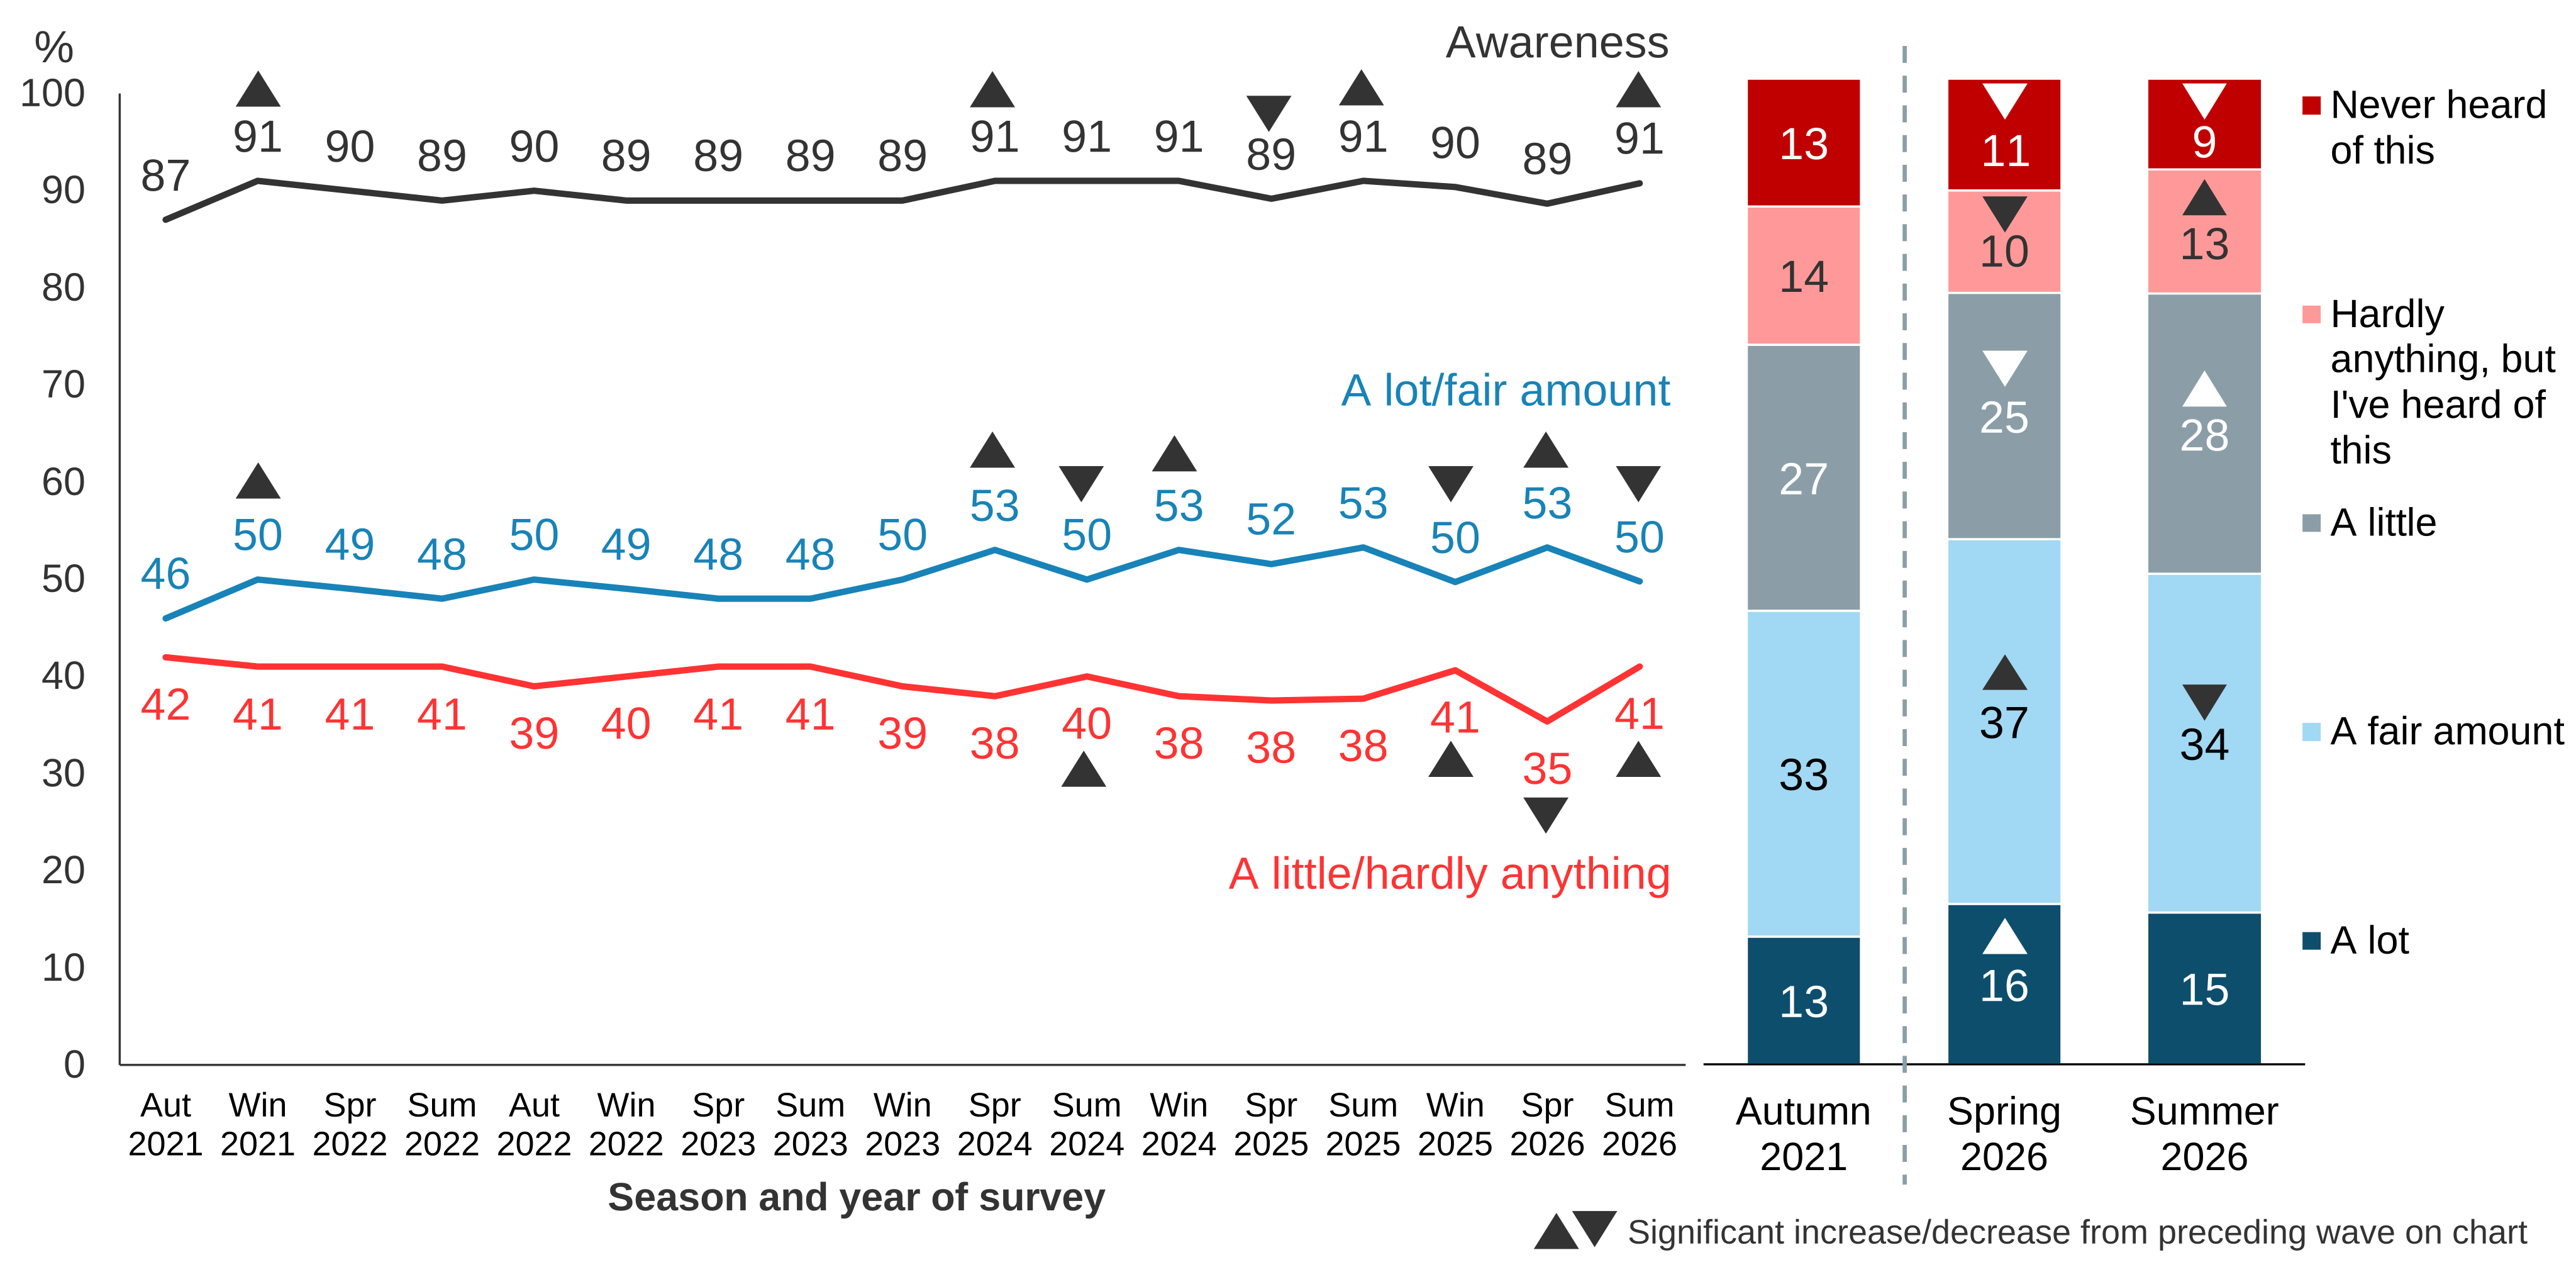
NZKNOW. The UK government is aiming to reduce UK greenhouse gas emissions to ‘net zero’ by 2050. This will involve significantly reducing emissions produced by our industries, transport, food, and homes. Any remaining emissions will be balanced by actions that reduce greenhouse gases already in the atmosphere, such as planting trees. Before today, how much, if anything, did you know about the concept of ‘net zero’?
Base: All wave respondents – Autumn 2021 (5,558), Winter 2021 (3,705), Spring 2022 (4,374), Summer 2022 (4,489), Autumn 2022 (4,158), Winter 2022 (3,572), Spring 2023 (4,405), Summer 2023 (3,998), Winter 2023 (3,741), Spring 2024 (4,085), Summer 2024 (3,640), Winter 2024 (3,214), Spring 2025 (3,411), Summer 2025 (3,526), Winter 2025 (3,282), Spring 2026 (3,388), Summer 2026 (3,239) (Asked each wave).
Note: On the line chart, arrows denote a significant difference between one wave and the next. For the bar chart, significant differences are noted between Autumn 2021 and Spring 2026, and between Spring 2026 and Summer 2026.
Analysis by subgroups
Self-reported knowledge of net zero was higher among the following subgroups:
- People in age groups 55 and over: between 54% and 56%, compared with between 44% and 46% of those in age groups 16 to 44.
- People with a degree: 66% compared with 43% of those with another kind of qualification and 35% of those with no qualifications.
Attitudes towards net zero
Each summer, questions are asked about attitudes towards net zero. These questions are preceded by the following introductory text: ‘And now thinking again about the UK government’s aim to reduce UK greenhouse gas emissions to net zero by 2050 to tackle climate change. This will involve large changes to the way we produce and use energy in homes, businesses and transport.’
Questions on these topics were asked in two parts: firstly, people were asked to consider the short-term impacts of net zero (one to two years); and secondly, people were asked to consider the longer-term impacts (10 years or more).
In Summer 2026, similar to previous summer waves, the expected impact of net zero on the UK economy was more likely to be negative (39%) than positive (22%) in the short term. In the longer term, however, expectations remained more positive (51%) than negative (24%) (Figure 1.2).
Attitudes were largely unchanged since Summer 2025. Short-term expectations were broadly in line with those seen at the Summer 2023 baseline. There was, however, a higher proportion saying they expected a negative impact in the long term in Summer 2026 (24%) than in Summer 2023 (18%).
Figure 1.2: Expected impact of UK’s transition to net zero on UK economy (% based on all people), Summer 2023 to 2026
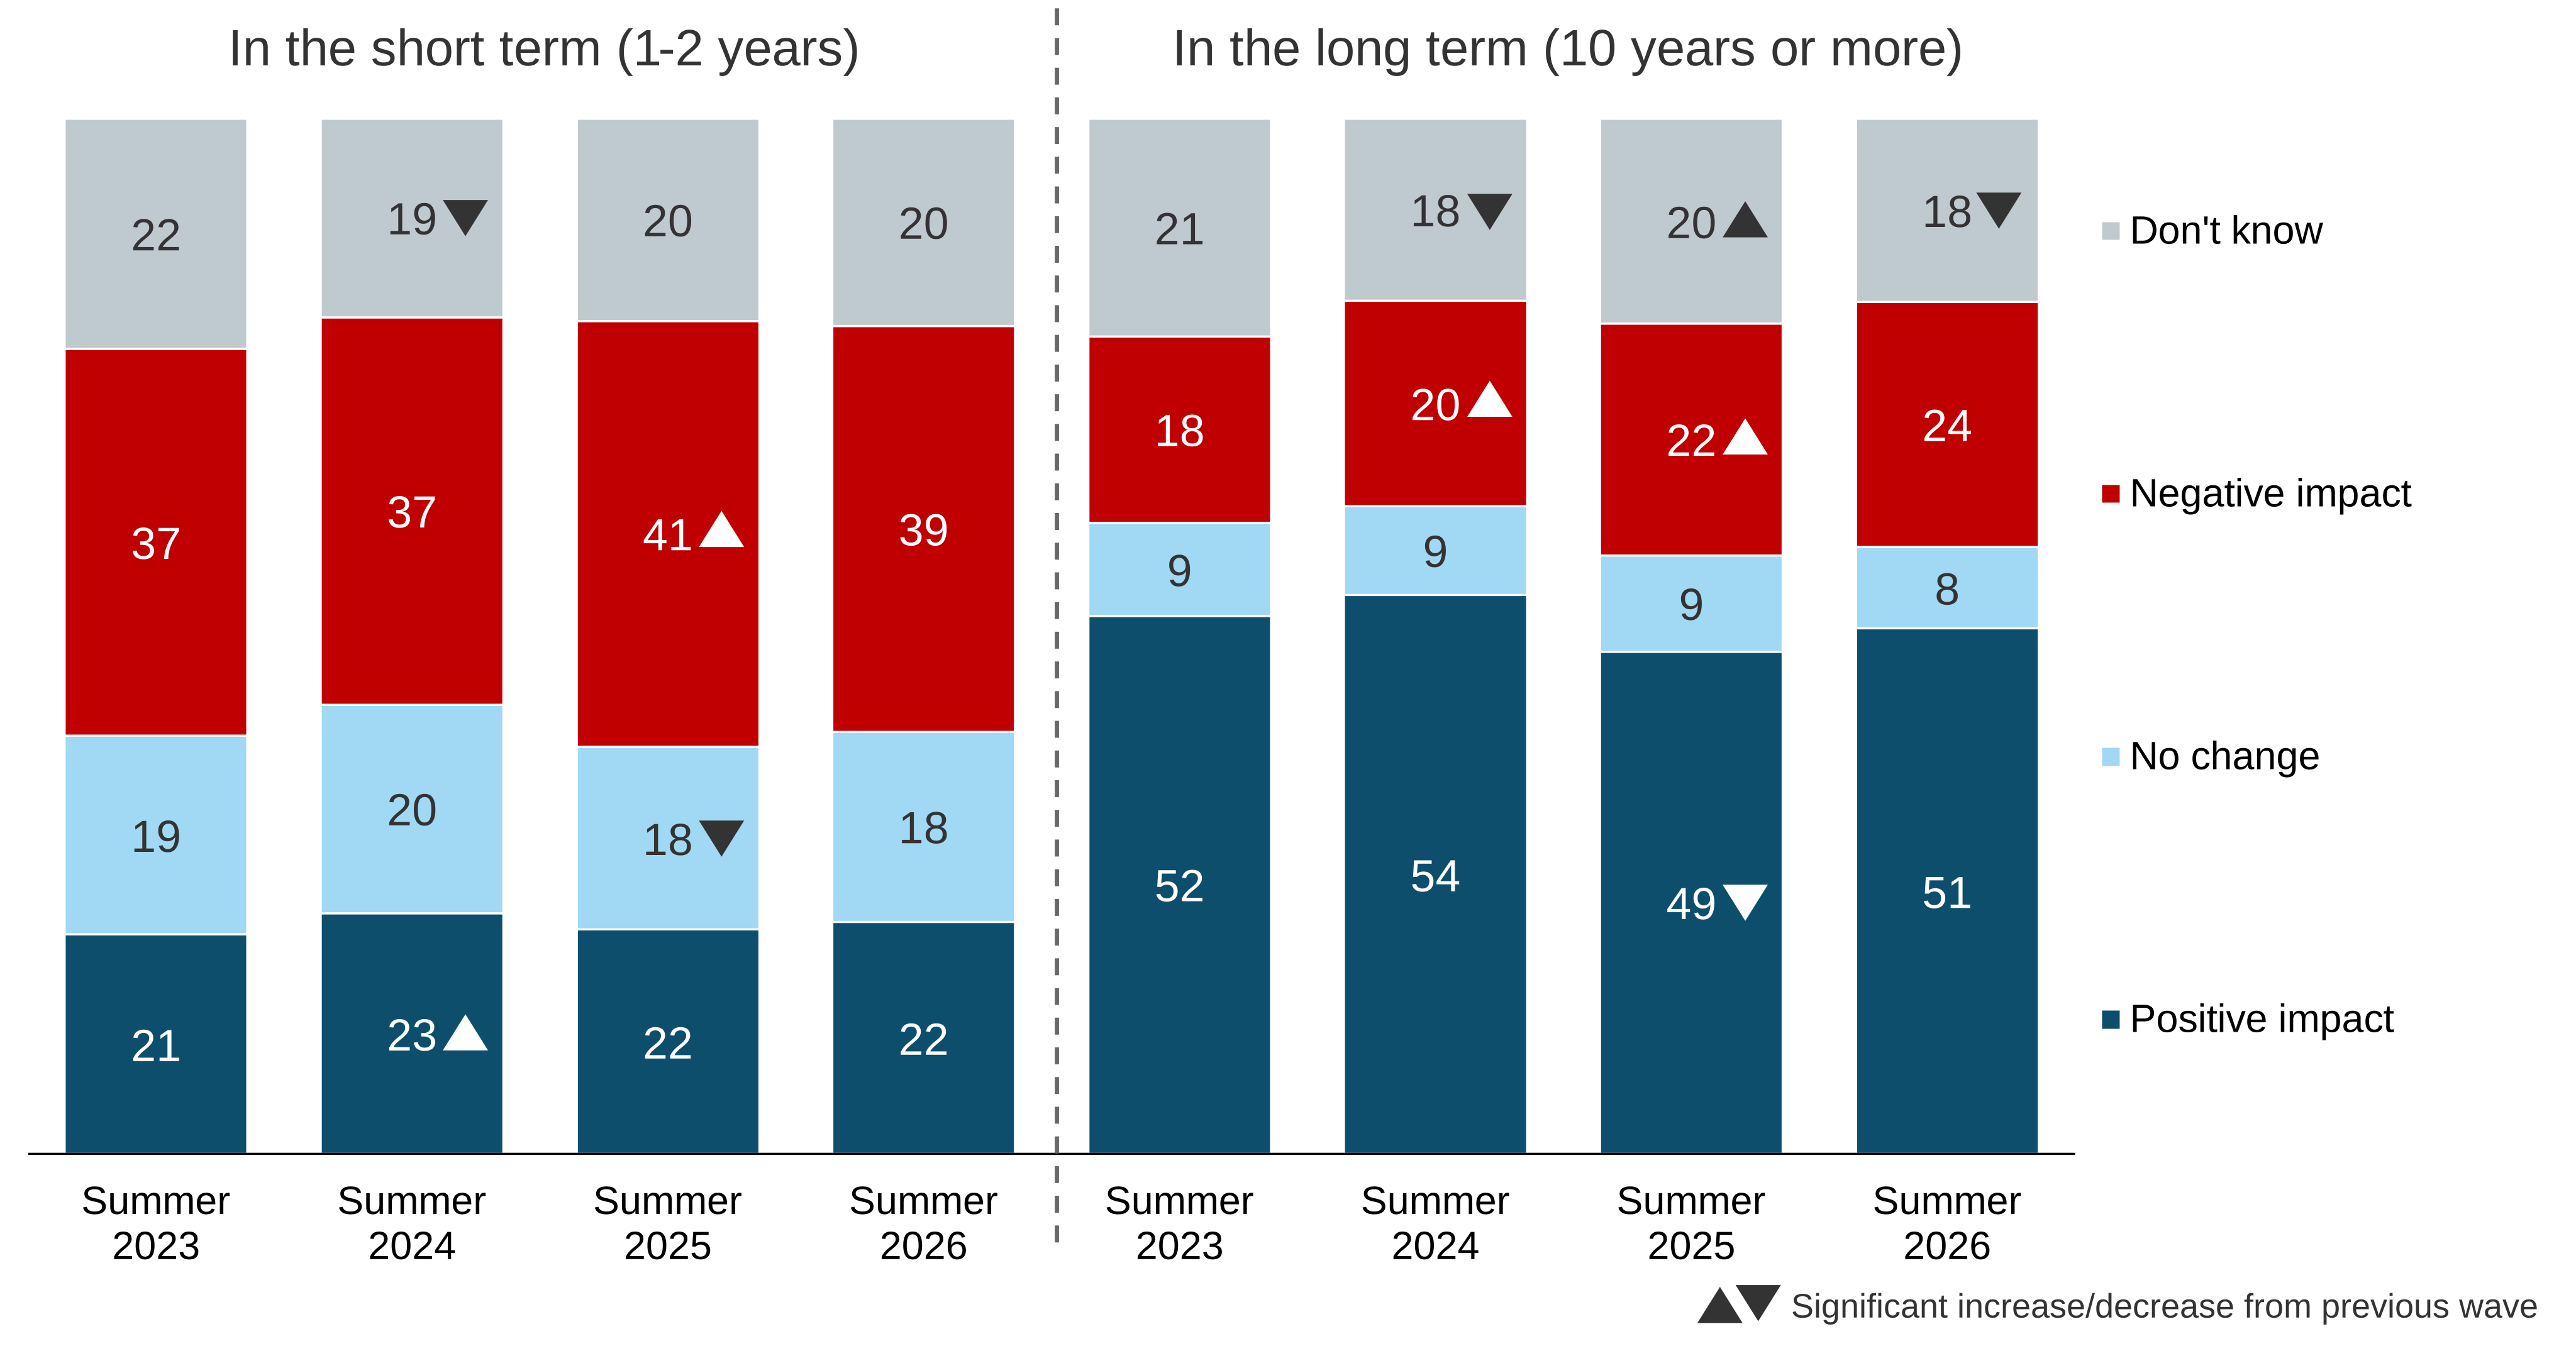
NZTRANSITA-B. What impact do you think the UK’s transition to Net Zero might have on the UK economy?
Base: All wave respondents – Summer 2023 / Summer 2024 / Summer 2025 / Summer 2026: Short term (3,969/3,627/3,504/3,224), Long term (3,975/3,623/3,508/3,233).
Analysis by subgroups
In terms of perceptions of impact of net zero on the UK economy:
By age:
- Older people were less likely to expect a positive impact in the short term (16% of those aged 65 and over, compared with between 21% and 31% of people in age groups from 16 to 64), with it being highest for those aged 25 to 34.
- There were similar age differences in expectations of longer-term positive impacts (between 39% and 42% of those in age groups over 54 compared with between 52% and 67% of those in age groups from 16 to 54).
By geography:
- People living in Scotland and the East of England were less likely than those in most other regions to expect a positive impact in the short term (both 13% vs 22% overall).
- Those in London were most likely to expect a positive impact in the longer term (62%); in contrast people living in the East Midlands (44%) and Scotland (41%) were least likely to expect a positive long-term impact.
By education:
- People with a degree were more likely to expect a positive impact in the short term (28%) than those with another kind of qualification (19%) or no qualifications (20%). There were more pronounced differences in the proportions who expected positive impacts in the long term (63% for those with a degree vs 45% of those with another kind of qualification and 40% of those with no qualifications).
In Summer 2026, 62% of people expected their regular living expenses to increase in the short term because of the transition to net zero. This was down from 69% in Summer 2025 and is the lowest level yet (Figure 1.3). Meanwhile, 11% expected their regular living expenses to decrease in the short term as a result of net zero.
While people were more positive about the impact of the transition to net zero in the longer term compared with the shorter term, people were still more likely to expect an increase (49%) than a decrease (26%) in regular living expenses. These findings were in line with previous waves.
Figure 1.3: Expected impact of UK’s transition to net zero on regular living expenses (% based on all people), Summer 2023 to 2026
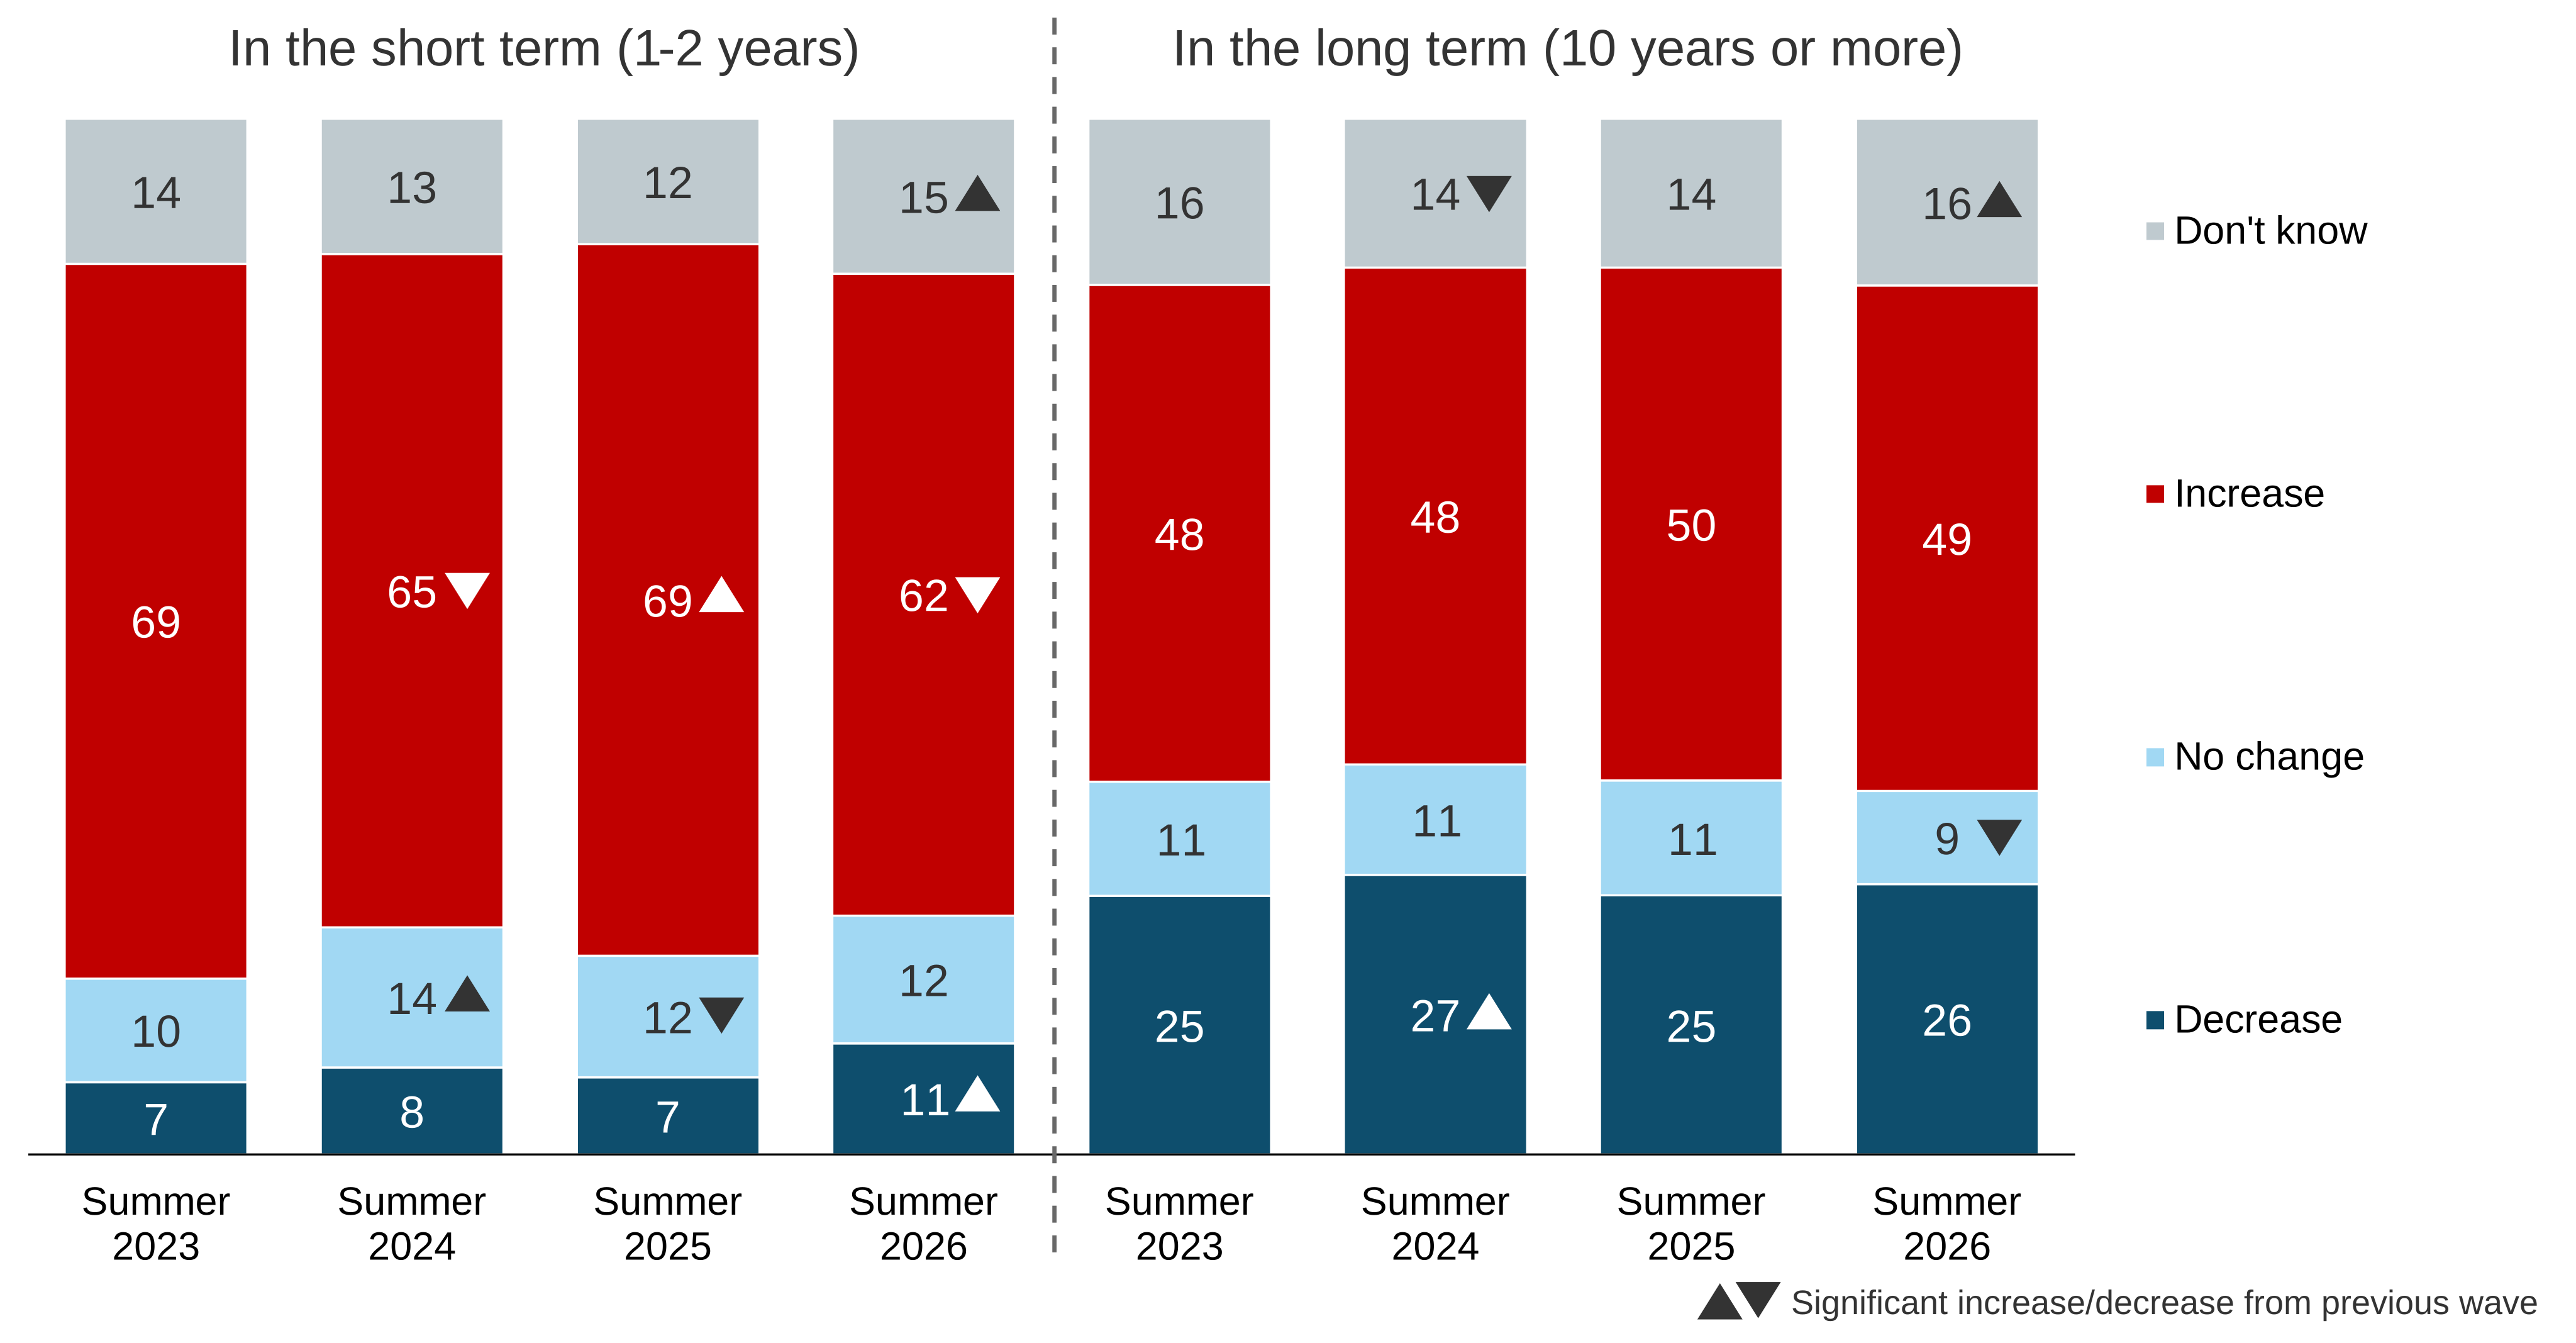
NZFINANCEA-B. And what impact do you think that the UK’s transition to Net Zero might have on your regular living expenses (for example energy, food, travel)?
Base: All wave respondents – Summer 2023 / Summer 2024 / Summer 2025 / Summer 2026: Short term (3,979/3,633/3,517/3,226), Long term (3,974/3,622/3,506/3,230).
Analysis by subgroups
Differences in expectations for the impact of net zero on personal regular living expenses included:
By age:
- Older people were more likely than younger people to expect an increase in their regular living expenses in the short term: 70% of people aged 65 and over compared with 52% of those aged under 25.
- There was a similar difference when considering longer-term impacts on living expenses: 56% of people in age groups over 54 expected an increase, compared with 42% of those in age groups under 35.
By geography:
- Expectations of a short-term increase in living expenses were highest in the South East (67%) and lowest in the North East (57%)
- Expectations of a longer-term increase were highest in the East of England (52%) and the South East (51%) and lowest in Wales (40%).
By education:
- Expectations of an increase in the longer term were higher among people with no qualifications (56%) and those with a non-degree qualification (54%), compared with 41% of those with a degree.
Concern about climate change
In Summer 2026, 79% said they were concerned overall about climate change and 38% said they were very concerned, up from 34% in Spring 2026 (Figure 1.4).
Over time, overall concern declined from 85% in Autumn 2021 to 79% in Summer 2026. The proportion who were very concerned fell from 44% to 38% over the same period, typically with dips in concern in the Winter waves. The increase to 38% in Summer 2026 marked a return to the levels seen in Summer 2025.
Figure 1.4: Concern about climate change (% based on all people), Autumn 2021 to Summer 2026
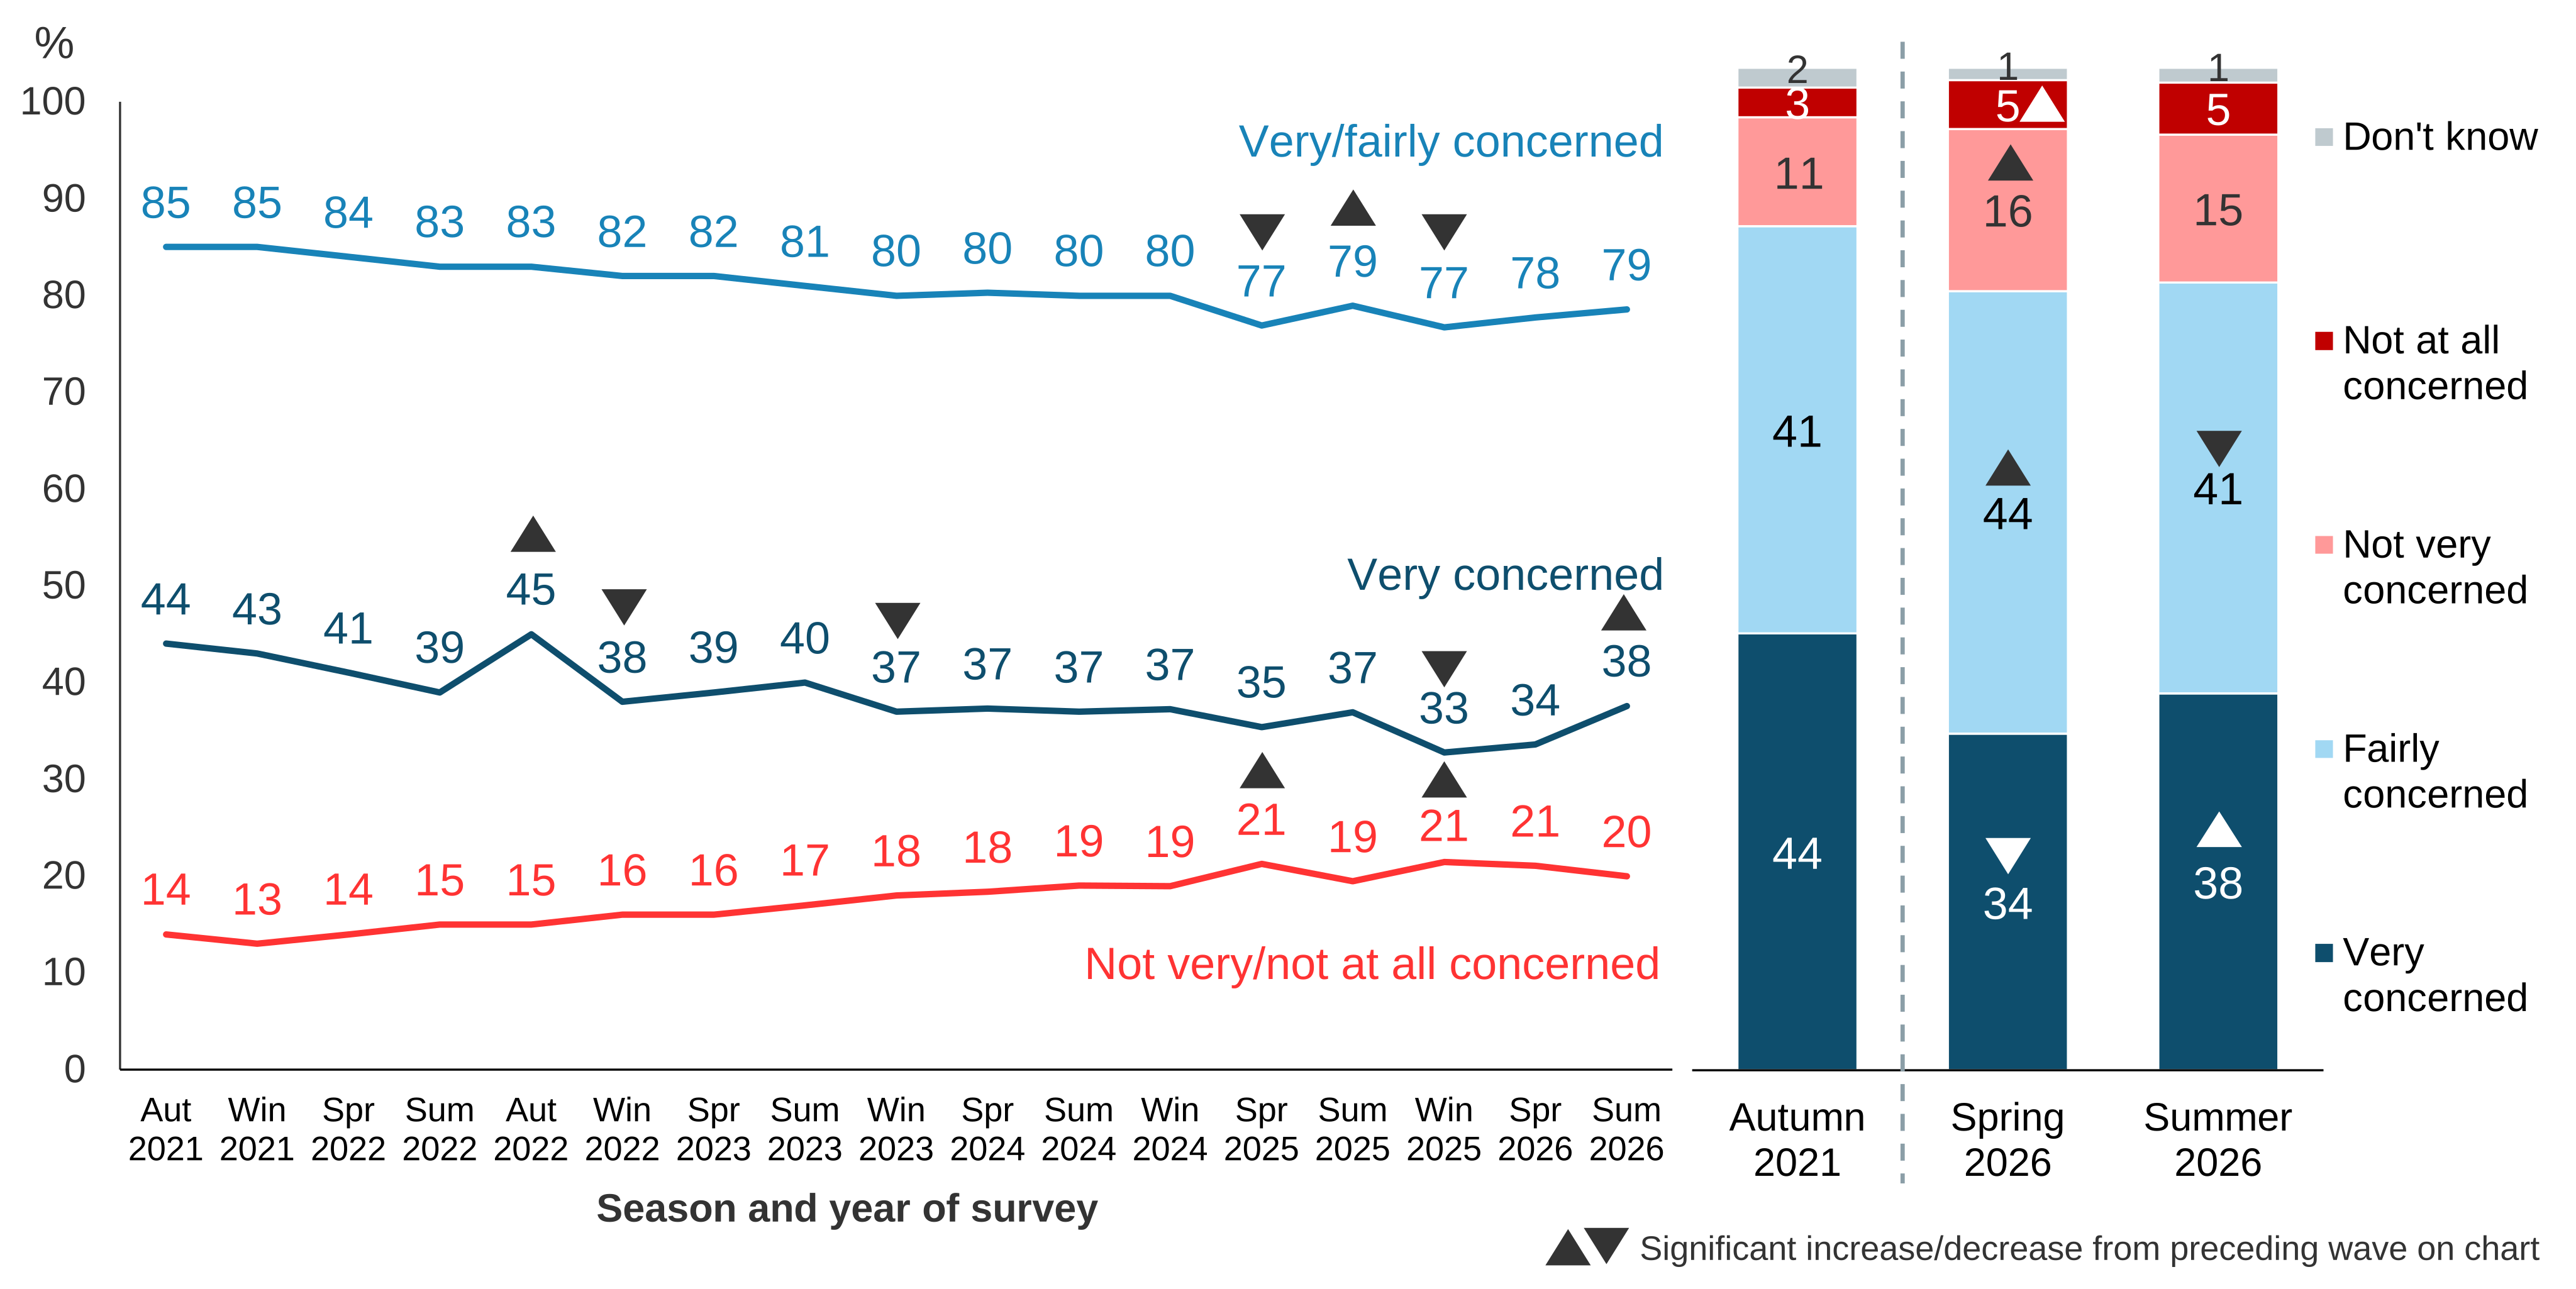
CLIMCONCERN. How concerned, if at all, are you about climate change, sometimes referred to as ‘global warming’?
Base: All wave respondents – Autumn 2021 (5,557), Winter 2021 (3,701), Spring 2022 (4,375), Summer 2022 (4,490), Autumn 2022 (4,158), Winter 2022 (3,571), Spring 2023 (4,405), Summer 2023 (3,998), Winter 2023 (3,739), Spring 2024 (4,086), Summer 2024 (3,644), Winter 2024 (3,213), Spring 2025 (3,408), Summer 2025 (3,531), Winter 2025 (3,281), Spring 2026 (3,386), Summer 2026 (3,240) (Asked each wave).
Note: On the line chart, arrows denote a significant difference between one wave and the next. For the bar chart, significant differences are noted between Autumn 2021 and Spring 2026, and between Spring 2026 and Summer 2026.
Analysis by subgroups[footnote 1]
The proportion reporting that they were very concerned about climate change was higher among the following subgroups:
- People with a degree: 48% compared with those with another kind of qualification (32%), and those with no qualifications (36%).
- People living in Wales (43%), London (42%), and the South East (41%); in contrast people living in Scotland (31%) were least likely to be very concerned.
Consistently over time, climate change concern has been higher for women than men. Furthermore, overall concern has fallen more for men than women over time. For example, when the time series started in Autumn 2021, 87% of women and 82% of men were concerned overall about climate change (a five percentage point difference), while in Summer 2026, 84% of women and 74% of men said they were concerned (a 10 percentage point difference).
Attitudes towards climate change
In each Summer survey wave, people are asked how much they agree or disagree with a range of attitude statements about climate change. Figure 1.5 shows the results for attitudes related to information, and Figure 1.6 shows attitudes related to behaviour.
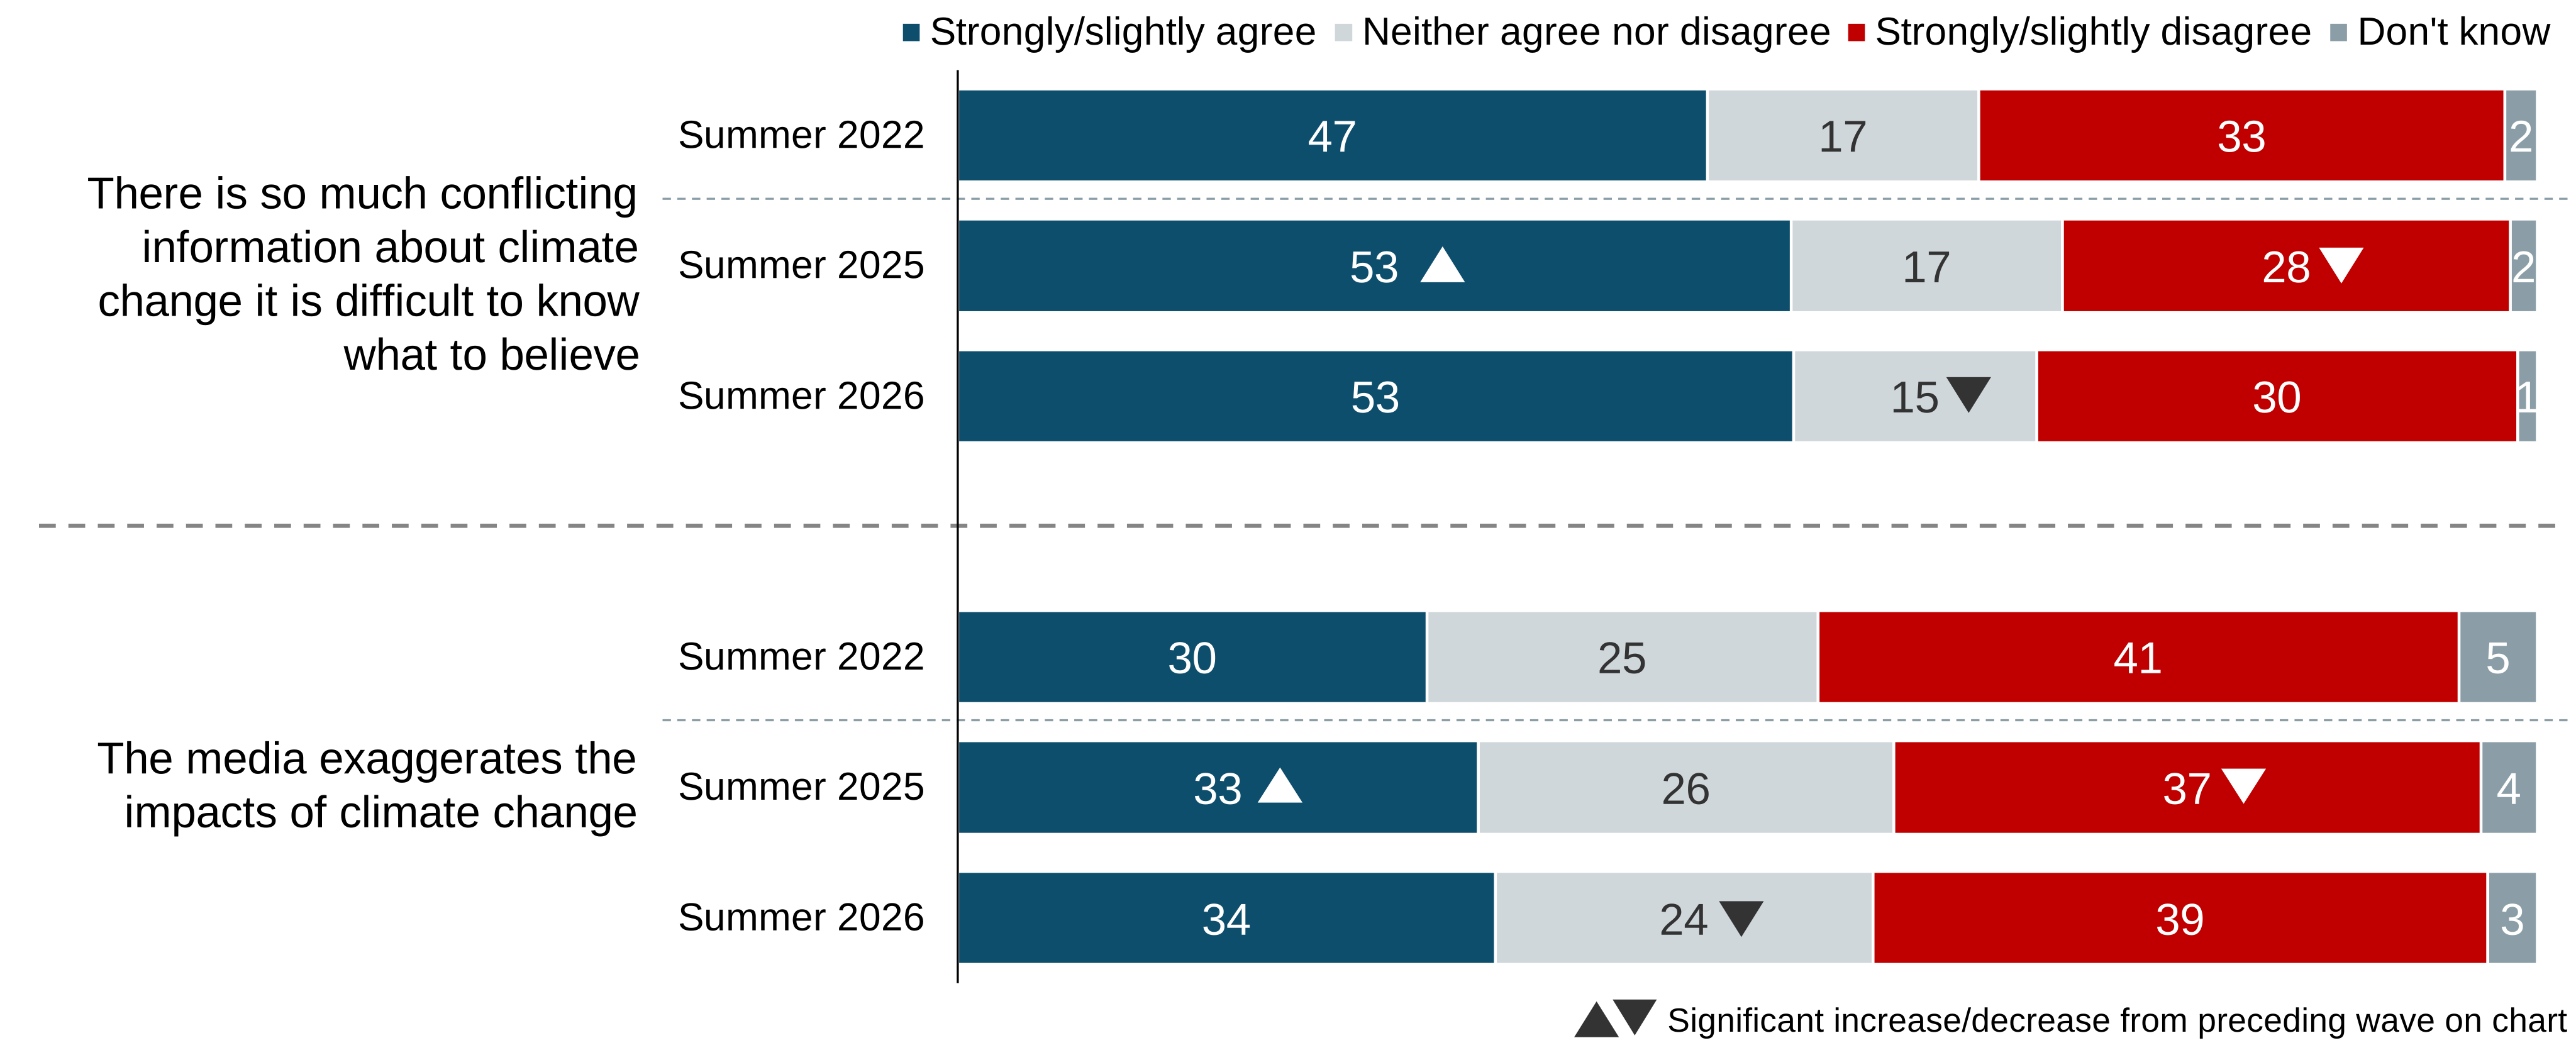
In terms of attitudes towards information on climate change (Figure 1.5), 53% of people in Summer 2026 agreed ‘that there is so much conflicting information about climate change it is difficult to know what to believe’. This figure has increased since the baseline in Summer 2022 (47%) but with no further increase since Summer 2025.
A third (34%) agreed ‘that the media exaggerates the impacts of climate change’. This was an increase compared with Summer 2022 (30%) but the proportion remained stable compared with Summer 2025.
Figure 1.5: Attitudes towards climate change information (% based on all people), baseline wave (Summer 2022) and two most recent waves (Summer 2025 and 2026)
CCATTA-E. How much do you agree or disagree with the following statements?
Base: All wave respondents – Summer 2022 / Summer 2025 / Summer 2026: So much conflicting information (4,475/3,515/3,228), Media exaggerates (4,473/3,512/3,231).
Note: The chart for this question has been separated into two sections to enhance readability.
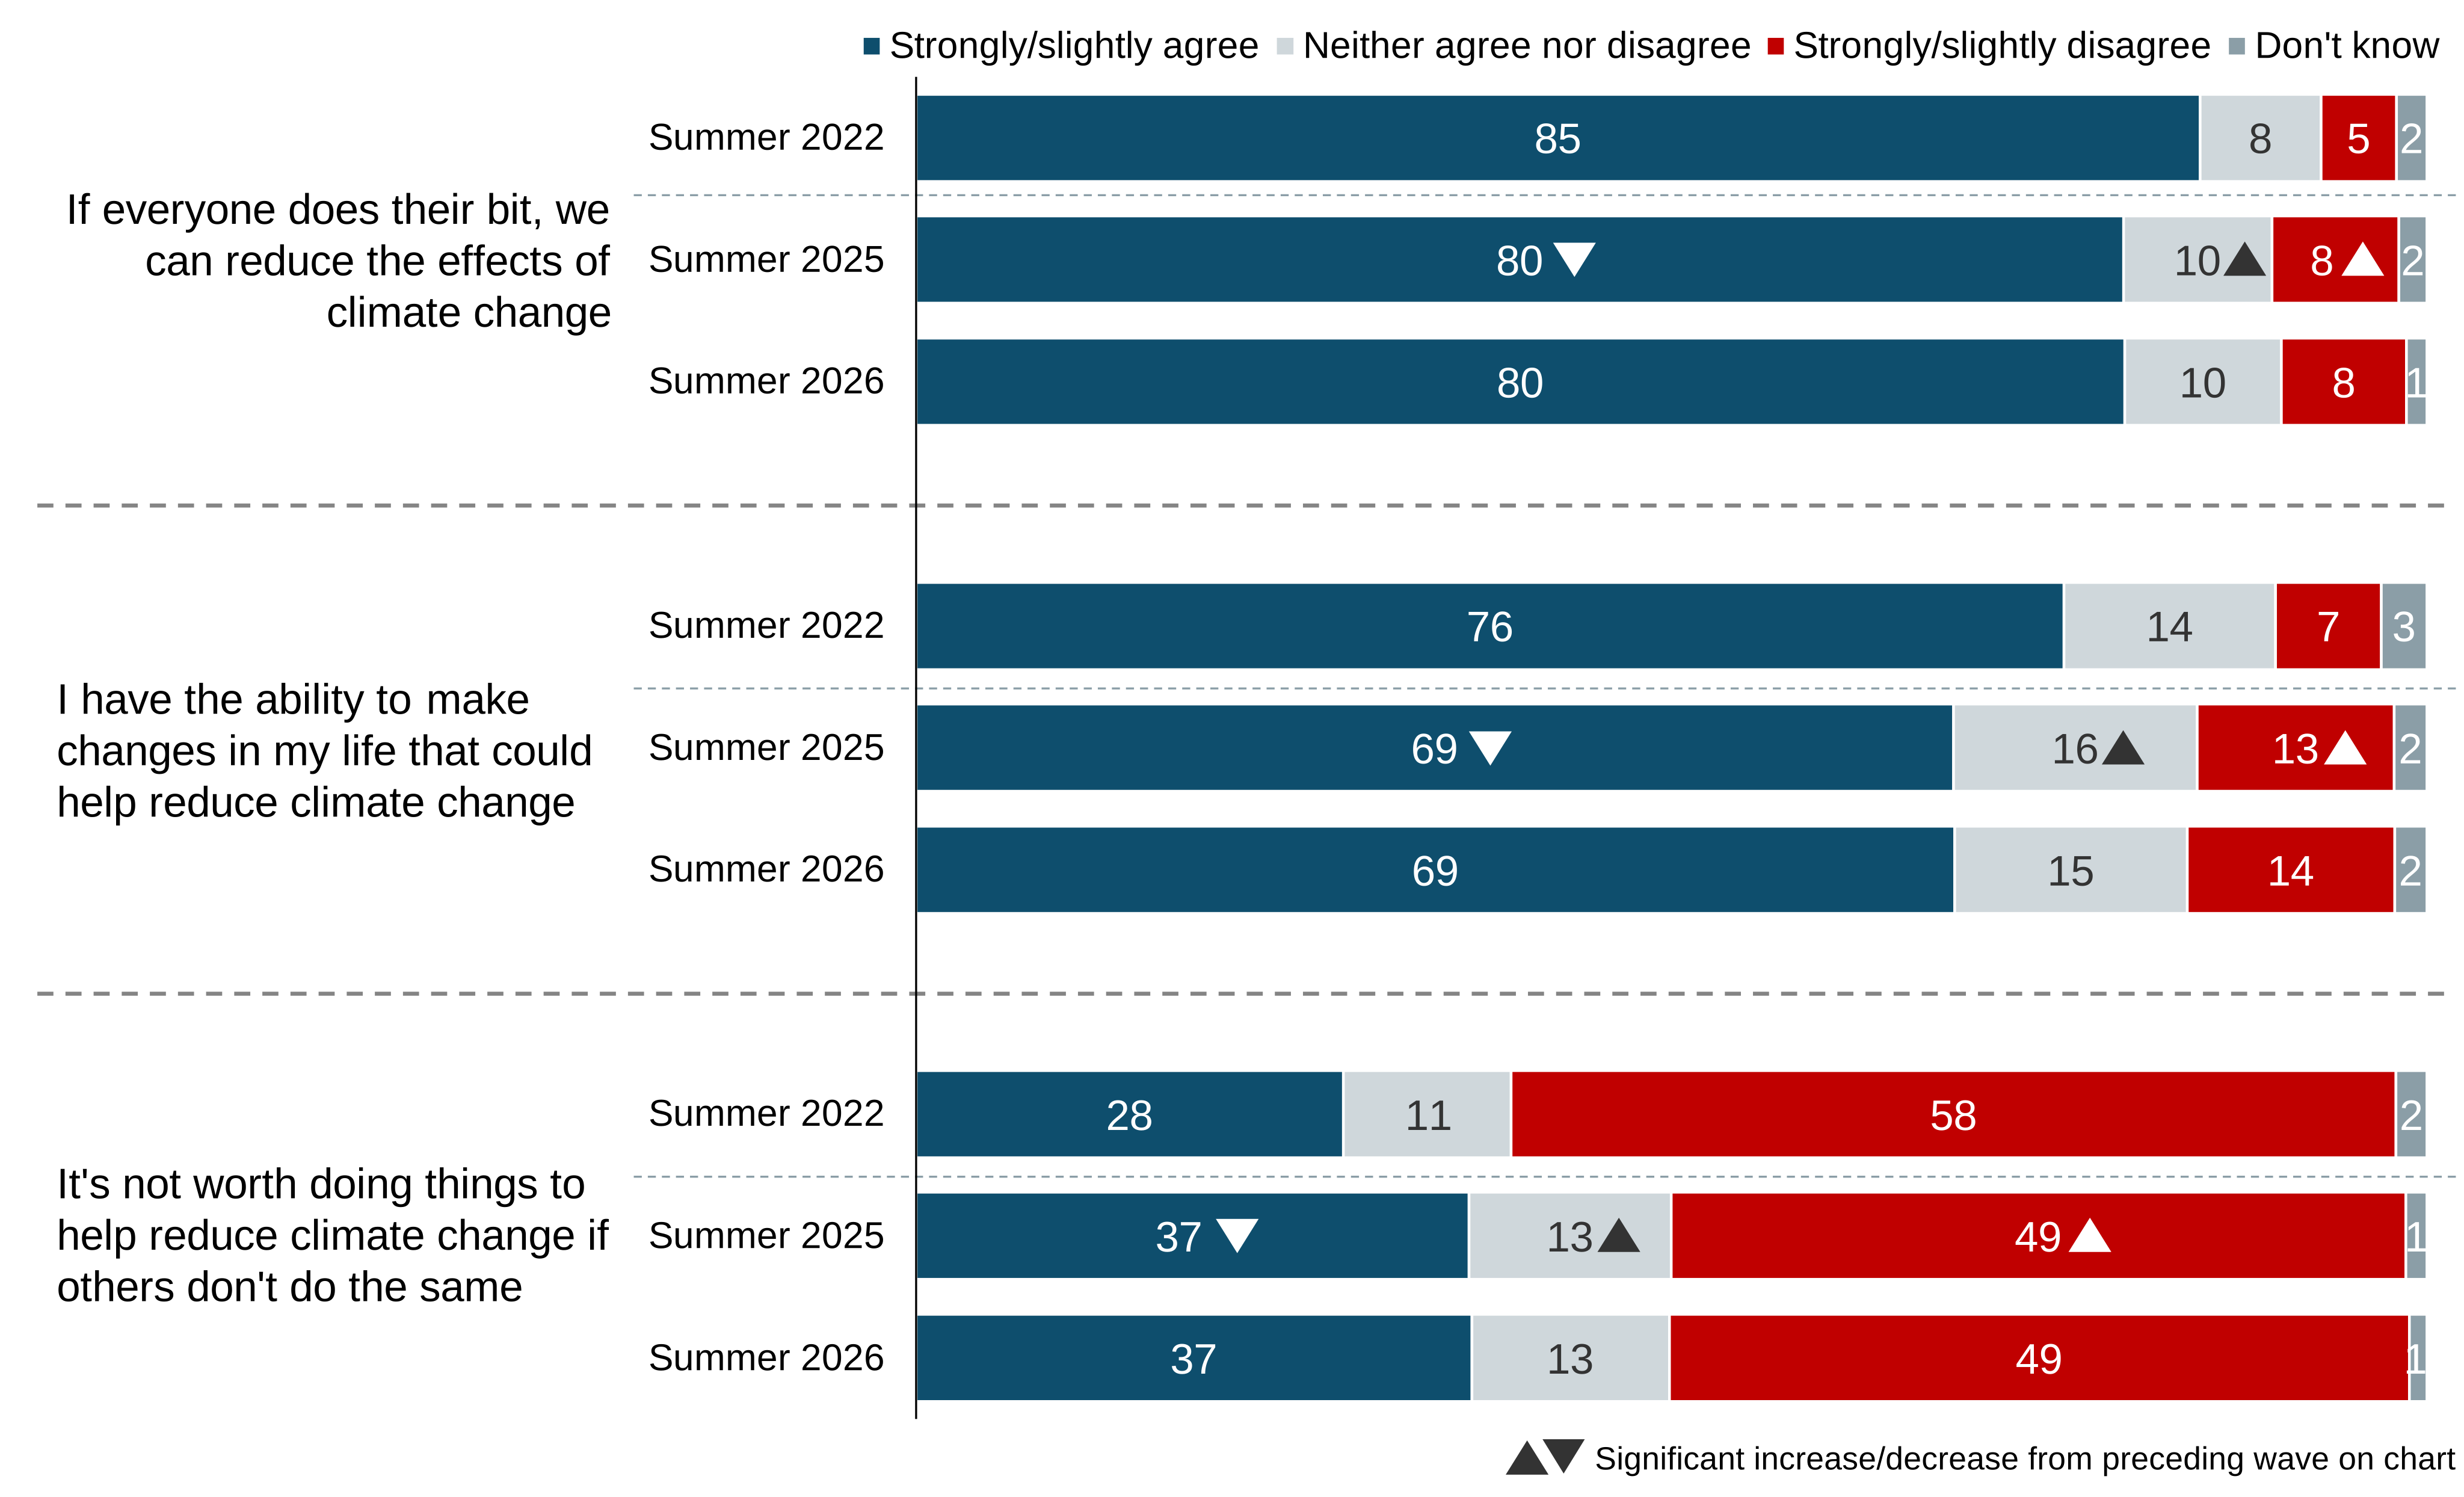
In Summer 2026, 80% of people agreed that ‘if everyone does their bit, we can reduce the effects of climate change’, while 69% agreed that they were personally able to make changes to help reduce climate change. This remains stable since Summer 2025, although looking back over a longer period to Summer 2022, these views are now less widely held.
In terms of attitudes towards behaviour and climate change (Figure 1.6), between Summer 2022 and Summer 2025 there was a decline in agreement that changes in behaviour can make a difference. However, there was no further decline between Summer 2025 and Summer 2026. Agreement with the statement, ‘It is not worth doing things to help climate change if others don’t do the same’ increased from 28% in Summer 2022 to 37% in Summer 2026. However, there has been no change since Summer 2025.
Figure 1.6: Attitudes towards climate change behaviours (% based on all people) baseline wave (Summer 2022) and two most recent waves (Summer 2025 and Summer 2026)
CCATTA-E. How much do you agree or disagree with the following statements?
Base: All wave respondents – Summer 2022 / Summer 2025 / Summer 2026: Everyone does their bit (4,484/3,521/3,235), I have ability (4,474/3,509/3,234), Not worth doing (4,470/3,514/3,229).
Note: The chart for this question has been separated into two sections to enhance readability.
Analysis by subgroups
By age:
Older people, particularly those aged 65 and over, were generally more negative about their attitudes towards climate change behaviours than younger people. However, there was no difference by age in the belief that, if everyone does their bit, we can reduce the effects of climate change.
- People in age groups 45 and over were more likely to agree that there is so much conflicting information it is difficult to know what to believe (between 56% and 60% compared with 40% of those aged under 25).
- People in age groups 55 and over were more likely to agree that the media exaggerates the impact of climate change (between 38% and 40% compared with between 28% and 29% of those in age groups from 25 to 44).
- People aged 65 and over were more likely to agree with the negative statement that it is not worth acting unless others do the same (48% compared with between 27% and 32% of those in age groups under 45)
- People aged 65 and over were less likely to agree with the positive statement that they had the ability to make changes to help reduce climate change: 61% compared with between 69% and 74% of those in age groups under 65.
By education:
People educated to degree level were generally more positive, particularly compared with those with no qualifications. For example:
- 75% of those with a degree agreed that they had the ability to make changes, compared with 57% of those with no qualifications.
- 39% of those without qualifications agreed that the media exaggerates the impacts of climate change compared with 25% of those with a degree.
By geography:
People living in London were typically more positive about behaviours and information compared with other regions. For example:
- Agreement that it is not worth doing things to help if others don’t do the same was lowest in London (29%) and highest in the North East (44%), the East of England (41%), and the East Midlands (40%).
- Agreement that there is so much conflicting information it is difficult to know what to believe was lowest in London (43%) and highest in Scotland and Yorkshire and the Humber (both 62%) and in the North East (59%).
By self-reported knowledge of net zero:
Attitudes towards behaviours tended to be more positive among those who had heard of net zero compared with those who had not, while confidence in information varied by the level of self-perceived knowledge about net zero:
- Those who were aware of net zero were more likely to agree that, if everyone does their bit, we can reduce the effects of climate change (81% vs 70% of those unaware) and that they had the ability to make changes that could help (70% vs 52%).
- Those who said they knew at least a fair amount about net zero were less likely to agree that there is so much conflicting information it is difficult to know what to believe (43% compared with 63% of those who knew at most a little and 64% of those who had not heard of net zero).
Behaviours to tackle climate change
Respondents are asked annually about climate-change related behaviours adopted in their everyday life. Figure 1.7 shows the results for the Summer 2022 baseline and the two most recent waves.
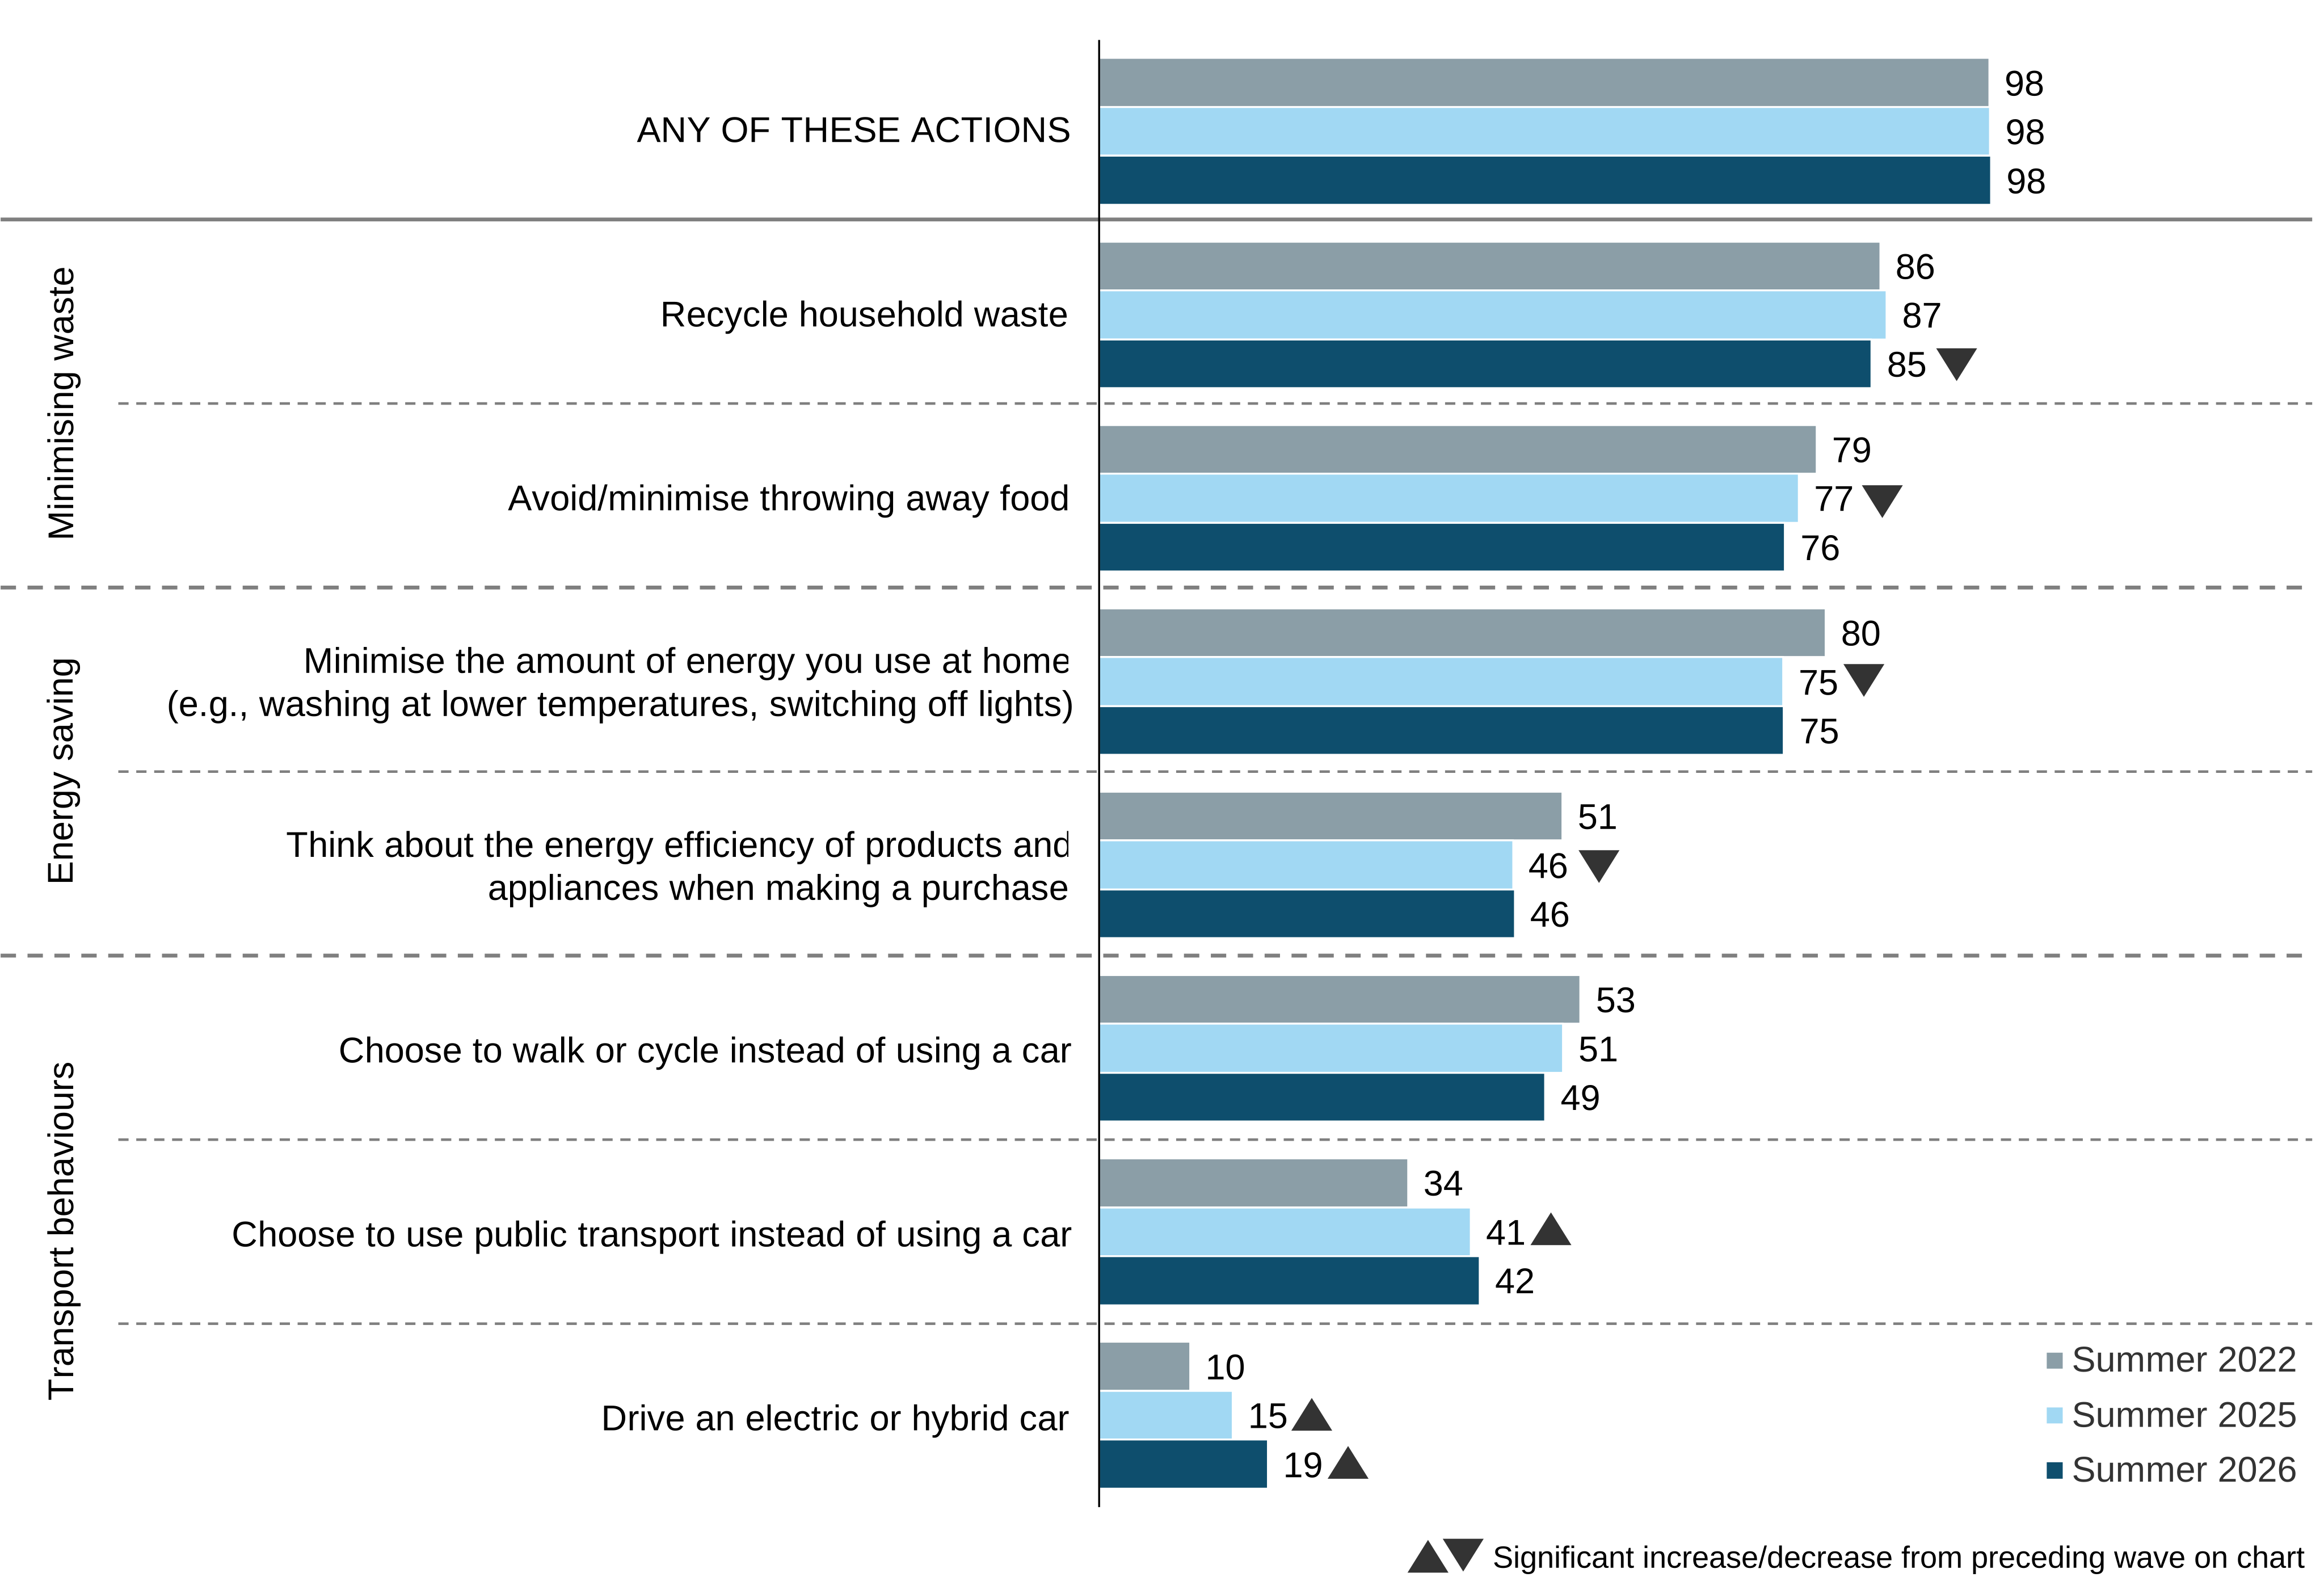
In Summer 2026, as in previous waves, almost everyone reported at least one of the listed actions (98%).
- Actions to minimise waste were most reported: 85% said they recycled household waste while 76% said that they avoided or minimised food waste, down from 79% in Summer 2022.
- Energy saving measures were the next most reported, but both remained less widely reported in Summer 2026 than at the Summer 2022 baseline: 75% said they minimised energy use at home (down from 80%) while 46% took energy efficiency into account when making a product purchase (down from 51%).
- Transport-related behaviour changes were generally reported by a lower proportion of people but had seen some increases over time: 42% said that they chose to use public transport, instead of using a car, remaining above the Summer 2022 baseline level (34%). Around one in five people said they drove an electric or hybrid car; this proportion has increased steadily over time, from 10% in Summer 2022 and 15% in Summer 2025 to 19% in Summer 2026. 49% said they chose to walk or cycle, down from 53% in Summer 2022.
Figure 1.7: Behaviours related to reducing climate change adopted in everyday life (% based on all people), baseline (Summer 2022) and two most recent waves (Summer 2025 and Summer 2026)
CCBEHAVE. Thinking now about your everyday life, do you do any of these things? Please select all that apply.
Base: All wave respondents – Summer 2022 (4,488), Summer 2025 (3,532), Summer 2026 (3,242).
Analysis by subgroups
By age:
Recycling, minimising food waste, and minimising energy use were most likely to be reported by older people:
- For example, people in age bands 55 and over were more likely to report minimising food waste (between 81% and 84% compared with 61% of those aged under 25).
Transport-related behaviours also varied by age:
- Those aged under 25 were more likely to choose public transport instead of using a car (60% compared with between 32% and 44% of those in age groups 25 and over).
- Driving an electric or hybrid car was more widely reported by those in age groups between 35 and 64 (between 22% and 31%, compared with between 10% and 12% of those in age groups under 35 and 15% of those aged 65 and over).
By education:
- People with a degree were more likely than those with no qualifications to report all behaviours, with the exception of driving an electric car. For example, 60% of those with a degree reported choosing to walk or cycle instead of using a car, compared with 38% of those with no qualifications.
By self-reported knowledge of net zero:
- People who said they knew a lot or a fair amount about net zero were typically more likely to report climate-related behaviours compared with those unaware of net zero. The largest difference was observed for thinking about energy efficiency of products when making a purchase (56% of those knowledgeable about net zero compared with 22% of those who had not heard of net zero).
Behaviours thought to have the biggest impact on tackling climate change
Respondents were presented with a list of actions that people can take in their everyday life and asked to identify up to three that they thought would have the biggest impact on tackling climate change in the UK. Figure 1.8 shows the results for the Summer 2022 baseline and the two most recent waves.
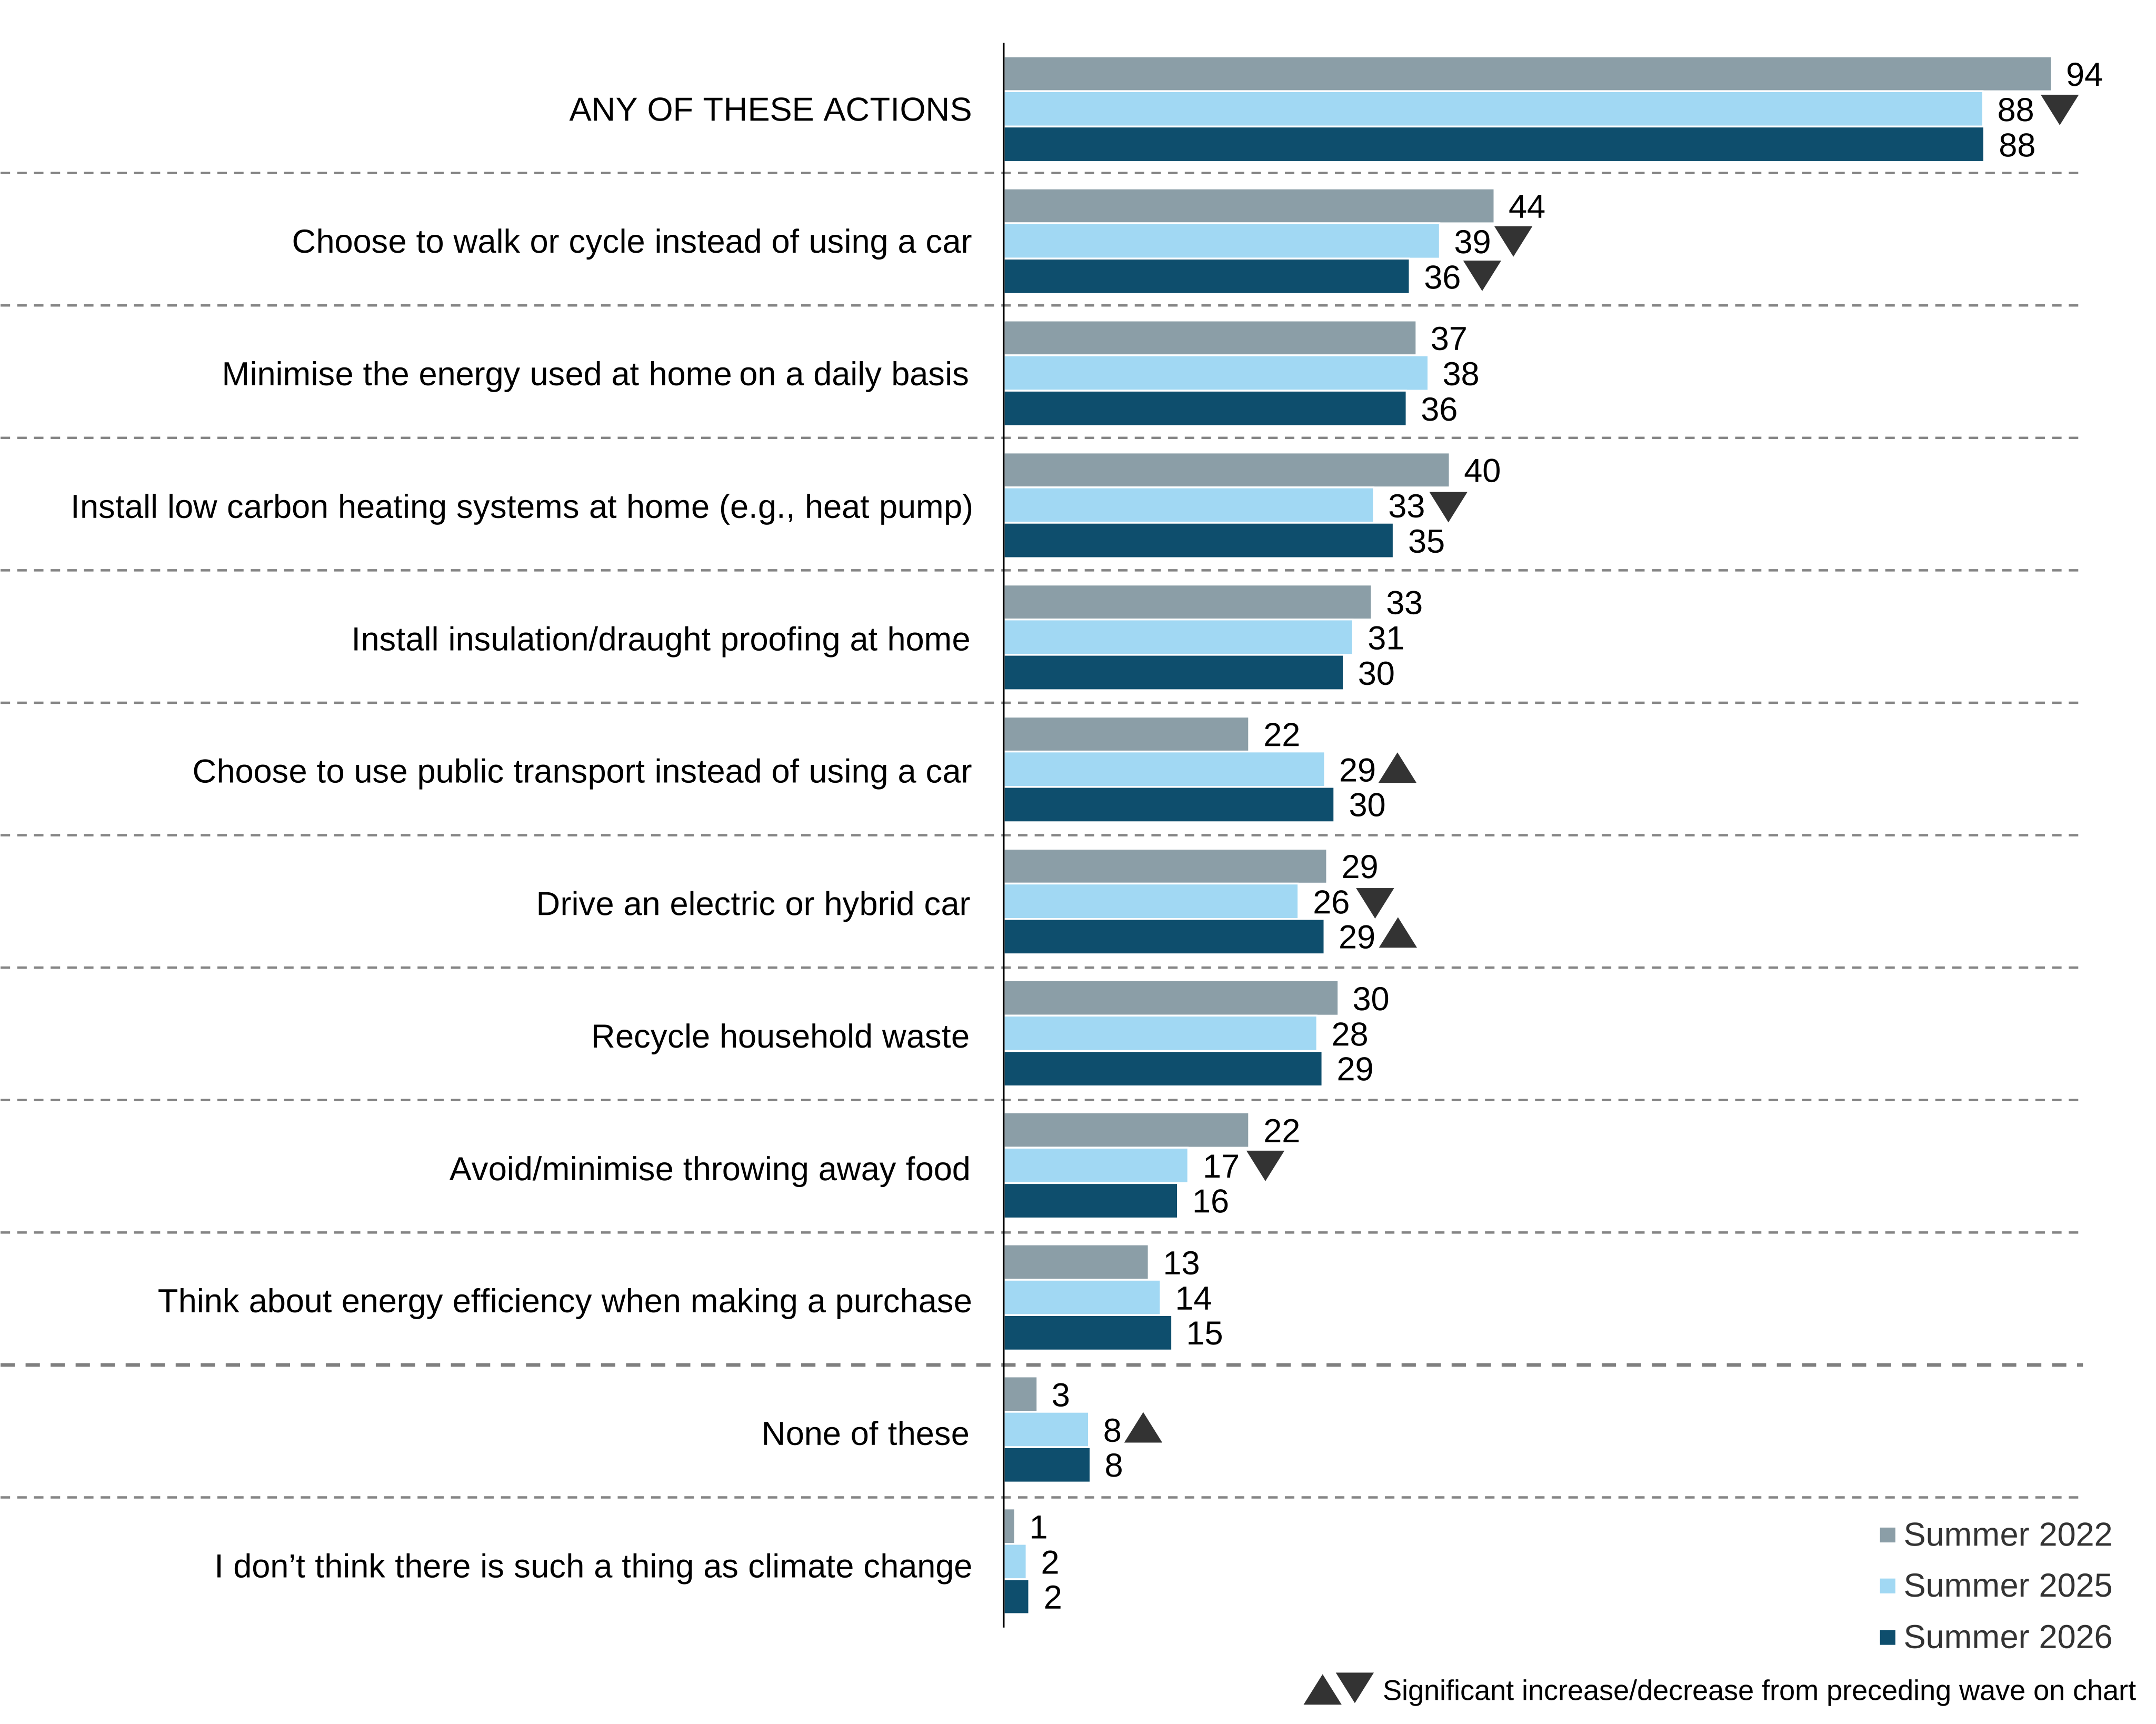
The proportion of people who thought at least one of the behaviours would have an impact on tackling climate change has remained consistent at 88%. The proportion of people who said that none of the actions on the list would have an impact remained low at 8%, up from 3% in Summer 2022 and with no change from Summer 2025.
In Summer 2026, the three climate change mitigation actions thought to be most impactful were, as in previous waves, choosing to walk or cycle rather than using a car (36% down from 39% in Summer 2025 and 44% in Summer 2022), minimising daily energy use at home (36%), and installing a low carbon heating system (35%, down from 40% in Summer 2022).
Around three in ten chose the following behaviours in their top three: installing insulation and draught proofing (30%), using public transport instead of a car (30%, remaining up from 22% in Summer 2022), and recycling household waste (29%).
As in previous summer waves, the lowest ranked options were avoiding food waste (16%, remaining below 22% in Summer 2022) and thinking about energy efficiency when making a purchase (15%).
Figure 1.8: Behaviours thought to have the biggest impact on tackling climate change in the UK - up to three responses were selected (% based on all people), baseline (Summer 2022) and two most recent waves (Summer 2025 and Summer 2026)
CCIMPORT. If most people in the UK did the following, which three of these do you think would have the biggest impact on tackling climate change in the UK? Please select up to three responses.
Base: All wave respondents – Summer 2022 (4,436), Summer 2025 (3,486), Summer 2026 (3,206).
Analysis by subgroups
By age:
- Younger people were more likely to choose walking or cycling instead of using a car in their top three behaviours to tackle climate change: between 43% and 45% of those in age groups under 35, compared with 25% of those aged 65 and over.
- Older people were more likely to select installing insulation at home: 34% of those in age groups 55 and over, compared with 21% of those aged under 25.
- Those aged 65 and over were more likely to select minimising energy use: 42% compared with between 32% and 36% of those in age groups under 65.
- Older people were also more likely to say that none of the actions would have an impact on climate change: 10% of those in age groups 45 and over compared with 2% of those aged under 25.
By education:
- People with a degree were more likely than those with no qualifications to select installing low carbon heating systems (45% vs 24%), installing insulation (36% vs 26%), and driving an electric car (31% vs 23%).
- Conversely, those with no qualifications were more likely than those with a degree to select recycling household waste (33% vs 21%) and minimising food waste (22% vs 15%).
By self-reported knowledge of net zero:
- People who reported knowing a lot or a fair amount about net zero were more likely than those who were not aware of net zero to select installing low carbon heating systems (44% vs 15%) and installing insulation (35% vs 20%). Those who were knowledgeable about net zero were, however, also more likely to say that none of the actions would have an impact on climate change (11%, compared with 1%).
- Those not aware of net zero were, in contrast, more likely than those who said they knew at least a fair amount to select choosing to walk or cycle (45% vs 33%), recycling household waste (40% vs 21%), and avoiding food waste (27% vs 11%).
Information on tackling climate change
In Summer waves, people are presented with a range of potential sources of information and asked about their level of trust in each to provide accurate information about climate change. Overall trust is defined as trusting each source ‘a great deal’ or ‘to some extent’. Figure 1.9 shows the results for the Summer 2022 baseline and the two most recent waves.
Focussing largely on overall trust for each as a source of accurate information on climate change, in Summer 2026:
- Scientists at universities (85%) and scientific organisations (83%) remained the two most trusted sources, with more than four in ten saying they trusted each a great deal. There were increases in trust for both of these sources since Summer 2025: 43% up from 40% for scientists and 42% up from 39% for scientific organisations.
- Further sources that were trusted by at least six in ten people included TV and radio documentaries (71%), charities (62%), and TV news (63%). While fewer than two in ten said they trusted each of these sources a great deal (between 14% and 18%), the levels were higher for all three than in Summer 2022.
- Trust in UK government had dropped from 57% in Summer 2024 to 50% in Summer 2025, but this rose to 56% in Summer 2026, above the Summer 2022 baseline figure (48%).
- Trust in newspapers or their websites also rose to 42% from 39% in Summer 2025, while social media remained by far the least trusted source (17%).
Figure 1.9: Trust in sources of information to provide accurate information on climate change (% based on all people), baseline (Summer 2022) and two most recent waves (Summer 2025 and Summer 2026)
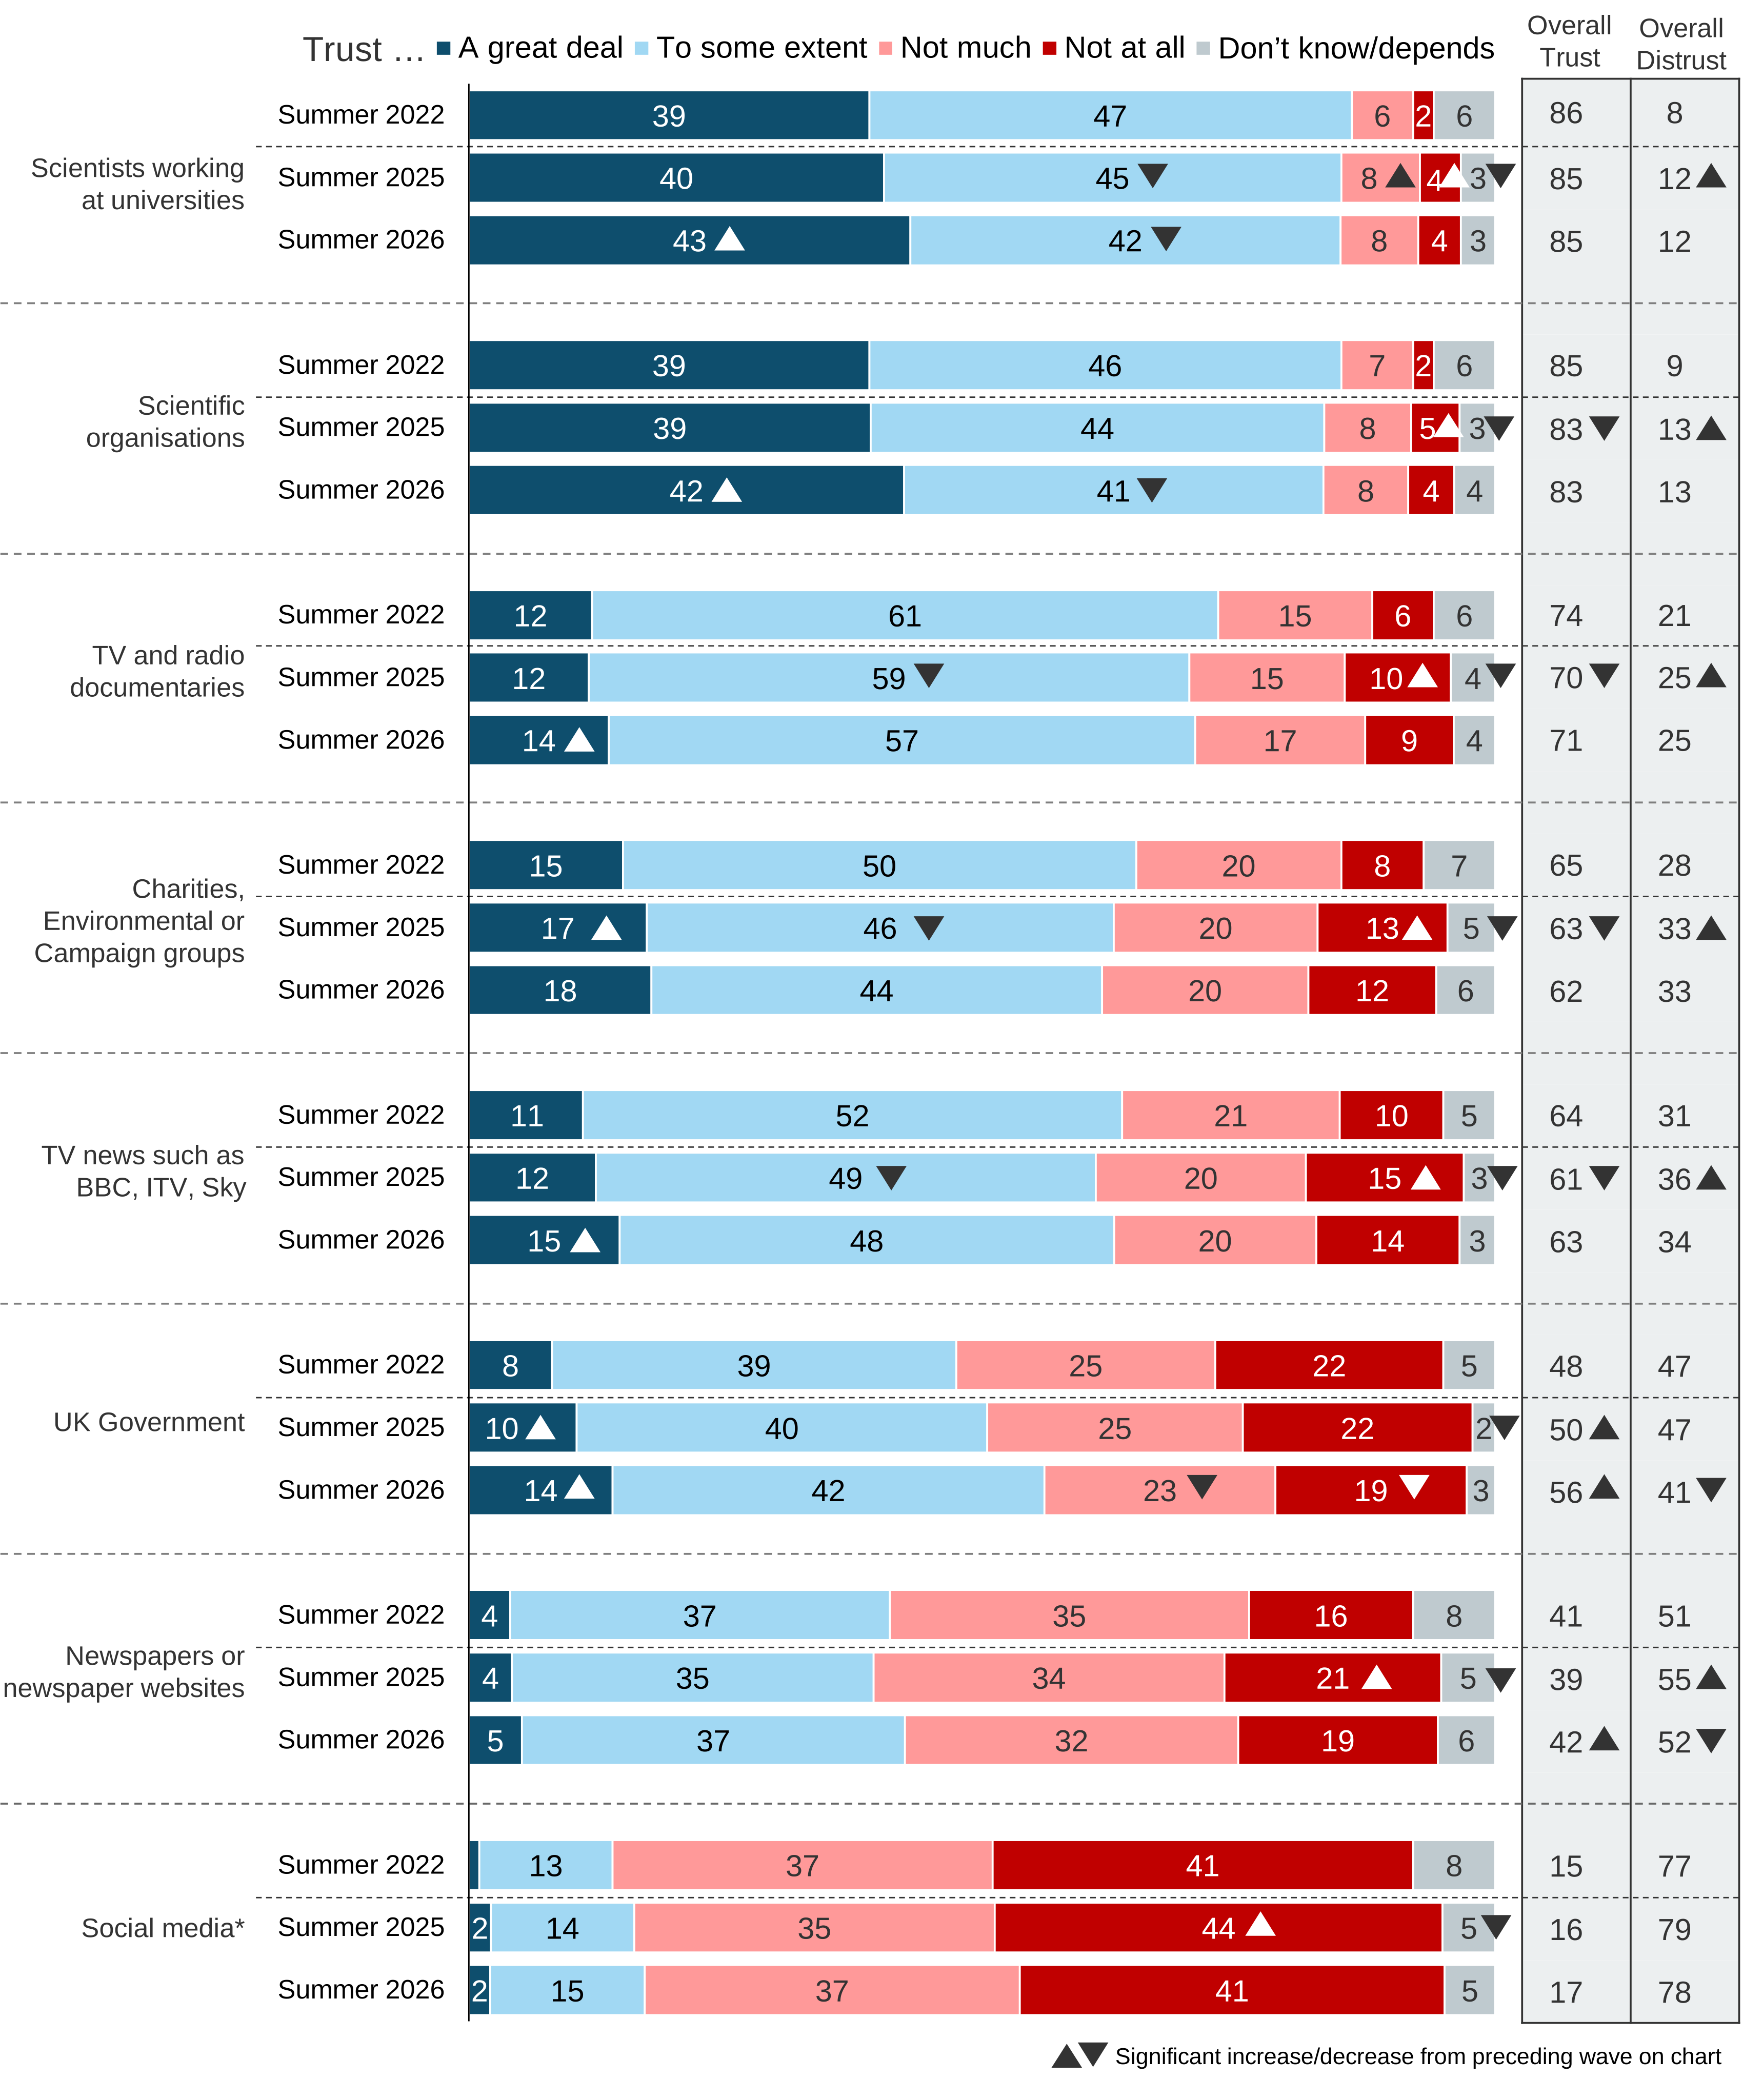
CCTRUSTA-H. How much do you trust each of the following to provide accurate information about climate change? *social media examples were updated to change ‘Twitter’ to ‘X (formerly Twitter)’.
Base: All wave respondents – Summer 2022/Summer 2025/Summer 2026: Scientists at universities (4,464/3,509/3,217), Scientific organisations (4,463/3,514/3,219), TV and radio documentaries (4,464/3,509/3,217), Charities and environmental groups (4,458/3,511/3,216), TV news (4,468/3,504/3,220), UK Government (4,457/3,513/3,219), Newspapers (4,456/3,506/3,221), Social media (4,443/3,484/3,212).
Analysis by subgroups
By age:
- Trust in TV news was higher both for those aged under 25 (70%) and those aged 65 and over (68%) compared with those in age groups from 25 to 44 (between 56% and 60%). There was a similar pattern of difference for trust in newspapers.
- Trust in social media was highest for those aged under 25 (36%) falling to 6% among those aged 65 and over.
- Those aged under 25 were also most likely to trust UK government (64% vs 56% overall).
- People aged 65 and over were least likely to trust charities (53% vs 62% overall).
By education:
- For all sources other than social media, for which there were no differences according to education, trust was highest among those with a degree and lowest for those with no qualifications. For example, trust in the UK government was 66% for those with a degree vs 42% for those with no qualifications.
By geography:
- People in London reported at or near the highest levels of trust for many sources of information. For example:
- Trust in TV news was higher in London (71%) and lower in the East Midlands (51%) with the same pattern of difference for charities (68% vs 51%) and UK government (67% vs 45%).
- Trust in newspapers was higher in London than in all other regions (59% vs 42% overall).
- Trust in TV and radio documentaries was lower in the East Midlands than in most other regions (61% vs 71% overall).
- Trust in scientists was also lowest in the East Midlands (81% vs 90% in Yorkshire and the Humber).
- Trust in scientific organisations was lowest in the South West (75%) and the West Midlands (77%) vs 83% overall.
- Trust in social media was highest in the West Midlands (28%) and the North East (24%) vs 17% overall.
By self-reported knowledge of net zero:
- For all sources other than social media, trust was higher among those who reported more knowledge about net zero. For example, trust in newspapers was 46% among those who said they knew a lot or a fair amount compared with 34% for those not aware of net zero.
Climate change leadership
People have been asked their opinion about the UK’s role as a global leader in tackling climate change each winter since 2024. These questions were asked additionally in Summer 2026. Seasonal differences may, therefore, have contributed to any differences from data at previous waves.
Overall, in Summer 2026, 37% of people agreed (strongly or slightly) that the UK is a global leader in tackling climate change, down from 39% in Winter 2025 (Figure 1.10), while 22% disagreed. A substantial proportion did not provide an opinion either way (32%).
Two-thirds (66%) felt it was important (very or fairly) that the UK is a global leader in tackling climate change, remaining below the figure of 69% recorded in Winter 2024, while 26% said it was not very or not at all important. There was a further decrease in the proportion saying this was very important (28% in Summer 2026, down from 34% in Winter 2024 and 31% in Winter 2025).
Figure 1.10: Attitudes towards the UK as a global leader on tackling climate change (% based on all people), Winter 2024 and 2025, Summer 2026
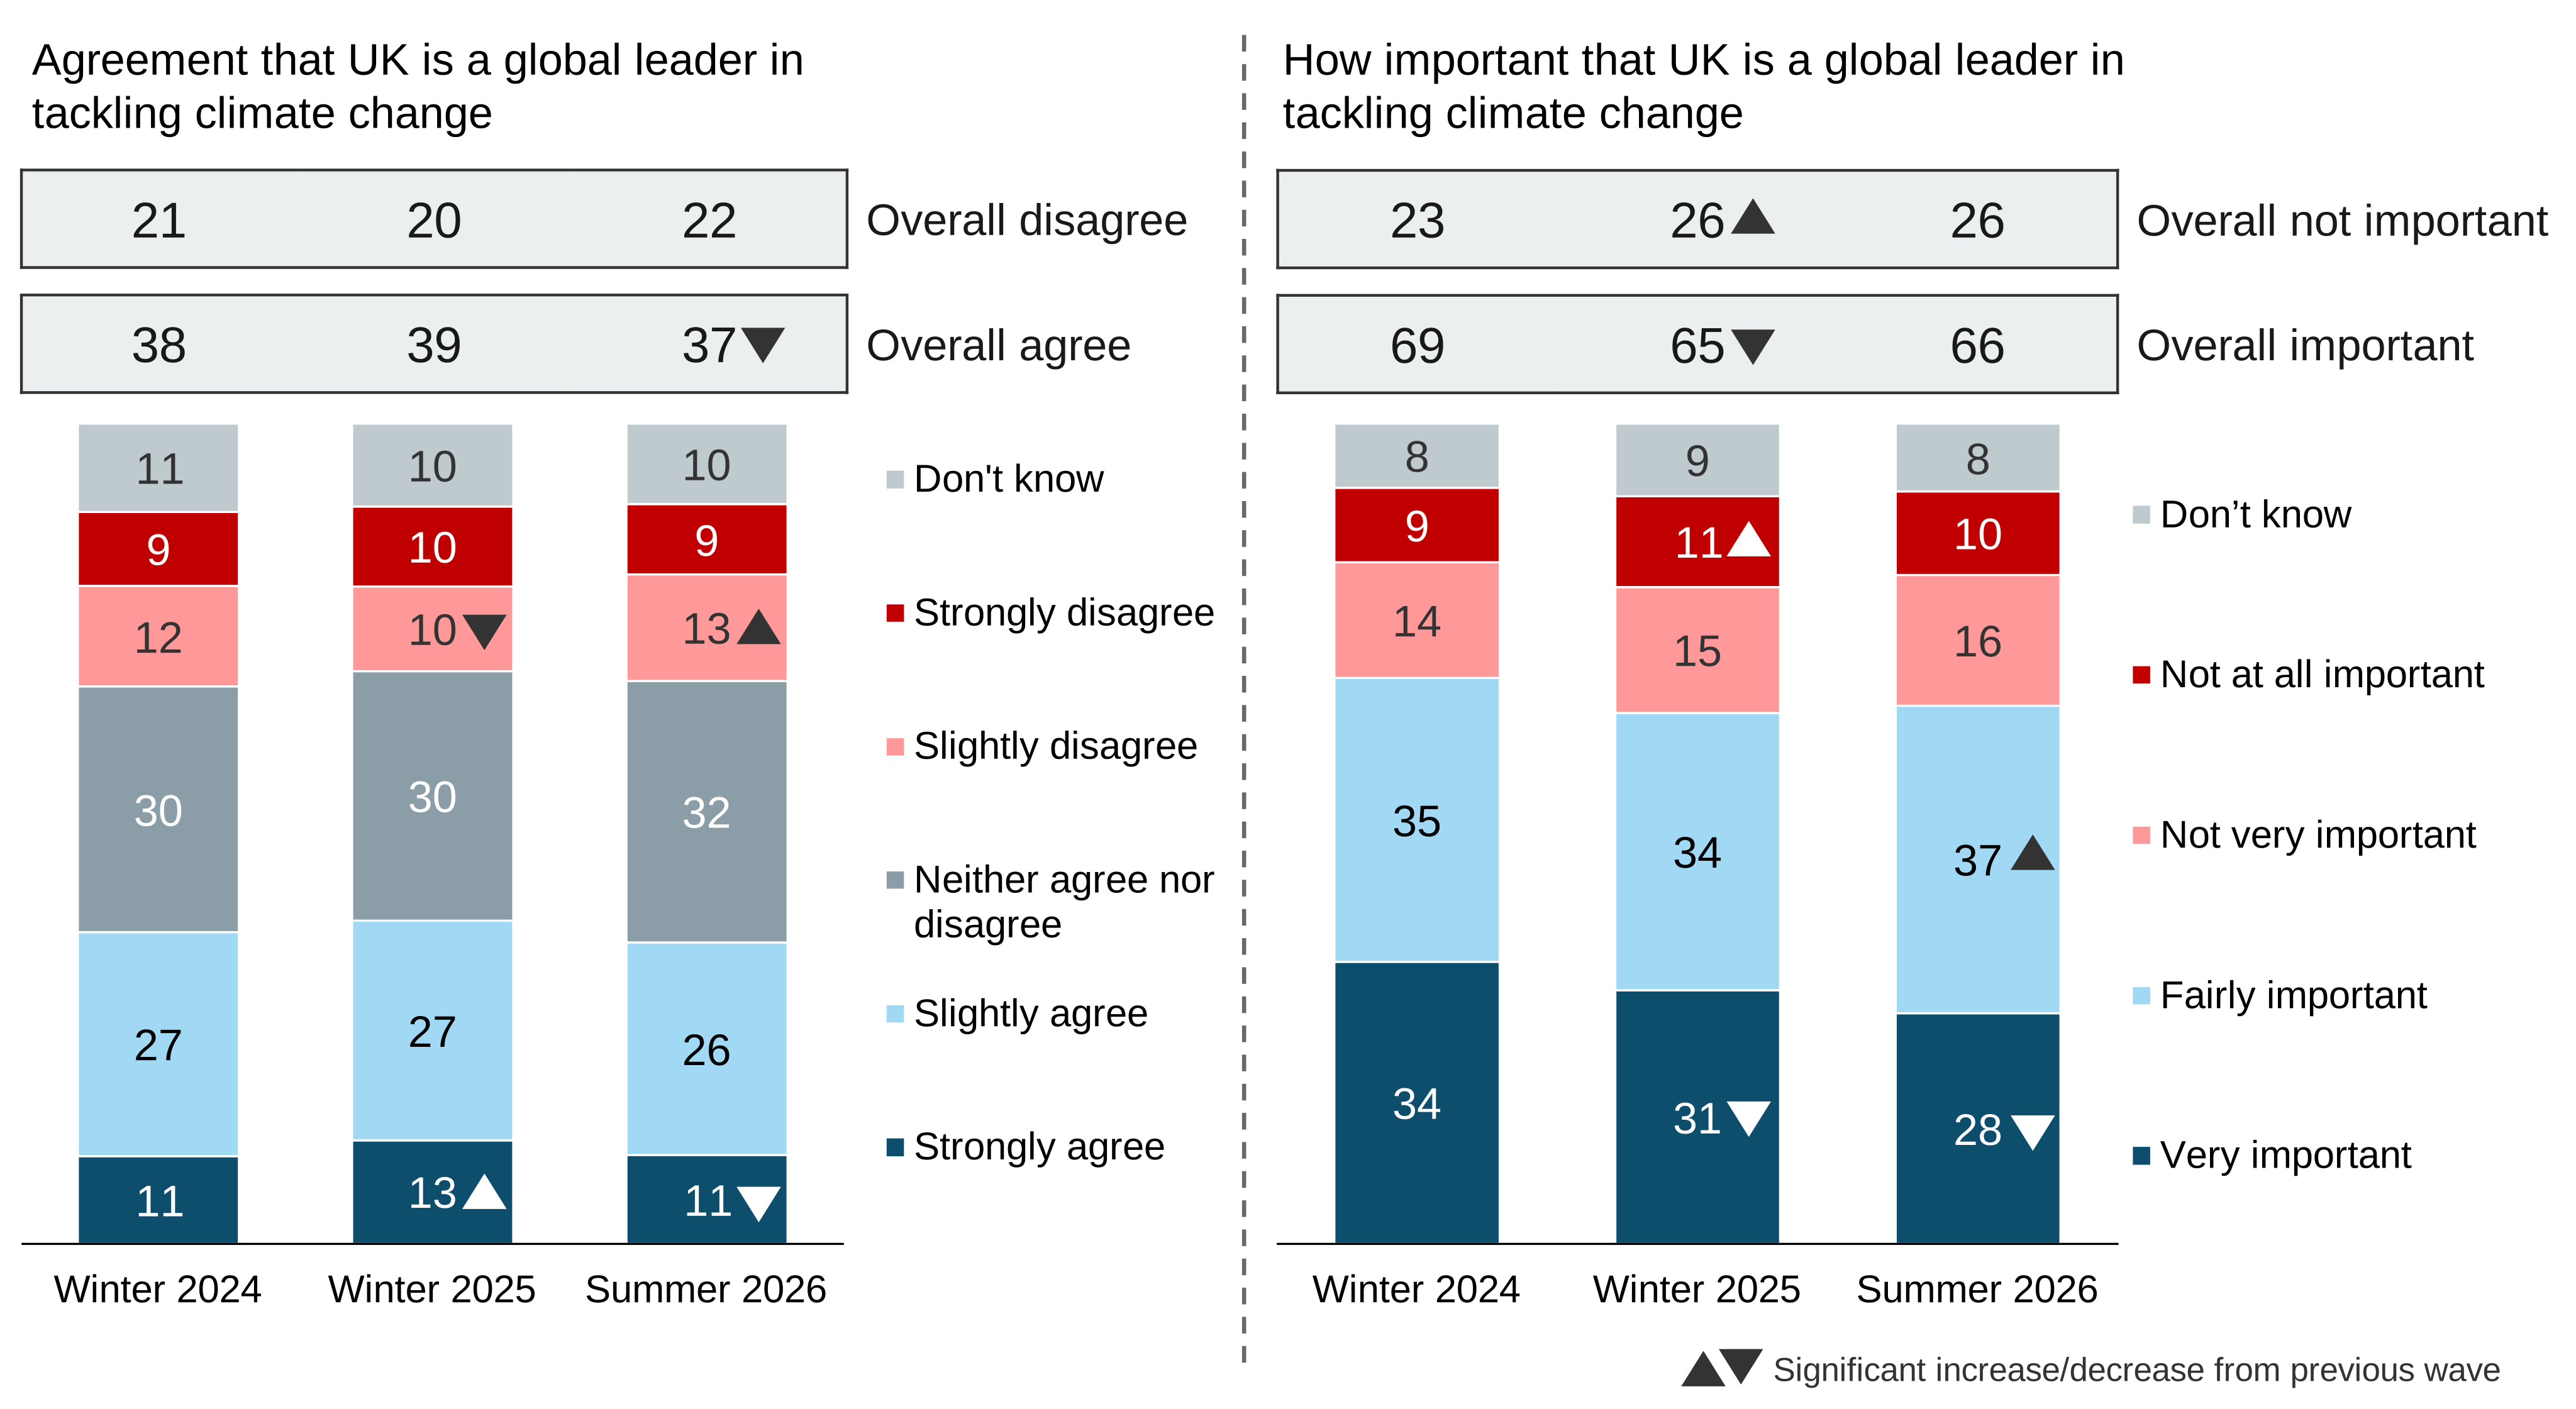
ICFKNOW. How much do you agree or disagree that the UK is a global leader in tackling climate change?
ICFIMPORT. How important or unimportant do you feel it is that the UK is a global leader on tackling climate change?
Base: All wave respondents: Winter 2024/Winter 2025/Summer 2026: Agreement (3,212/3,278/3,233), Importance (3,212/3,276/3,239)
Analysis by subgroups
While there was no significant difference by age in agreement (strongly or slightly) or perceived importance (very or fairly) that the UK is a global leader, people aged under 25 were more likely to give a don’t know response at each question (18% vs 10% overall for agreement, 17% vs 8% overall for importance).
People educated to degree level were more likely to disagree that the UK is a global leader (26% vs 14% of those with no qualifications).
People who said they were very concerned about climate change were more likely than those who said they were not concerned to agree that the UK is a global leader (47% vs 19%) and much more likely to feel that this is important (88% vs 26%).
Further findings on net zero and climate change
In previous waves, questions were included on other topics relating to net zero and climate change. The latest findings relating to these topics can be found as follows:
- Confidence that the UK is on track to meet its net zero target by 2050, see Summer 2025 report on net zero and climate change - section on ‘Attitudes towards Net Zero’.
- Sources of information on climate change and information needs, see Winter 2025 report on net zero and climate change - section on ‘Information on tackling climate change’.
- Attitudes to action on climate change, see Winter 2025 report on net zero and climate change - section on ‘Attitudes to action on climate change’.
-
Age is not included in the subgroup analysis as no clear differences were reported. ↩