DCMS Economic Estimates: Monthly GVA – Technical and quality assurance report
Published 19 August 2021

© Crown copyright 2021
This publication is licensed under the terms of the Open Government Licence v3.0 except where otherwise stated. To view this licence, visit nationalarchives.gov.uk/doc/open-government-licence/version/3 or write to the Information Policy Team, The National Archives, Kew, London TW9 4DU, or email: psi@nationalarchives.gov.uk.
Where we have identified any third party copyright information you will need to obtain permission from the copyright holders concerned.
This publication is available at https://www.gov.uk/government/statistics/dcms-sectors-economic-estimates-monthly-gva-to-june-2021/dcms-economic-estimates-monthly-gva-technical-and-quality-assurance-report
This document covers the following topics:
- an overview of the content covered in the regular statistical release ‘DCMS Sectors Economic Estimates: Monthly GVA’
- an overview of DCMS Sectors, how they are defined, and limitations of these definitions
- the methodology underlying the statistical release, including data sources
- the processes used to check that the estimates have been produced correctly
- other sources of information for the DCMS sectors
- further information, including contact details for DCMS statisticians.
1. Overview of release
1.1 What this release covers
The statistics release ‘DCMS Economic Estimates: Monthly GVA’ provides a monthly estimate of the contribution of DCMS Sectors in the UK, measured by GVA (gross value added). GVA measures the contribution to the economy of each individual producer, industry or sector in the UK. It is used in the estimation of gross domestic product:
GVA + Taxes on Products − Subsidies on Products = GDP
Estimates of taxes and subsidies are not available at an industry level and therefore GVA is used as the headline economic measure at an industry level.
These estimates of monthly GVA give us more timely estimates than our annual figures, though are less accurate. These monthly GVA estimates are based on incomplete information and should only be used to illustrate general trends, rather than be taken as definitive measures.
The method set out in this chapter can be used to produce monthly GVA estimates expressed in chained volume measures (i.e. taking into account inflation) for the following DCMS sectors:
- Creative Industries
- Cultural Sector
- Digital Sector
- Gambling
- Sport
- Telecoms
- Tourism
This note does not include a procedure for generating monthly GVA estimates for Civil Society.
Other organisations, including some of DCMS’ arm’s length bodies, produce alternative GVA measures of DCMS sectors. These alternative measures can be found in Section 6.
The estimates in the publication are consistent with national estimates published by the Office for National Statistics (ONS).
We publish these figures every quarter. As always, we welcome feedback from users on the current statistics portfolio and any changes they’d like to see in the future. Please email evidence@dcms.gov.uk.
1.2 Users
The users of these statistics fall into five broad categories:
- Ministers and other political figures
- Policy and other professionals in DCMS and other Government departments
- Industries and their representative bodies
- Charitable organisations
- Academics
The primary use of these statistics is to monitor the performance of the industries in the DCMS sectors, helping to understand how current and future policy interventions can be most effective.
2. Sector definitions
2.1 Overview of DCMS Sectors
The sectors for which DCMS has responsibility are:
- Civil Society
- Creative Industries
- Cultural Sector
- Digital Sector
- Gambling
- Sport
- Telecoms
- Tourism
However, DCMS Sector Economic Estimates: Monthly GVA does not include Civil Society, as monthly GVA estimates are not available for this sector at present.
In order to measure the size of the economy it is important to be able to define it. DCMS uses a range of definitions based on internal or UK agreed definitions. All definitions are based on the Standard Industrial Classification 2007 (SIC) codes. This means nationally consistent sources of data can be used and enables international comparisons.
The development of individual sector definitions in isolation as new sectors have fallen within the department’s remit has meant that there is overlap between DCMS sectors. For example, the Cultural Sector is defined using SIC codes that are nearly all within the Creative Industries, whilst the Telecoms Sector is completely within the Digital Sector.
Figure 1 below visually shows the overlap between DCMS Sectors in terms of SIC codes. Users should note that this does not give an indication of the magnitude of the value of overlap. A list of SIC codes appearing in each sector and subsector can be found in the tables accompanying the release.
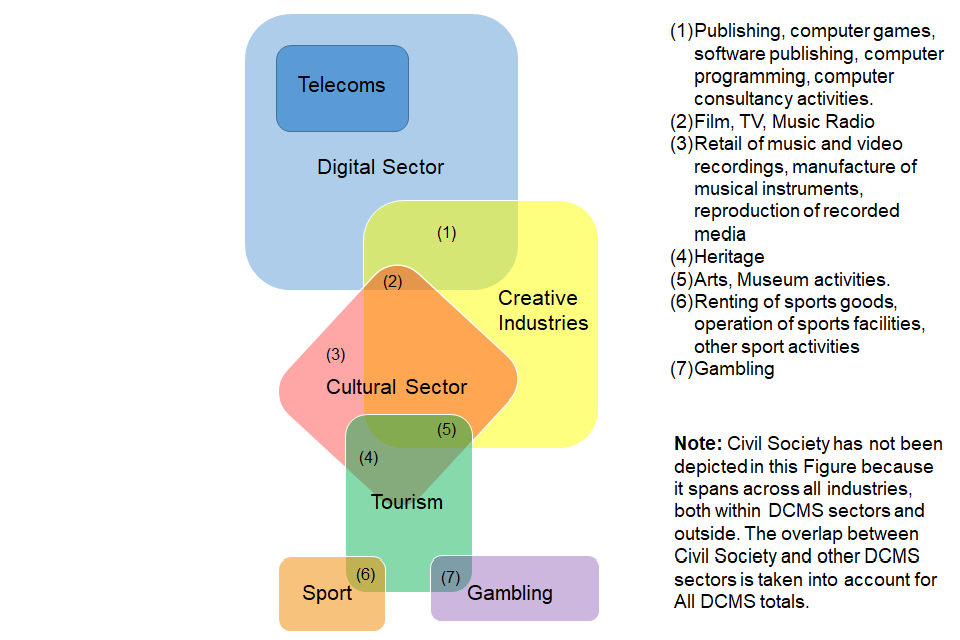
Chart showing how the SIC codes overlap within the DCMS sectors, where a SIC code can be both Creative and Digital (e.g.). The chart is on the left-hand-side, accompanied by a written list and note.
2.2 Details and limitations of sector definitions
This section looks at sector definitions in more detail, and provides an overview of limitations. There are substantial limitations to the underlying classifications. As the balance and make-up of the economy changes, the SIC, finalised in 2007, is less able to provide the detail for important elements of the UK economy related to DCMS Sectors, and therefore best fit SIC codes have been used to produce these estimates. The following section describes limitations for specific DCMS sector definitions.
Creative Industries
The Creative Industries were defined in the Government’s 2001 Creative Industries Mapping Document as “those industries which have their origin in individual creativity, skill and talent and which have a potential for wealth and job creation through the generation and exploitation of intellectual property”.
To allow the Creative Industries to be measured, DCMS worked with others to develop a statistical definition of the Creative Industries which reflects this definition. DCMS uses a “Creative Intensity” to determine which industries (at 4 digit SIC) are Creative. The Creative Intensity is the proportion of occupations in an industry that are creative and, if the intensity is above a set threshold, that industry is typically defined as Creative. More information can be found in the 2016 methodology document.
The definition used for the Creative Industries in this release does not allow consideration of the value added of “creative” to the wider economy, such as Creative Occupations outside the Creative Industries. DCMS policy responsibility is for creative industries across the economy and therefore this is a significant weakness in the current approach.
Cultural Sector
There are significant limitations to the DCMS measurement of the cultural sector arising from the lack of detailed disaggregation possible using the standard industrial classifications. There are many cases where culture forms a small part of an industry classification and therefore cannot be separately identified and assigned as culture using standard data sources. DCMS consulted on the definition of Culture and published a response in April 2017.
It is recognised that, due to the limitations associated with SIC codes, the SIC code used in past publications as a proxy for the Heritage sector (91.03 - Operation of historical sites and building and similar visitor attractions) is likely to be an underestimate of this sector’s value. We have changed the name of the Heritage sector to ‘Operation for historical sites and similar visitor attractions’ to reflect this.
Digital Sector
The definition of the Digital sector used by DCMS is based on the OECD definition of the ‘information society’. This is a combination of the OECD definition for the “ICT sector” as well as including the definition of the “content and media sector”. An overview of the SIC codes included in each of these sectors is available in the OECD Guide to Measuring the Information Society 2011 (see Box 7.A1.2 on page 159 and Box 7.A1.3 on page 164).
The definition used for the Digital Sector does not allow consideration of the value added of “digital” to the wider economy e.g. in health care or construction. DCMS policy responsibility is for digital across the economy and therefore this is a significant weakness in the current approach.
Sport
The definition of sport used in the release is based on the EU agreed core/statistical Vilnius definition, which includes only SIC codes which are predominately sport. In our release of national estimates of GVA, we also include estimates of Sport GVA based on the Sport Satellite Account. These estimates are based on the broad Vilnius definition, which is a more wide-ranging measure of sport that considers the contribution of sport across a range of industries, for example sport advertising, and sport-related construction. Caution should be made when using the Sport Satellite Account, as proportions have not been updated since 2016 and results are not comparable to those of other sectors. Sport GVA in the Sport Satellite Account is calculated by estimating the proportion of the SIC code that applies to sport, and then applying this proportion to the total GVA for each industry, finally summing to produce total sport GVA for each year.
Tourism
For Tourism, a satellite account approach is used, where the element of each industry that is directly supported by tourism is identified by calculating the proportion of consumers that are tourists for each industry.
3. Methodology
3.1 Data sources
The following publicly available data sources were used in the production of monthly GVA estimates for DCMS sectors:
- Annual low-level aggregates of UK output gross value added (GVA) (published 12 November 2020) - used to obtain 2018 current price GVA for 2 digit SIC (Standard Industrial Classification) codes
- Annual Business Survey 2018 (ABS) aGVA estimates (published 15 May 2020) - used to allocate GVA for more detailed industrial classes (4 digit SIC codes) which are not available in the table above
- Monthly Index of Production (IoP) (published monthly) - monthly indexes of GVA for broad industrial divisions related to production, used to estimate monthly GVA for DCMS sectors
- Monthly Index of Services (IoS) (published monthly) - monthly indexes of GVA for broad industrial divisions related to services, used to estimate monthly GVA for DCMS sectors
- Monthly gross domestic product (published monthly) - monthly indexes of GVA for industrial sections and for the whole UK economy, which is not available in the IoP or IoS. This data source can be used to estimate monthly GVA for the UK economy as a whole, and products in the Tourism sector.
- UK Tourism Satellite Account 2018 (published 4 November 2020) - used to estimate tourism direct GVA for the Tourism sector
3.2 Method
ONS publishes the monthly indexes identified above for broad industrial divisions, otherwise referred to here as 2 digit SIC (Standard Industrial Classification) codes. SIC codes are used to classify business establishments by their main economic activity, and classifications are nested, with more detailed 4 digit ‘classes’ sitting within 3 digit ‘groups’, which sit inside 2 digit ‘divisions’. DCMS sectors are defined at the detailed industrial ‘class’ level.
The general principle of the monthly GVA method is to assign monthly indexes of GVA to more detailed industrial groups and aggregate these into DCMS sector estimates. The following is one possible method to illustrate general trends in monthly GVA. This method can also be used to produce bespoke sector estimates based on user needs.
Calculate current price GVA for 2018
The first step in this method is to obtain current price GVA for 2018 for each industry in DCMS sectors. This is because the monthly indexes are referenced to 2018 = 100, so we need to use 2018 current price data as a starting point.
Current price GVA for 2018 can be obtained from the ONS tables of low-level aggregates of UK output gross value added (GVA). These tables contain current price data for broad industry divisions (coded to 2 SIC code digits).
As DCMS sectors are defined at the more detailed ‘class’ level (4 digit SIC codes), which are not available in these GVA tables, we use data from the Annual Business Survey (ABS) to estimate GVA at the more detailed level. We use approximate GVA (aGVA) to apportion output GVA from broad industrial divisions to detailed industrial classes, by:
- extracting aGVA from the ABS at class level (e.g. SIC 32.12)
- extracting aGVA from the ABS at division level (e.g. SIC 32)
- calculating the proportion of the division aGVA that each class accounts for (e.g. aGVA for SIC 32.12 as a proportion of SIC 32)
- applying the proportion for each class to the division GVA in the ONS current price tables
We can use this approach for all cases where DCMS sectors are defined by a 3 or 4 digit SIC. The list of SIC codes in each sector and subsector are available from the Economic Estimates Methodology page.
We then divide the current price GVA for each SIC code by 12 to get the average monthly GVA, not annual GVA, for 2018.
Use monthly indexes to extrapolate monthly output from 2018
The next step is to obtain the monthly index for each SIC code, published in the Index of Services and Index of Production. These datasets contain the monthly growth/fall in output for the services and production industries, using 2018 as the reference year. These can also be obtained using the ONS time series explorer to download only the relevant indices. There are a range of variables in these datasets, for example ‘Weights’ and ‘3m on 3m growth’ for each SIC code. We extract seasonally adjusted[footnote 1] indexes in chained volume measures (adjusted for inflation) for each 2 digit SIC code.
These indexes are only available for broad industrial divisions (2 digit SIC codes), but DCMS sectors are defined using detailed classes (4 digit SIC codes). We have assumed that trends in GVA for 4 digit SIC codes will follow trends for 2 digit SIC codes, and have therefore applied the division index for each 3 or 4 digit SIC code. Further information is available in Section 4 of this document.
For each relevant SIC code, we multiply the index for each month of interest by the average monthly GVA for 2018 (calculated in the step above). This gives the GVA (adjusted for inflation) for all months of interest for DCMS industries. These industries (SIC codes) can then be aggregated for each month to give estimates for DCMS sectors and subsectors.
Method for SIC 91: Libraries, archives, museums and other cultural activities
A different approach is used to apportion GVA to 4 digit level for SIC 91. In the ABS data, the aGVA for aspects of SIC 91 can be negative (this is due to under coverage in the ABS and high levels of funding from local authorities). For this reason, turnover data from the ABS is used instead of aGVA to allocate SIC 91 at the 4-digit level. This is the only SIC where this approach has been used.
Method for Tourism
For Tourism, we use a slightly different approach that reflects that the tourism sector can be defined by the characteristics of the consumer, rather than the producer. It is known as the satellite account approach. Rather than assigning the whole output of an industry to a sector, it identifies the elements of each industry that are directly supported by tourism.
For each SIC code in the Tourism sector, a tourism ratio is calculated that identifies the proportion of spend of tourists for each industry. These tourism ratios are produced by the ONS Tourism Intelligence Unit, based on the methodology and definition set out in the UN International Recommendations for Tourism Statistics 2008 (IRTS 2008).
The following table lists the SIC codes and tourism ratios which can be used to calculate the tourism direct GVA estimate for 2018.
Table 1: Standard Industrial Classifications and 2018 tourism ratios used in monthly GVA estimates for Tourism
| SIC | Tourism Sector | Ratio |
| 49.1 | Railway passenger transport services | 0.50209 |
| 49.32 | Road passenger transport services | 0.10396 |
| 49.39 | Road passenger transport services | 0.10396 |
| 50.1 | Water passenger transport services | 0.13588 |
| 50.3 | Water passenger transport services | 0.13588 |
| 51.1 | Air passenger transport services | 0.44617 |
| 55.1 | Accommodation services for visitors | 0.75476 |
| 55.2 | Accommodation services for visitors | 0.75476 |
| 55.3 | Accommodation services for visitors | 0.75476 |
| 55.9 | Accommodation services for visitors | 0.75476 |
| 56.1 | Food and beverage serving activities | 0.21249 |
| 56.21 | Food and beverage serving activities | 0.21249 |
| 56.29 | Food and beverage serving activities | 0.21249 |
| 56.3 | Food and beverage serving activities | 0.21249 |
| 68.2 | Exhibitions & Conferences etc | 0.00873 |
| 77.11 | Transport equipment rental services | 0.13164 |
| 77.21 | Sport and recreation activities | 0.23631 |
| 77.34 | Transport equipment rental services | 0.13164 |
| 77.35 | Transport equipment rental services | 0.13164 |
| 79.11 | Travel agencies & other reservation services | 0.51856 |
| 79.12 | Travel agencies & other reservation services | 0.51856 |
| 79.9 | Travel agencies & other reservation services | 0.51856 |
| 82.3 | Exhibitions & Conferences etc | 0.00873 |
| 90.01 | Cultural activities | 0.36486 |
| 90.02 | Cultural activities | 0.36486 |
| 90.03 | Cultural activities | 0.36486 |
| 90.04 | Cultural activities | 0.36486 |
| 91.02 | Cultural activities | 0.36486 |
| 91.03 | Cultural activities | 0.36486 |
| 91.04 | Cultural activities | 0.36486 |
| 92 | Sport and recreation activities | 0.23631 |
| 93.11 | Sport and recreation activities | 0.23631 |
| 93.19 | Sport and recreation activities | 0.23631 |
| 93.21 | Sport and recreation activities | 0.23631 |
| 93.29 | Sport and recreation activities | 0.23631 |
| All other SIC codes | Other Consumption Products | 0.01656 |
For each SIC code in the Tourism sector, the current price GVA is calculated for 2018 as outlined in section 3.2. We then multiply the GVA by the corresponding tourism ratio, in order to calculate the direct GVA that is generated by tourism for each SIC code. The rest of the method for calculating monthly Tourism GVA follows the steps outlined in section 3.2.
Tourism also includes an additional component called ‘Other Consumption Products’ (found at the bottom of Table 1). This component accounts for the rest of the UK economy, of which a very small proportion (1.7%) is estimated to be directly supported by tourists. The monthly GVA for this component is estimated as follows:
- UK total current price GVA for 2018 is obtained from the low-level aggregates of UK output gross value added (GVA)
- Current price GVA for 2018 for each Tourism SIC code is aggregated and subtracted from the UK total. The entire GVA for the Tourism SIC codes should be subtracted (i.e. before the tourism ratio is applied), not the tourism direct GVA (i.e. after the tourism ratio is applied), in order to prevent double counting of these SIC codes. This gives the total GVA for the rest of the UK economy that isn’t already accounted for by the Tourism SIC codes.
- The ratio for ‘Other Consumption Products’ at the bottom of Table 1 is applied to the GVA figure in the step above; this gives the annual GVA figure for other consumption products in 2018.
- The annual GVA figure for 2018 is divided by 12 to give the average monthly GVA for 2018.
- The index for ‘Gross Value Added - Monthly (Index 1dp): CVM SA’ in the Monthly Gross Domestic Product: time series dataset is multiplied by the average monthly GVA for 2018. This index is the monthly change in output for the UK economy as a whole. We have assumed that the change in output for ‘Other Consumption Products’ will follow the trend for the whole UK economy. Further information on this assumption can be found in section 4.3. This gives the monthly GVA for ‘Other Consumption Products’.
- Monthly GVA for ‘Other Consumption Products’ is aggregated with the monthly direct GVA calculated for each Tourism SIC code in the table above, to give a total monthly GVA value for Tourism.
Tourism GVA estimates produced using the SIC definition in Table 1 will not align with the Tourism Satellite Account. Further information is available in section 4.3 of this document.
Accounting for sector overlap in the DCMS total
There is an overlap between DCMS sector definitions, which means we cannot simply add the different sectors together to form a DCMS total figure. This overlap must be estimated in order to avoid double counting when calculating a DCMS monthly total.
The DCMS monthly total (excluding Tourism and Civil Society) is estimated by looking at which SIC codes appear in multiple sectors. All unique SICs can then be aggregated to give a total monthly figure with no overlap. Including Tourism within the DCMS total requires a slightly different approach. The first stage is to identify SIC codes which are part of tourism and appear in other DCMS sectors. These are SIC 77.21, 90.01, 90.02, 90.03, 90.04, 91.02, 91.03, 92.00, 93.11 and 93.19. The tourism ratio is used to estimate the GVA for each SIC which is directly related to tourism.
The tourism direct GVA for these SIC codes is deducted from the Tourism sector total, which can then be aggregated with the DCMS total for the other sectors without double counting.
However, there will also be a small overlap for all other SIC codes in DCMS sectors, even if these are not listed explicitly in Table 1. This is due to the ‘Other Consumption Products’ component of Tourism. For example, 1.7% of SIC 26.11 (‘Manufacture of electronic components’ in the Digital Sector) will overlap between the DCMS total and Tourism. We therefore need to apply the ‘Other Consumption Products’ ratio for all other SIC codes in DCMS sectors, and deduct this from the DCMS monthly total.
3.3 Summary of data sources
In summary, the data presented in this report:
- are based on official statistics data sources
- are based on internationally-harmonised codes
- are based on survey data (Annual Business Survey) and, as with all data from surveys, there will be an associated error margin surrounding these estimates[footnote 2].
This means the estimates are:
- comparable at both a national and international level.
- comparable over time, allowing trends to be measured and monitored
However, this also means the estimates are subject to limitations of the underlying classifications of the make-up of the UK economy. For example, the standard industrial classification (SIC) codes were developed in 2007 and have not been revised since. Emerging sectors, such as Artificial Intelligence, are therefore hard to capture and may be excluded or mis-coded.
4. Validation and accuracy
The timeliness of monthly GVA data is crucial to understand changes in GVA over 2020 as a result of Covid-19. However, there is a trade off with accuracy as these estimates are based on incomplete data.
4.1 Comparability with annual estimates
These timely estimates should only be used to illustrate general trends, rather than be taken as definitive figures. These figures will not be as accurate as our annual National Statistics release of gross value added for DCMS sectors (which will be published in Winter 2021).
This is partly because this method uses indexes available for 2 digit SIC codes (the lowest level of detail available) to estimate monthly GVA for more detailed 4 digit SIC codes (how DCMS sectors are defined). The trend in GVA for the overall 2 digit SICs may not be an accurate reflection of the change in GVA at the more granular level. For example, this method estimates GVA from retail of sports goods based on the trend for all retail activities (not just sports goods), and estimates sports education based on the trend for all education. It’s likely that sectors such as sports education have been affected differently over lockdown compared to education in general. The use of 2 digit SIC indexes also means that 4 digit SICs within the division will follow exactly the same trend. For example, SICs 93.11, 93.12, 93.13 and 93.19 all use the same division index for SIC 93 to estimate monthly GVA.
There is no simple way of measuring the accuracy of the monthly GVA estimates (the extent to which the estimate measures the underlying “true” value of monthly GVA in DCMS sectors). One possible check can be to aggregate monthly GVA estimates over each year and compare this with the annual published GVA figure. For each sector or subsector, there is approximately a 0 to 4% difference between the aggregated monthly GVA estimate for 2019 and the GVA figure for 2019 in the latest DCMS Economic Estimates: Gross Value Added release. However, users should note that 2019 published estimates are provisional and subject to planned revisions. Annual GVA estimates for 2020 will be available once the National Accounts are published in September 2021. The accuracy of monthly GVA figures is likely to be lower for 2020 and 2021, due to changes in the economy during COVID-19 leading to greater divergence of class GVA within the division.
4.2 Accuracy of data sources
Monthly indexes
The monthly GVA for 2019, 2020 and 2021has been estimated using 2018 data as a baseline. Monthly GVA for 2020 and 2021, in particular the latest months, will be extremely uncertain.
Index figures for the most recent months are provisional and subject to revision. ONS publishes revision triangles for the Index of Services, Index of Production and monthly GDP time series, which can be used to assess uncertainty. We have estimated that monthly GVA estimates for the Digital Sector in 2019 using the first monthly indexes published were approximately 1-4% higher than the “true” figure. This drops to 1-3% above the “true” figure once the monthly indexes were revised[footnote 3].
The published monthly indexes should be viewed as a proxy for GVA. Whilst GVA is defined as “total outputs minus total inputs”, in practice, more information is available on outputs than on inputs so changes in output are frequently used as an approximate indicator of changes in GVA.
Monthly time series are volatile and should be interpreted alongside quarterly or yearly estimates to give a better indication of actual growth trends.
Further information on quality and methodology is available for the Index of Services, Index of Production, and Monthly Gross Domestic Product time series. Users should note these documents were last updated in January 2017 and so some information is out of date, such as the reference year used (currently 2018).
Other ONS data sources
Information on the validation and accuracy for the current price GVA tables, the Annual Business Survey, and the Tourism Satellite Account are available in the technical report published alongside the latest annual DCMS Economic Estimates: Gross Value Added release.
4.3 Estimation of Tourism GVA
Monthly GVA estimates for Tourism will not align with the Tourism Satellite Account, as some of the SIC codes in the Tourism Satellite Account definition are at 5 digit level, for which GVA estimates are not available (the lowest level the ABS publishes aGVA is for 4 digit SIC codes). Table 1 lists the 4 digit variation of the SIC code where it is at 5 digit level. The table also does not include SIC 49.31, which is included in the Tourism Satellite Account definition but spans across multiple Tourism sectors, making it difficult to apply different tourism ratios robustly. The method above produces annual current price Tourism estimates which are approximately 3% lower in 2018 than direct GVA in the Tourism Satellite Account. The impact of this difference is expected to be minor relative to the uncertainty inherent in these more rapid estimates.
5. Quality assurance processes
5.1 Quality assurance processes at ONS
Information on the quality assurance processes for the current price GVA tables, the Annual Business Survey, and the Tourism Satellite Account are available in the technical report published alongside the latest annual DCMS Economic Estimates: Gross Value Added release.
Information on the quality assurance processes for the Index of Services can be found in the Index of Services QMI. Information on the quality assurance processes for the Index of Production can be found in the Index of Production QMI.
5.2 Quality assurance processes at DCMS
The majority of quality assurance of the data underpinning the release takes place at ONS. However, further quality assurance checks are carried out within DCMS.
Production of the report is typically carried out by one member of staff, whilst quality assurance is completed by at least one other, to ensure an independent evaluation of the work.
Data requirements and data delivery
For the ABS data, DCMS discussed our data requirements with ONS and these are formalised as a Data Access Agreement (DAA). The DAA covers which data are required, the purpose of the data, and the conditions under which ONS provide the data. Discussions of requirements and purpose with ONS improved the understanding of the data at DCMS, helping us to ensure we receive the correct data and use it appropriately.
DCMS checks that the data delivered by ONS match what is listed in the Data Access Agreement (DAA). For this particular release we check that:
- We have received all data at the 4 digit SIC code level, which is required for us to aggregate up to produce estimates for our sectors and sub-sectors
- Data at the 4 digit SIC code has not been rounded unexpectedly. This would cause rounding errors when aggregating up to produce estimates for our sectors and subsectors.
Data analysis quality assurance checks
At the analysis stage, data are aggregated to produce information about DCMS sectors and sub-sectors. The GVA statistics lead checks whether:
- the GVA proportions are similar to last year, and if not, whether this is because of changes to the methodology or changes in sample size
- there is any missing data
- the percentage changes each year look similar
- the updated data has been used, including the revised back series data.
- the correct SIC codes have been aggregated together to form DCMS sector and sub-sector estimates
Publication quality assurance checks
Finalised figures are disseminated within OpenDocument Format tables and a written headline report, published on GOV.UK. These are produced by the GVA statistics lead. Before publishing, a quality assurer checks the data tables as well as the report to ensure minimal errors. This is checked against a QA log where comments can be fed back and actioned accordingly. The quality assurer also makes sure any statements made about the figures (e.g. regarding trends) are correct according to the analysis and checks for spelling or grammatical errors.
Proofreading and publication checks are done at the final stage, including:
- checking the figures in the publication match the published tables
- checking the footnote numbering is correct
- making sure hyperlinks work
- checking chart/table numbers are in the correct order
- ensuring the publication is signed off by DCMS Head of Profession for Statistics and DCMS Chief Economist
- contacting press office to ensure they are aware of the release date
- checking the published GOV.UK page again after publishing
Post publication
Once the publication is released, DCMS reviews the processes and procedures followed via a wash up meeting. This occurs usually a week after the publication release date and discusses:
- what went well and what issues were encountered
- what improvements can be made for next time
- engaging with users of the publication to get feedback
6. External data sources
It is recognised that there are always different ways to define sectors, but their relevance depends on what they are needed for. Government generally favours classification systems which are:
- rigorously measured
- internationally comparable
- nationally consistent
- ideally applicable to specific policy interventions.
These are the main reasons for DCMS constructing sector classifications from Standard Industrial Classification (SIC) codes. However, DCMS accepts that there are limitations with this approach and alternative definitions can be useful where a policy-relevant grouping of businesses crosses existing Standard Industrial Classification (SIC) codes. DCMS is aware of other estimates of DCMS Sectors. These estimates use various methods and data sources, and can be useful for serving several purposes, e.g. monitoring progress under specific policy themes such as community health or the environment, or measuring activities subsumed across a range of SICs.
Table 2 shows different sources of analysis measuring the economic contribution of different DCMS policy areas from our arm’s-length bodies. It is recognised that there will be many other sources of evidence from industry bodies, for example, which have not been included in this table. This will be developed over time to capture a wider spectrum of stakeholder’s releases. We encourage statistics producers within DCMS sectors who are not represented in the table to contact the economic estimates team at evidence@dcms.gov.uk.
Table 2. Alternative data sources measuring economic contribution of DCMS sectors
| Sector | Sub-sector | Organisation | Summary of use |
|---|---|---|---|
| Civil Society | Civil Society | ONS | ONS publishes a household satellite account which includes an estimate for volunteering for 2015 and 2016. This is based on the DCMS Community Life Survey and multiplying participation by the median earnings. However these figures should not be included in the GVA figure for the economy due to volunteering being part of the informal economy, and therefore not captured in the ONS’s methodology for calculating GVA. The latest year for which data is available is currently 2016. |
| Creative Industries and Cultural Sector | Arts | Arts Council England (ACE) | ACE provides a value of GVA and employment accountable by the Arts and Culture industry. They use similar SIC codes to DCMS’ Economic Estimates, but rather than using the supply and use tables and then the Annual Business Survey to inform the proportions to use, ACE use only the Annual Business Survey and therefore an approximate measure of GVA. |
| Creative Industries and Cultural Sector | Film, TV, video, radio and photography; IT, software and computer services | British Film Institute (BFI) | BFI provides a value of GVA and FTE employment accountable by the Screen sector. The analysis uses a bespoke economic impact model developed for this study, reflecting current best practice in economic impact modelling, aligning the study with current government evaluation methodology (HM Treasury Green Book 2018). |
| Creative Industries and Cultural Sector | Museums, Galleries and Libraries; Museums and Galleries | Arts Council England (ACE) | ACE commissioned a report on the economic impact of museums in England in 2013. This methodology is very different to that of the DCMS Sector Economic Estimates, in particular the definition of museums was much wider. ACE have identified the limitations with using SIC codes for museums, namely that to be included in the official statistical surveys, the museum needs to be registered for PAYE or VAT, which means some of the small museums would not be included in these official sources. The same applies to local authority delivered museum services which would be coded under the Public Administration SIC code. As a result ACE have used a bottom-up approach of developing a database of museums in England then using various sources to identify the economic measures for each museum. This is for England and was produced in 2013. |
| Cultural Sector | Heritage | Historic England | Historic England provides a value of GVA and employment accountable by the Heritage sector. Historic England use a satellite account approach to measure the heritage sector. Satellite accounts measure a sector by aggregating shares of other SICs, estimated using Standard Occupational Classification (SOC) codes primarily and additional information. They can serve several purposes, e.g. monitoring progress under specific policy theme. While potentially useful, the quality of the data depends on that of the evidence used to estimate the appropriate share of existing SICs. These figures are useful in building the sectoral narrative, and in advocacy work (e.g. in speeches, alongside our sector estimates). However the scope of the industries included is much wider than for DCMS’ estimates. |
| Gambling | Gambling | Gambling Commission | The Gambling Commission produces industry statistics twice a year on gross gambling yield, employment and number of businesses. The methods are different to DCMS’ Economic Estimates to reflect the different data sources available to the Gambling Commission and their policy needs. The Gambling Commission derive their estimates from the operators. As it is a license requirement for operators to submit returns the data collection is essentially a census. This has benefits compared to using a sample survey. DCMS define the gambling sector as SIC 92; however it is likely that there will be companies outside of SIC 92 included in the Gambling Commission statistics. For example, some working men’s clubs may hold a license but would not be classified under SIC 92 by virtue of their other primary activities. Finally, Gambling Commission do not produce an estimate of GVA; instead they provide Gross Gambling Yield (GGY), which is the amount retained by gambling operators after the payment of winnings but before the deduction of operation costs, excluding the national lottery. This is because this measure is understood by the sector as a whole and is internationally comparable. This means the Gambling Commission can compare historically and internationally, but it does mean it is not comparable against other sectors. |
| Sport | Sport | Sport England | Sport England produces an estimate of the GVA and number of FTE jobs generated by sport and sport-related activity. This was updated in 2017/18 and covers England only. GVA is split by participation and consumption. The definition is wider than the statistical definition used by DCMS, but is similar to the sport satellite account approach based on the Vilnius definition. This means elements such as sport broadcasting are included. While potentially useful, the quality of the data depends on that of the evidence used to estimate the appropriate share of existing SICs. |
| Sport | Sport | UK Sport | UK Sport has produced estimates of the contribution of the Olympic and Paralympic sports. Whilst this is not fully comparable with DCMS’ estimates due to its much narrower scope, it uses a similar methodology to the DCMS Sport satellite account. Please note that this Sport satellite account is not currently part of the DCMS Sector Economic Estimates so there will be further differences in methodology and scope of industries. UK Sport use a satellite account approach for a portfolio of sports. They produce a GVA and employment estimates, using a range of sources: ABS/ASHE, 2014 Input-Output tables, Participation data and company accounts. Whilst these are not the exact same data sources as DCMS uses, or the most up to date, they do enable a comparison to DCMS statistics. They are therefore a robust estimate if the user is looking for specific Olympic and Paralympic sports. However, as with all satellite accounts, the quality of the data depends on that of the evidence used to estimate the appropriate share of existing SICs. |
| Tourism | Tourism | VisitBritain | VisitBritain have commissioned a report to value the number of jobs and economic contribution in the Tourism industry. This is based on a bespoke model, but the direct tourism industry figures have consistency with the Tourism Satellite Account methodology, which DCMS uses for its Tourism estimates. It is based on 2008 to 2011, so is more outdated than DCMS estimates. |
| Computer Games | Computer Games | UKIE and NESTA | UKIE has a website dedicated to statistics and other useful information about the UK games industry. This includes statistics on GVA (national and regional), employment, exports and imports, number of businesses, and investment, which are based on their latest official publications. In partnership with UKIE, NESTA has produced national and regional estimates of the economic contribution of the computer games industry, including number of businesses and GVA. This is based on a ‘big data’ modelling approach where researchers identified games companies through their digital footprint, rather than using official industrial (SIC) codes or surveys. The latest estimate is for 2014, so is more outdated than DCMS estimates. |
7. Further information
For enquiries on this release, please email evidence@dcms.gov.uk.
For general enquiries contact: Department for Digital, Culture, Media and Sport 100 Parliament Street London SW1A 2BQ Telephone: 020 7211 6000
DCMS statisticians can be followed on Twitter via @DCMSInsight.
The Economic Estimates of DCMS Sectors release is an Official Statistics publication and has been produced to the standards set out in the Code of Practice for Statistics. For more information, see https://www.statisticsauthority.gov.uk/code-of-practice/.
-
Seasonal adjustment removes regular variation from a time series. Regular variation includes effects caused by differing month lengths, different activity near particular events such as shopping activity before Christmas and regular holidays such as the May bank holiday. ↩
-
Sampling error is the error caused by observing a sample (as in a survey) instead of the whole population (as in a census). While each sample is designed to produce the “best” estimate of the true population value, a number of equal-sized samples covering the population would generally produce varying population estimates. This means we cannot say an estimate of, for example, 20% is very accurate for the whole population. Our best estimates, from the survey sample, suggest that the figure is 20%, but due to the degree of error, the true population figure could perhaps be 18% or 22%. This is not an issue with the quality of the data or analysis; rather it is an inherent principle when using survey data to inform estimates. ↩
-
These figures were calculated using 2016 as the reference year instead of 2018, as the first monthly estimates published for 2019 were based on using 2016 as the reference year. ↩