DCMS Economic Estimates 2019: Gross Value Added – Technical and quality assurance report
Updated 3 September 2024

© Crown copyright 2024
This publication is licensed under the terms of the Open Government Licence v3.0 except where otherwise stated. To view this licence, visit nationalarchives.gov.uk/doc/open-government-licence/version/3 or write to the Information Policy Team, The National Archives, Kew, London TW9 4DU, or email: psi@nationalarchives.gov.uk.
Where we have identified any third party copyright information you will need to obtain permission from the copyright holders concerned.
This publication is available at https://www.gov.uk/government/statistics/dcms-economic-estimates-2019-gross-value-added/dcms-economic-estimates-2019-gross-value-added-technical-and-quality-assurance-report
This document covers the following topics:
- an overview of the content covered in the statistical release ‘DCMS Economic Estimates 2019 (provisional): Gross Value Added’
- an overview of DCMS Sectors, how they are defined, and limitations of these definitions
- the methodology underlying the statistical release, including data sources
- the processes used to check that the estimates have been produced correctly
- other sources of information for the DCMS sectors
- further information, including contact details for DCMS statisticians
1. Overview of release
The statistics release ‘DCMS Economic Estimates 2019 (provisional): Gross Value Added’ reports gross value added (GVA) for DCMS Sectors. GVA measures the contribution to the economy of each individual producer, industry or sector in the UK. It is used in the estimation of gross domestic product:
GVA + Taxes on Products − Subsidies on Products = GDP
Estimates of taxes and subsidies are not available at an industry level and therefore GVA is used as the headline economic measure at an industry level.
The release reports GVA expressed in both:
- current basic prices (‘nominal GVA’), which give the best ‘instantaneous’ measure of the value to the economy, but are not adjusted for the effect of inflation
- chained volume measures (‘real terms GVA’), where the effect of inflation is removed
The estimates in the publication are consistent with national (UK) estimates, published by the Office for National Statistics (ONS).
1.1 Code of Practice for Statistics
In June 2019, the DCMS Sector Economic Estimates: GVA were badged as National Statistics. This affirms that the statistics have met the requirements of the Code of Practice for Statistics.
1.2 Users
The users of these statistics fall into five broad categories:
- Ministers and other political figures
- Policy and other professionals in DCMS and other Government departments
- Industries and their representative bodies
- Charitable organisations
- Academics
The primary use of these statistics is to monitor the performance of the industries in the DCMS sectors, helping to understand how current and future policy interventions can be most effective.
2. Sector definitions
2.1 Overview of DCMS Sectors
Main sector definitions
The sectors for which DCMS has responsibility are:
- Civil Society
- Creative Industries
- Cultural Sector
- Digital Sector
- Gambling
- Sport
- Telecoms
- Tourism
In order to measure the size of the economy it is important to be able to define it. DCMS uses a range of definitions based on internal or UK agreed definitions. All definitions are based on the Standard Industrial Classification 2007 (SIC) codes. This means nationally consistent sources of data can be used and enables international comparisons.
The development of individual sector definitions in isolation as new sectors have fallen within the department’s remit has meant that there is overlap between DCMS sectors. For example, the Cultural Sector is defined using SIC codes that are nearly all within the Creative Industries, whilst the Telecoms Sector is completely within the Digital Sector.
Figure 1 below visually shows the overlap between DCMS Sectors in terms of SIC codes. Users should note that this does not give an indication of the magnitude of the value of overlap. For this, users should consult the main report. A list of SIC codes appearing in each sector and subsector can be found in the tables accompanying the release.
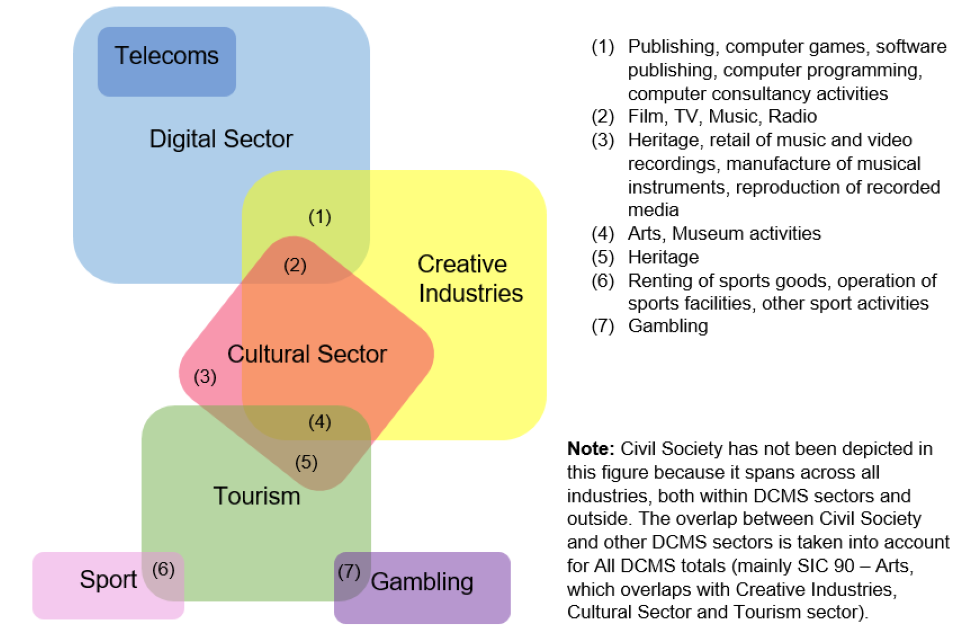
Figure 1. Overlap of SIC codes within DCMS Sectors
Other sector definitions
Additional analysis is presented in the GVA release for the Audio Visual sector and the Computer Games sector. The definition of the Audio Visual sector (see below) is intended to reflect the sectors covered by the EU Audio Visual Media Services Directive.
- 59.11 - Motion picture, video and television programme production activities
- 59.12 - Motion picture, video and television programme post-production activities
- 59.13 - Motion picture, video and television programme distribution activities
- 59.2 - Sound recording and music publishing activities
- 60.1 - Radio broadcasting
- 60.2 - Television programming and broadcasting activities
- 63.91 - News agency activities
- 63.99 - Other information service activities n.e.c.
- 77.22 - Renting of video tapes and disks
- 77.4 - Leasing of intellectual property and similar products, except copyrighted works
The Computer Games sector combines the 4-digit SIC code 58.21 (Publishing of Computer Games) and 62.01/1 (Ready-made interactive leisure and entertainment software development).
A number of software programming companies in 62.01 – ‘Computer programming activities’ may also contribute to the output of computer games, as part of a range of programming activities. This is not included in these computer games estimates, but will have been implicitly included in the ‘IT, software and computer services’ group in the main estimates.
2.2 Details and limitations of sector definitions
This section looks at sector definitions in more detail, and provides an overview of limitations. There are substantial limitations to the underlying classifications. As the balance and make-up of the economy changes, the SIC, finalised in 2007, is less able to provide the detail for important elements of the UK economy related to DCMS Sectors, and therefore best fit SIC codes have been used to produce these estimates. The following section describes limitations for specific DCMS sector definitions.
Civil Society
In July 2016, DCMS took on responsibility for the Office for Civil Society, which covers charities, voluntary organisations or trusts, social enterprises, mutuals and community interest companies. The Civil Society sector is not like a traditional industry and therefore data are not readily available in the usual data sources. Where possible, data are provided from official sources.
Civil Society sector GVA expressed in current prices is based on NPISH (Non-profit institutions serving households) data. Non-profit institutions serving households are institutions that provide goods and services either for free or below the market prices, mainly derive their income from grants and donations, and are not controlled by the government. NPISH includes non-market charities, universities, trade unions and political parties. Of these, DCMS only covers the charity sector. NPISH does not include market provider charities who have passed the market test and therefore sit in the corporate sector (these data are not currently measured by ONS on a National Accounts basis), mutuals, social enterprises or community interest companies. It is therefore recognised that the published estimates are likely to be an underestimate for the Civil Society sector.
Note that volunteering, a key element of Civil Society, has not been included in the figures due to being part of the informal economy. As estimated in the ONS published Household Satellite Account, volunteering contributed £24bn in 2016 (this includes only formal volunteering activities). The 2018 estimate for volunteering has been delayed due to COVID-19.
Creative Industries
The Creative Industries were defined in the Government’s 2001 Creative Industries Mapping Document as “those industries which have their origin in individual creativity, skill and talent and which have a potential for wealth and job creation through the generation and exploitation of intellectual property”.
The definition used for the Creative Industries in this release does not allow consideration of the value added of “creative” to the wider economy, such as Creative Occupations outside the Creative Industries. DCMS policy responsibility is for creative industries across the economy and therefore this is a significant weakness in the current approach.
Cultural Sector
There are significant limitations to the DCMS measurement of the cultural sector arising from the lack of detailed disaggregation possible using the standard industrial classifications. There are many cases where culture forms a small part of an industry classification and therefore cannot be separately identified and assigned as culture using standard data sources. DCMS consulted on the definition of Culture and published a response in April 2017.
It is recognised that, due to the limitations associated with SIC codes, the SIC code used in past publications as a proxy for the Heritage sector (91.03 - Operation of historical sites and building and similar visitor attractions) is likely to be an underestimate of this sector’s value. We have changed the name of the Heritage sector to ‘Operation for historical sites and similar visitor attractions’ to reflect this.
Digital Sector
The definition used for the Digital Sector has the advantage of international comparability. However, it does not allow consideration of the value added of “digital” to the wider economy e.g. in health care or construction. DCMS policy responsibility is for digital across the economy and therefore this is a significant weakness in the current approach.
Sport
Two definitions of sport have been used in the release. The first is based on the EU agreed core/statistical Vilnius definition, which includes only SIC codes which are predominately sport. The second estimates of sport, the Sport Satellite Account, are based on the broad Vilnius definition. This is a more wide-ranging measure of sport which considers the contribution of sport across a range of industries, for example sport advertising, and sport-related construction. The latest DCMS Sport Satellite Account is included in the tables published alongside the report. Caution should be made when using the Sport Satellite Account, as proportions have not been updated since 2016 and results are not comparable to those of other sectors. Sport GVA in the Sport Satellite Account is calculated by estimating the proportion of the SIC code that applies to sport, and then applying this proportion to the total GVA for each industry, finally summing to produce total sport GVA for each year.
Tourism
For Tourism, a satellite account approach is used, where the element of each industry that is directly supported by tourism is identified by calculating the proportion of consumers that are tourists for each industry.
3. Methodology
This chapter summarises the methodology used to produce GVA estimates, both in current prices and chained volume measures.
3.1 GVA - current prices
This first section presents the methodology for estimates of GVA expressed in current prices (i.e. not taking into account inflation).
Data sources (current prices)
The following data sources were used in the production of GVA (current prices) for DCMS sectors:
- Blue Book 2020 Consistent Supply and Use tables (published 30 October 2020)
- Latest Quarterly National Accounts (published 30 September 2020)
- Unsuppressed Annual Business Survey (ABS) approximate GVA estimates at the lowest level available
- Latest Tourism Satellite Account (published 4 November 2020 by the ONS Tourism Intelligence Unit)
- Latest balanced GVA for the non-market charities element of NPISH (Non-profit institutions serving households)
Method (current prices)
The most reliable estimate of GVA comes from the Supply and Use tables (SUT), produced annually by ONS. This contains balanced data drawn from many different sources, forming one robust estimate for each of the 112 industries in the SUT matrix.
The SUT matrix reports GVA at division level (2 digit SIC codes), but DCMS sectors are defined at industry level (3 or 4 digit SIC codes). This means a method for breaking down the SUT to industry level must be applied.
This was achieved by using approximate Gross Value Added (aGVA) data from the UK non-financial business economy (Annual Business Survey), by:
- extracting aGVA from the ABS at industry level (e.g. SIC 32.12)
- calculating aGVA from the ABS at division level (e.g. SIC 32, by aggregating industries in the division)
- calculating the proportion of the division aGVA that each industry accounts for (e.g. aGVA for SIC 32.12 as a proportion of SIC 32)
- applying the proportion for each industry to the division GVA in the SUT, to get a National Accounts consistent estimate of GVA for each industry
This method, using the National Accounts consistent SUT matrix, is preferable to only using aGVA from the ABS. There are differences between the two measures of gross value added the SUT and ABS in terms of coverage. For example, GVA covers the whole of the UK economy while aGVA covers the UK Non-Financial Business Economy, a subset of the whole economy that excludes large parts of agriculture, all of public administration and defence, publicly provided health care and education, and the financial sector. There are also conceptual differences between the two measures of gross value added. For example, some production activities such as illegal smuggling of goods must be included in the National Accounts but are outside the scope of the ABS. In addition, the national accounts data have gone through the Supply and Use balancing process, which reconciles all three estimates of GDP. Using the SUT matrix makes comparison with the wider UK economy more straightforward, and ensures that non market production is included in the DCMS estimates. More information on the differences between National Accounts GVA and Approximate GVA can be found in the article, ‘A Comparison between Annual Business Survey and National Accounts Measures of Value Added’.
GVA figures for 2010 to 2018 have been revised since the last DCMS Economic Estimates GVA publication in November 2019. These revisions take into account the latest balancing of the National Accounts and finalisation of the Annual Business Survey data. National Accounts Supply Use Tables are open to revisions back to 1997 each year. These are planned revisions and an integral part of the balancing process.
GVA figures for 2019 are provisional, as the SUT and ABS only provide data up to 2018. For 2019, the GVA data are taken from the output measure of GVA to ensure consistency with the sector measures. This is aligned to average GVA up to and including 2018 but then uses growth in the output measure as a proxy for GVA beyond that. A complete time series of GVA is available in the UK GDP(O) low level aggregates table which is published each month alongside the UK GDP publication. These short term measures tend to use turnover as a proxy for output and have no information on intermediate consumption. The 2019 figure therefore differs from National Account GVA at current basic prices (series named ABML) and National Account GVA at constant prices (series named ABMM).
Method limitations
Estimates from the Annual Business Survey (ABS) are subject to various sources of error, with sampling errors published at a 4-digit SIC level. While these data provide the best available source of information there is often volatility, especially at the 4 digit SIC level which is used to produce estimates for DCMS sectors. Further information on the quality of the ABS data is published by the Office for National Statistics.
There have also been two survey design changes in recent years (expanding the ABS population in 2015 and re-optimising the sample in 2016), but as the survey outputs are used only to provide a proportion of the SUT, these changes should have a minimal impact on the estimates of DCMS sector GVA.
Method for SIC 91: Libraries, archives, museums and other cultural activities
A different approach is used to break down the SUT matrix to 4 digit level for SIC 91. In the ABS data, the aGVA for aspects of SIC 91 can be negative (most likely due to under coverage in the ABS). For this reason, sales data from the ABS is used instead of aGVA to allocate SIC 91 at the 4-digit level. This is the only SIC where this approach has been used.
Method for Tourism (current prices)
The Tourism GVA figures were produced separately by the ONS Tourism Intelligence Unit, based on the methodology and definition set out in the UN International Recommendations for Tourism Statistics 2008 (IRTS 2008). These estimates are also produced to be consistent with National Accounts. Further information on the TSA can be found on the ONS Tourism Satellite Account methodology page.
Several methodology improvements were made for the 2018 Tourism Satellite Account, which resulted in the 2016 and 2017 data being revised. Further information on these improvements and the impact on the Tourism Satellite Account can be found in the ‘Quality assurance processes’ section.
Method for Civil Society (current prices)
The Civil Society GVA figures are based on NPISH (Non-profit institutions serving households) data. NPISH includes non-market charities, universities, trade unions and political parties. Of these, DCMS only covers the charity sector. As balanced industry data are not available split by source, we have assumed that the balancing adjustment and other inputs used during processing of data, are applied in proportion to the underlying source data.
Civil Society GVA for 2019 cannot be identified in the output approach to GDP, which is the approach taken for other DCMS sectors. Between Blue Books the only data published on NPISH is their final consumption expenditure. It is not appropriate to use this for the 2019 estimate as it captures only one element of output with no information on intermediate consumption. The 2019 estimates published by DCMS are therefore predicted using the existing time series and the AAA (additive error, additive trend and additive seasonality) version of the Exponential Triple Smoothing (ETS) algorithm in Excel. This smooths out minor deviations in past data trends by detecting seasonality patterns and confidence intervals.
Accounting for sector overlap
As mentioned in the sector definitions chapter, there is an overlap between DCMS sector definitions. This overlap must be estimated in order to avoid double counting and produce a robust estimate for all DCMS sectors. In most cases, the overlap is estimated by looking at which SIC codes appear in multiple sectors. All unique SICs can then be aggregated to give a total figure with no overlap.
For Tourism a slightly different approach is required, due to the methodology used to calculate GVA for this sector. The first stage is to identify SIC codes which are part of tourism and appear in other DCMS sectors (90, 91.02, 91.03, 91.04, 77.21, 92, 93.11 and 93.19). As the tourism estimates are not categorised at the class level (4 digit SIC code), an estimate has to be made for the part of tourism which is in each of the SIC codes. This is done using the tourism ratio.
The total overlap for Tourism is the sum of the GVA for the Tourism component of these SIC codes. The total overlap was deducted from the DCMS sector total to avoid double counting.
For Civil Society, it is not possible to identify the overlap between NPISH sectors and DCMS sectors due to the way the data are processed, unless there is an exact 1:1 match. For example, NPISH data are provided for SICs 68.1 and 68.2 and cannot be separated, but only SIC 68.2 is a DCMS industry. Therefore a slight overlap will be included in the ‘All DCMS Sector’ value. It is estimated that the overlap is a maximum of 0.1% of total UK GVA in 2018. However, given that the estimates for Civil Society as a whole are an underestimate for the sector (see the sector definitions chapter), the ‘All DCMS Sector’ value is not an overestimate even when compensating for this small overlap.
3.2 GVA - chained volume measure
This second section presents the methodology for estimates of gross value added (GVA) for DCMS sectors, expressed in chained volume measures (i.e. taking into account inflation). GVA estimates expressed in chained volume measures was published for the first time in November 2017 in response to user demand.
In Chained Volume Measures (CVMs), inflation is taken into account. CVMs are different to constant prices. Constant prices are simply the current price data deflated using a price from one base period, which is updated every 5 years. For CVMs, the base period is updated each year (for the latest publication, this is 2018). CVMs are created by linking together series with different base years. In this analysis we use the CVM price series to calculate volume in terms of previous year prices and current year prices.
Data sources
The following data sources were used in the production of GVA (chained volume measures) for DCMS sectors:
- Current prices data (see previous chapter, GVA - current prices, for data sources and methodology).
- Experimental industry level deflators (previously published on the ONS website, Industry Level Deflators, but for this release have been updated with the latest data).
Method (chained volume measure)
The current price data is broken down by industry for each of the aggregated industries included within the DCMS remit. The exception to this is Tourism, which is included as a single aggregated industry. An estimate for the Civil Society sector expressed in chained volume measures is not currently available.
In order to derive a Chain Volume Measure (CVM) we make use of the relationship
value = volume x price
Current price estimates are the ‘value’ component of this equation.
The ‘price’ component comes from experimental industry level deflators, previously published on the ONS website (Industry Level Deflators) but for this release have been updated with the latest data. This is a different deflation method than is used within the National Accounts but provides similar results. Deflation at an industry level within National Accounts is carried out by proportioning the industries into their relevant products and then deflating each product separately, before aggregating back up to an industry level.
Experimental industry level deflators are not available for all of the SIC codes in DCMS sectors, therefore deflators are used which match as closely as possible to each industry. All were in the form of a price index with 2010 = 100.
For each 3 or 4 digit SIC code in DCMS sectors, the ‘volume’ series is obtained by dividing the current price series by the deflator (price) series.
volume = value/price
To create a chained volume measure, the value series in previous year’s and current year’s prices is calculated (PYP and CYP respectively). The CYP series is simply the current price (‘value’) series.
CYPt = volumet x pricet= valuet
where t is time (year).
The PYP series is given by
PYPt = volumet x pricet-1
The PYP series and CYP series are then summed across relevant SIC codes to give a PYP and CYP aggregate for each DCMS sector and subsector, and the DCMS Sector total.
These are used to obtain scaling factors at sector and subsector level. When t ≥ base year, the scaling factor is 1. In this analysis, the base year is 2018 to remain in line with National Accounts data published by ONS. When t < base year, the scaling factor is given by
SFt = (CYPt+1 / PYPt+1) x SFt+1
The CVM is then calculated for each sector and subsector. When t ≤ base year, CVM is
CVMt = SFt x CYPt
When t > base year, CVM is given by
CVMt = SFt x PYPt
The output is a CVM series from 2010 to 2019 for each sector and subsector, and the DCMS Sector total.
Users should note that the methodology for chained volume measures means they are not additive prior to the base year. This means the sum of subsector values will not equal sector values prior to 2018. This caveat does not affect summing of sector values to form the All DCMS total, as the All DCMS total is lower than the sum of the individual sectors due to overlap between sectors.
Method for Tourism (chained volume measure)
Due to revisions in IPS methodology, current price data for Tourism from 2010 to 2015 is not available. A time series from 2016 to 2019 for the Tourism aggregate was produced.
Since Tourism is treated as a single aggregated industry, a single Tourism deflator is required. For each industry within the Tourism aggregate, deflators are collected in the same way as before (i.e. using the experimental deflators). The deflators are then weighted together to form a single deflator.
The Tourism industries are omitted from the current price data at an industry level so current price data cannot be used for the weights. Instead ABS data is used for weighting. The weight for each industry, for each year, is the aGVA of the industry as a proportion of Tourism total aGVA, sourced from ABS.
Then the deflator (or price index) for each industry is given by
weighted deflatort = weightt x pricet
The weighted deflator series for each industry is then summed to give a single deflator series for all the tourism industries.
Users should note that the weighted deflators are based on SIC codes in the main Tourism definition, and do not currently take into account the ‘Other consumption products’ component of the Tourism sector.
The PYP, CYP, scaling factors and CVM series are then calculated for the Tourism sector as described above in 3.2.2 Method (chained volume measure). The same method is also used to calculate a Tourism non-overlap CVM series, which is used to calculate the All DCMS total. To calculate the Tourism non-overlap CVM series, the Tourism non-overlap current prices figure is used (see 3.1.7 Accounting for overlap) and the weighted deflators are based on SICs that are only part of tourism and not in other DCMS sectors.
3.3 Summary of data sources
In summary, the data presented in this report on GVA
- are based on official statistics data sources
- are based on internationally-harmonised codes
- are based on survey data (Annual Business Survey and National Accounts) and, as with all data from surveys, there will be an associated error margin surrounding these estimates[footnote 1]
This means the estimates are:
- comparable at both a national and international level.
- comparable over time, allowing trends to be measured and monitored
However, this also means the estimates are subject to limitations of the underlying classifications of the make-up of the UK economy. For example, the standard industrial classification (SIC) codes were developed in 2007 and have not been revised since. Emerging sectors, such as Artificial Intelligence, are therefore hard to capture and may be excluded or mis-coded.
4. Quality assurance processes
This chapter summarises the quality assurance processes applied during the production of the DCMS Economic Estimates 2019 (provisional): Gross Value Added statistics. This includes a detailed account of the quality assurance processes and the data checks carried out by our data providers (Office for National Statistics, ONS) as well as by DCMS.
4.1 Quality Assurance Processes at ONS
Quality assurance at ONS takes place at a number of stages. The various processes in place to ensure quality for the data sources used in the GVA publication are outlined below. It is worth noting that information presented here on the data sources are taken from various ONS technical reports and should be credited to colleagues at the ONS.
The Blue Book
The Blue Book Annual GDP estimates are published at two different stages. Annual estimates are first available once all quarterly data for a given year is available in the quarterly national accounts. Annual estimates are then available in the UK National Accounts, The Blue Book, which is usually published between July and October each year (please note that The Blue Book is subject to a process of annual reconciliation). Trade statistics, Balance of Payments, public sector accounts and other short-term indicators of economic activity are all integrated within the system of national accounts.
It is important to emphasise that the national accounts are estimates based on statistical surveys, forecasts and models. For further information on quality and reliability issues for the Blue Book and associated publications, see the National Accounts page.
Annual Business Survey (ABS)
For more information on quality assurance processes utilized during the production and analysis of ABS, see Annual Business Survey technical report: August 2018.
Non-profit institutions serving households (NPISH)
Within the UK, we define the non-profit institutions serving households (NPISH) sector to include universities, trade unions, political parties, further education colleges and most charities. This data is used to estimate the Civil Society sector report.
Since Blue Book 2018, improvements have been made to the efficiency and usability of the NPISH processing system. The system processes the sample of general charities data received from the National Council for Voluntary Organisations (NCVO). These data feed into the NPISH sector estimates within the UK National Accounts. For further information on improvements made to NPISH methods, see this National Accounts article.
Tourism Satellite Account
When measuring Tourism, DCMS refers to the Tourism Satellite Account (TSA). The Tourism Satellite Account (TSA) is an extension to a System of National Accounts. It enables users to gain an understanding of the size and role of tourism-related economic activity, which is usually “hidden” within standard national accounts. Further information on the TSA can be found on the ONS Tourism Satellite Account methodology page.
4.2 Validation and accuracy of data
The Blue Book
There is no simple way of measuring the accuracy of GDP. All estimates, by definition, are subject to statistical uncertainty and for many well-established statistics we measure and publish the sampling error and non-sampling error associated with the estimate, using this as an indicator of accuracy.
Since sampling is typically done to determine the characteristics of a whole population, the difference between the sample and population values is considered a sampling error. Nonsampling errors are a result of deviations from the true value that are not a function of the sample chosen, including various systematic errors and any other errors that are not due to sampling.
The estimate of GDP, however, is currently constructed from a wide variety of data sources, some of which are not based on random samples or do not have published sampling and non-sampling errors available. As such it is very difficult to measure both error aspects and their impact on GDP.
Sample sizes can vary from 100% (HMRC Self assessment data) to 1% (HMRC PAYE data). These variations are unavoidable in the collation of reliable time series data for the calculation of GVA. Improvements in the GVA methodology or changes in administrative source data allows for reviewing the available sources for higher quality datasets or more timely publications. This is an ad hoc and continuous process which does not include major revisions to the methodology of GVA.
The vast majority of source data are annually updated, however, some datasets are published biennially or on an ad hoc basis. These missing values are imputed, using other available information. As with sample size, potential improvements to the methodology are reviewed whenever new data becomes available or when significant changes to the source data affect the final values. Where no recent estimate is available, the previous year’s data may be used. It is important to note however, that these issues are rare because of the completeness of the main source data.
Estimates of approximate GVA are also published as part of the Annual Business Survey release. These estimates are used in the production of annual Supply and Use Tables for the compilation of the UK gross domestic product (GDP).
Annual Business Survey
The Annual Business Survey (ABS) measures business and financial information from UK businesses, including total turnover, total employment costs, total purchases, capital expenditure, stocks and other aggregates. Variables derived from these statistics, such as approximate gross value added at basic prices are also published by the ABS. For information on the ABS quality, please refer to the DCMS Sector Economic Estimates 2018: Business Demographics - Quality Assurance Report.
Approximate gross value added (aGVA) vs GVA in the National Accounts
aGVA represents the amount that individual businesses, industries or sectors contribute to the economy. Generally, this is measured by the income generated by the business, industry or sector minus their intermediate consumption of goods and services used up in order to produce their output, labour costs (for example, wages and salaries) and an operating surplus (or loss). The latter is a good approximation for profits, from which the cost of capital investment, financial charges and the payment of dividends to shareholders are met.
There are differences between the approximate measure of aGVA calculated by ABS and the measure of gross value added (GVA) used in the national accounts. The National Accounts carry out coverage adjustments, conceptual adjustments and coherence adjustments. This estimate of GVA uses inputs from a number of surveys and covers the whole UK economy, whereas the ABS does not include some parts of the agriculture and financial activities sectors, or public administration and defence.
The ABS total aGVA is around two-thirds of the national accounts whole economy GVA because of these differences. Real (inflation-adjusted) estimates of national and regional GVA are published in the national accounts and regional accounts respectively. However, national and regional estimates of aGVA from the ABS are not adjusted for inflation.
There are also some conceptual differences between the two measures of gross value added. For example, some production activities such as illegal smuggling of goods must be included in the national accounts but are outside the scope of the ABS.
More information on this can be found in the Annual Business Survey technical report: August 2018.
Tourism Satellite Account
The data in the 2018 Tourism Satellite Account (2018) contain revised estimates for the years 2016 and 2017, incorporating improved data from a number of Tourism Satellite Account (TSA) source datasets. The largest impact on revisions has been driven by the incorporation of revised International Passenger Survey (IPS) data following the introduction of new and improved methodologies to this survey. More information on the improved IPS methodology and the associated impacts is available. The new methodology produces higher estimates of spend for UK residents visiting abroad and overseas residents visiting the UK. This means that published estimates of UK and overseas visitors are now consistent with administrative data on total passenger numbers entering and leaving the UK.
Blue Book-consistent revisions to other source data have also driven smaller revisions to the TSA, for example, the household final consumption expenditure data as contained within the input–output supply and use tables.
The new figures for 2016 to 2019 published this year are not comparable with UK-TSA figures prior to 2016, as these changes have not been implemented in the data prior to 2016.
4.3 Quality Assurance Processes at DCMS
The majority of quality assurance of the data underpinning the DCMS Sectors Economic Estimates: Gross Value Added release takes place at ONS, through the processes described above. However, further quality assurance checks are carried out within DCMS.
Production of the report is typically carried out by one member of staff, whilst quality assurance is completed by at least one other, to ensure an independent evaluation of the work.
Data requirements and data delivery
For the ABS data, DCMS discussed our data requirements with ONS and these are formalised as a Data Access Agreement (DAA). The DAA covers which data are required, the purpose of the data, and the conditions under which ONS provide the data. Discussions of requirements and purpose with ONS improved the understanding of the data at DCMS, helping us to ensure we receive the correct data and use it appropriately.
DCMS checks that the data delivered by ONS match what is listed in the Data Access Agreement (DAA). For this particular release we check that:
- we have received all data at the 4 digit SIC code level, which is required for us to aggregate up to produce estimates for our sectors and sub-sectors
- data at the 4 digit SIC code has not been rounded unexpectedly. This would cause rounding errors when aggregating up to produce estimates for our sectors and subsectors
Data Analysis quality assurance checks
At the analysis stage, data are aggregated to produce information about DCMS sectors and sub-sectors. The GVA statistics lead checks whether:
- the GVA proportions are similar to last year, and if not, whether this is because of changes to the methodology
- there is any missing data
- the percentage changes each year look similar
- the updated UK National Accounts data has been used, including the revised back series data
- the correct SIC codes have been aggregated together to form DCMS sector and sub-sector estimates
Publication quality assurance checks
Finalised figures are disseminated within Excel tables and a written report (which includes written text, graphs, tables and infographics) published on GOV.UK. These are produced by the GVA statistics lead. Before publishing, a quality assurer checks the data tables as well as the report to ensure minimal errors. This is checked against a QA log where comments can be fed back and actioned accordingly. The quality assurer also makes sure any statements made about the figures (e.g. regarding trends) are correct according to the analysis and checks for spelling or grammatical errors.
Proofreading and publication checks are done at the final stage, including:
- checking the figures in the publication match the published tables
- checking the footnote numbering is correct
- making sure hyperlinks work
- checking chart/table numbers are in the correct order
- ensuring the publication is signed off by DCMS Head of Profession for Statistics and DCMS Chief Economist
- contacting press office to ensure they are aware of the release date
- checking the published GOV.UK page again after publishing
Post publication
Once the publication is released, DCMS reviews the processes and procedures followed via a wash up meeting. This occurs usually a week after the publication release date and discusses:
- what went well and what issues were encountered
- what improvements can be made for next time
- what feedback have we received from engaging with users
5. External Data Sources
It is recognised that there are always different ways to define sectors, but their relevance depends on what they are needed for. Government generally favours classification systems which are
- rigorously measured
- internationally comparable
- nationally consistent
- ideally applicable to specific policy interventions
These are the main reasons for DCMS constructing sector classifications from Standard Industrial Classification (SIC) codes. However, DCMS accepts that there are limitations with this approach and alternative definitions can be useful where a policy-relevant grouping of businesses crosses existing Standard Industrial Classification (SIC) codes. DCMS is aware of other estimates of DCMS Sectors. These estimates use various methods and data sources, and can be useful for serving several purposes, e.g. monitoring progress under specific policy themes such as community health or the environment, or measuring activities subsumed across a range of SICs.
Table 1 shows different sources of analysis measuring the economic contribution of different DCMS policy areas from our arm’s-length bodies. It is recognised that there will be many other sources of evidence from industry bodies, for example, which have not been included in this table. This will be developed over time to capture a wider spectrum of stakeholder’s releases. We encourage statistics producers within DCMS sectors who are not represented in the table to contact the economic estimates team at evidence@dcms.gov.uk.
Table 1. Alternative data sources measuring economic contribution of DCMS sectors
| Sector | Sub-sector | Organisation | Summary of use |
|---|---|---|---|
| Civil Society | Civil Society | ONS | ONS publishes a household satellite account which includes an estimate for volunteering for 2015 and 2016. This is based on the DCMS Community Life Survey and multiplying participation by the median earnings. However these figures should not be included in the GVA figure for the economy due to volunteering being part of the informal economy, and therefore not captured in the ONS’s methodology for calculating GVA. |
| Creative Industries and Cultural Sector | Arts | Arts Council England (ACE) | ACE provides a value of GVA and employment accountable by the Arts and Culture industry. They use similar SIC codes to DCMS’ Economic Estimates, but rather than using the supply and use tables and then the Annual Business Survey to inform the proportions to use, ACE use only the Annual Business Survey and therefore an approximate measure of GVA. |
| Creative Industries and Cultural Sector | Film, TV, video, radio and photography; IT, software and computer services | British Film Institute (BFI) | BFI provides a value of GVA and FTE employment accountable by the Screen sector. The analysis uses a bespoke economic impact model developed for this study, reflecting current best practice in economic impact modelling, aligning the study with current government evaluation methodology (HM Treasury Green Book 2018). |
| Creative Industries and Cultural Sector | Museums, Galleries and Libraries; Museums and Galleries | Arts Council England (ACE) | ACE commissioned a report on the economic impact of museums in England in 2013. This methodology is very different to that of the DCMS Sector Economic Estimates, in particular the definition of museums was much wider. ACE have identified the limitations with using SIC codes for museums, namely that to be included in the official statistical surveys, the museum needs to be registered for PAYE or VAT, which means some of the small museums would not be included in these official sources. The same applies to local authority delivered museum services which would be coded under the Public Administration SIC code. As a result ACE have used a bottom-up approach of developing a database of museums in England then using various sources to identify the economic measures for each museum. This is for England and was produced in 2013. |
| Cultural Sector | Heritage | Historic England | Historic England provides a value of GVA and employment accountable by the Heritage sector. Historic England use a satellite account approach to measure the heritage sector. Satellite accounts measure a sector by aggregating shares of other SICs, estimated using Standard Occupational Classification (SOC) codes primarily and additional information. They can serve several purposes, e.g. monitoring progress under specific policy theme. While potentially useful, the quality of the data depends on that of the evidence used to estimate the appropriate share of existing SICs. These figures are useful in building the sectoral narrative, and in advocacy work (e.g. in speeches, alongside our sector estimates). However the scope of the industries included is much wider than for DCMS’ estimates. |
| Gambling | Gambling | Gambling Commission | The Gambling Commission produces industry statistics twice a year on gross gambling yield, employment and number of businesses. The methods are different to DCMS’ Economic Estimates to reflect the different data sources available to the Gambling Commission and their policy needs. The Gambling Commission derive their estimates from the operators. As it is a license requirement for operators to submit returns the data collection is essentially a census. This has benefits compared to using a sample survey. DCMS define the gambling sector as SIC 92; however it is likely that there will be companies outside of SIC 92 included in the Gambling Commission statistics. For example, some working men’s clubs may hold a license but would not be classified under SIC 92 by virtue of their other primary activities. Finally, Gambling Commission do not produce an estimate of GVA; instead they provide Gross Gambling Yield (GGY), which is the amount retained by gambling operators after the payment of winnings but before the deduction of operation costs, excluding the national lottery. This is because this measure is understood by the sector as a whole and is internationally comparable. This means the Gambling Commission can compare historically and internationally, but it does mean it is not comparable against other sectors. |
| Sport | Sport | Sport England | Sport England produces an estimate of the GVA and number of FTE jobs generated by sport and sport-related activity. This was updated in 2017/18 and covers England only. GVA is split by participation and consumption. The definition is wider than the statistical definition used by DCMS, but is similar to the sport satellite account approach based on the Vilnius definition. This means elements such as sport broadcasting are included. While potentially useful, the quality of the data depends on that of the evidence used to estimate the appropriate share of existing SICs. |
| Sport | Sport | UK Sport | UK Sport has produced estimates of the contribution of the Olympic and Paralympic sports. Whilst this is not fully comparable with DCMS’ estimates due to its much narrower scope, it uses a similar methodology to the DCMS Sport satellite account. Please note that this Sport satellite account is not currently part of the DCMS Sector Economic Estimates so there will be further differences in methodology and scope of industries. UK Sport use a satellite account approach for a portfolio of sports. They produce a GVA and employment estimates, using a range of sources: ABS/ASHE, 2014 Input-Output tables, Participation data and company accounts. Whilst these are not the exact same data sources as DCMS uses, or the most up to date, they do enable a comparison to DCMS statistics. They are therefore a robust estimate if the user is looking for specific Olympic and Paralympic sports. However, as with all satellite accounts, the quality of the data depends on that of the evidence used to estimate the appropriate share of existing SICs. |
| Tourism | Tourism | VisitBritain | VisitBritain have commissioned a report to value the number of jobs and economic contribution in the Tourism industry. This is based on a bespoke model, but the direct tourism industry figures have consistency with the Tourism Satellite Account methodology, which DCMS uses for its Tourism estimates. It is based on 2008 to 2011, so is more outdated than DCMS estimates. |
6. Further information
For enquiries on this release, please email evidence@dcms.gov.uk.
For general enquiries contact: Department for Digital, Culture, Media and Sport 100 Parliament Street London SW1A 2BQ Telephone: 020 7211 6000
DCMS statisticians can be followed on Twitter via @DCMSInsight.
The Economic Estimates of DCMS Sectors release is an Official Statistics publication and has been produced to the standards set out in the Code of Practice for Statistics. For more information, see https://www.statisticsauthority.gov.uk/code-of-practice/.
-
Sampling error is the error caused by observing a sample (as in a survey) instead of the whole population (as in a census). While each sample is designed to produce the “best” estimate of the true population value, a number of equal-sized samples covering the population would generally produce varying population estimates. This means we cannot say an estimate of, for example, 20% is very accurate for the whole population. Our best estimates, from the survey sample, suggest that the figure is 20%, but due to the degree of error, the true population figure could perhaps be 18% or 22%. This is not an issue with the quality of the data or analysis; rather it is an inherent principle when using survey data to inform estimates. ↩