Cyber security breaches survey 2024
Published 9 April 2024

© Crown copyright 2024
This publication is licensed under the terms of the Open Government Licence v3.0 except where otherwise stated. To view this licence, visit nationalarchives.gov.uk/doc/open-government-licence/version/3 or write to the Information Policy Team, The National Archives, Kew, London TW9 4DU, or email: psi@nationalarchives.gov.uk.
Where we have identified any third party copyright information you will need to obtain permission from the copyright holders concerned.
This publication is available at https://www.gov.uk/government/statistics/cyber-security-breaches-survey-2024/cyber-security-breaches-survey-2024
The Cyber Security Breaches Survey is a research study for UK cyber resilience, aligning with the National Cyber Strategy. It is primarily used to inform government policy on cyber security, making the UK cyberspace a secure place to do business. The study explores the policies, processes and approach to cyber security, for businesses, charities and educational institutions. It also considers the different cyber attacks and cyber crimes these organisations face, as well as how these organisations are impacted and respond.
For this latest release, the quantitative survey was carried out in winter 2023/24 and the qualitative element in early 2024.
Lead analyst
Maddy Ell
Responsible statistician
Saman Rizvi
Enquiries:
Summary
Identification of cyber security breaches and attacks
Cyber security breaches and attacks remain a common threat.
Half of businesses (50%) and around a third of charities (32%) report having experienced some form of cyber security breach or attack in the last 12 months. This is much higher for medium businesses (70%), large businesses (74%) and high-income charities with £500,000 or more in annual income (66%).
By far the most common type of breach or attack is phishing (84% of businesses and 83% of charities). This is followed, to a much lesser extent, by others impersonating organisations in emails or online (35% of businesses and 37% of charities) and then viruses or other malware (17% of businesses and 14% of charities).
Among those identifying any breaches or attacks, we estimate the single most disruptive breach from the last 12 months cost each business, of any size, an average of approximately £1,205. For medium and large businesses, this was approximately £10,830. For charities, it was approximately £460. More information on costs can be found in chapter 4.
There were some changes this year to the question that seeks to capture the overall incidence of cyber attacks and breaches. Due to these changes, it is not possible to make direct comparisons between 2023 and 2024.
Cyber hygiene
The most common cyber threats are relatively unsophisticated, so government guidance advises businesses and charities to protect themselves using a set of “cyber hygiene” measures. A majority of businesses and charities have a broad range of these measures in place. The most common are updated malware protection, password policies, cloud back-ups, restricted admin rights and network firewalls - each administered by at least seven in ten businesses and around half of charities or more. Compared to 2023, the deployment of various controls and procedures has risen slightly among businesses:
- using up-to-date malware protection (up from 76% to 83%)
- restricting admin rights (up from 67% to 73%)
- network firewalls (up from 66% to 75%)
- agreed processes for phishing emails (up from 48% to 54%).
These trends represent a partial reversal of the pattern seen in the previous three years of the survey, where some areas had seen consistent declines among businesses. The changes mainly reflect shifts in the micro business population and, to a lesser extent, small and medium businesses.
Risk management and supply chains
Businesses are more likely than charities to take actions to identify cyber risks. Larger businesses (defined as medium and large businesses as opposed to smaller business that cover micro and small business) are the most advanced in this regard.
31% of businesses and 26% of charities have undertaken cyber security risk assessments in the last year - rising to 63% of medium businesses and 72% of large businesses.
A third of businesses (33%) deployed security monitoring tools, rising to 63% of medium businesses and 71% of large businesses. The proportion was lower among charities (23%).
Around four in ten businesses (43%) and a third of charities (34%) report being insured against cyber security risks rising to 62% of medium businesses and 54% of large businesses (i.e. cyber insurance is more common in medium businesses than large ones). Compared to the 2023 survey, the proportion of businesses with some form of insurance has increased from 37% to 43%, while the proportion has remained stable among charities.
Just over one in ten businesses say they review the risks posed by their immediate suppliers (11%, vs. 9% of charities). More medium businesses (28%) and large businesses (48%) review immediate supplier risks.
The qualitative interviews suggest that organisations have an increasing awareness of the cyber security risks posed by supply chains. Despite this, organisations, particularly at the smaller end, tend to have limited formal procedures in place to manage cyber risks from wider supply chains.
Board engagement and corporate governance
Board engagement and corporate governance approaches towards cyber security tend to be more sophisticated in larger organisations. Levels of activity have remained stable compared with 2023.
Three-quarters of businesses (75%) and more than six in 10 charities (63%) report that cyber security is a high priority for their senior management. This proportion is higher among larger businesses (93% of medium businesses and 98% of large businesses, vs. 75% overall). The same is true for high-income charities (93% of those with income of £500,000 or more, vs. 63% overall).
The proportion that say cyber security is a high priority has remained stable since 2023, following an apparent decrease in prioritisation in 2023. The qualitative interviews suggest that, despite economic conditions, many organisations have continued to invest either the same amount or more in cyber security over the last 12 months. This is in part a response to the perceived increase in the number of cyber-attacks and their sophistication.
Three in ten businesses and charities (both 30%) have board members or trustees explicitly responsible for cyber security as part of their job role - rising to 51% of medium businesses and 63% of large businesses. There has been no change in the overall figures since 2023.
22% of medium businesses and 33% of large businesses have heard of the NCSC’s Board Toolkit rising from 11% and 22% respectively in 2020 (when it was introduced).
58% of medium businesses, 66% of large businesses and 47% of high-income charities have a formal cyber security strategy in place. The figures for both businesses and charities are higher than in 2023 with significant changes seen for medium businesses and charities.
Qualitative data shows a similar set of issues to previous years that prevent boards from engaging more in cyber security, including a lack of knowledge, training and time. It also highlights a contrast between more structured board engagement in larger organisations, compared with more informal approaches in smaller organisations, where responsibility was often passed onto external contractors.
Cyber accreditations and following guidance
The proportion of businesses seeking external information or guidance on cyber security has fallen since 2023. In addition, a sizeable proportion of organisations, including larger organisations, continue to be unaware of government guidance such as the 10 Steps to Cyber Security, and the government-endorsed Cyber Essentials standard. Linked to this, relatively few organisations at present are adhering to recognised standards or accreditations.
Four in ten businesses (41%) and charities (39%) report seeking information or guidance on cyber security from outside their organisation in the past year, most commonly from external cyber security consultants, IT consultants or IT service providers. The figure for businesses is lower than in 2023 (49%), while there has been no change among charities.
13% of businesses and 18% of charities are aware of the 10 Steps guidance - rising to 37% of medium businesses and 44% of large businesses. Nevertheless, 39% of businesses and 32% of charities have taken action on 5 or more of the 10 Steps. This is much more common in medium businesses (80%) and large businesses (91%). Just 3% of businesses and charities have enacted all 10 Steps, increasing to 14% of medium businesses and 27% of large businesses.
12% of businesses and 11% of charities are aware of the Cyber Essentials scheme, consistent with 2023 but representing a decline over last 2-3 years. Awareness is higher among medium businesses (43%) and large businesses (59%). Although only 3% of businesses and charities report adhering to Cyber Essentials, a higher proportion (22% of businesses and 14% of charities) report having technical controls in all five of the areas covered by Cyber Essentials.
Qualitative findings suggest the desire to seek external accreditation can be due to client demand, pressure from board members, a motivation to enforce a positive change in staff culture, and peace of mind for stakeholders.
Incident response
While a large majority of organisations say that they will take several actions following a cyber incident, in reality a minority have agreed processes already in place to support this. These findings are consistent with previous years.
The most common processes, mentioned by around a third of businesses and charities, are having specific roles and responsibilities assigned to individuals, having guidance on external reporting, and guidance on internal reporting.
Formal incident response plans are not widespread (22% of businesses and 19% of charities have them). This rises to 55% of medium-sized businesses, 73% of large businesses and 50% of high-income charities.
External reporting of breaches remains uncommon. Among those identifying breaches or attacks, 34% of businesses and 37% of charities reported their most disruptive breach outside their organisation. Many of these cases simply involve organisations reporting breaches to their external cyber security or IT providers and no one else.
The qualitative interviews highlighted several challenges organisations might face when dealing with cyber incidents. In smaller organisations, there was a strong reliance on DSPs for incident response, such as IT providers and cloud storage providers. This was linked with a lack of in-house expertise or capacity. In larger organisations, the challenges were often more related to a disconnect between IT or cyber teams and wider staff, including senior managers.
Cyber crime
Some cyber security breaches and attacks do not constitute cyber crimes under the Computer Misuse Act 1990 and the Home Office Counting Rules. Therefore, the statistics on prevalence and financial cost of cyber crime differ from the equivalent estimates for all cyber security breaches or attacks (as described above). They should be considered as a distinct set of figures, specifically for crimes committed against organisations, so are a subset of all breaches and attacks.
This survey includes questions on cyber crime and cyber-facilitated fraud. Changes to the questions were made in order to strengthen the reliability of the more experimental data from the 2023 survey. Due to these changes, it is not possible to make direct comparisons between 2023 and 2024. The new 2024 data should also still be considered experimental.
An estimated 22% of businesses and 14% of charities have experienced cyber crime in the last 12 months, rising to 45% of medium businesses, 58% of large businesses and 37% of high-income charities. Looked at another way, among the 50% businesses and 32% of charities identifying any cyber security breaches or attacks, just over two-fifths (44% for businesses and 42% for charities) ended up being victims of cyber crime.
Phishing is by far the most common type of cyber crime in terms of prevalence (90% of businesses and 94% of charities who experienced at least one type of cyber crime). The least commonly identified types of cyber crime are ransomware and denial of service attacks (2% or less of businesses and charities who experienced cyber crime in each case). When removing phishing-related cyber crimes, we estimate that 3% of businesses and 2% of charities have experienced at least one non-phishing cyber crime in the last 12 months.
A total of 3% of businesses and 1% of charities have been victims of fraud as a result of cyber crime. The proportion is higher among large businesses (7%).
We estimate that UK businesses have experienced approximately 7.78 million cyber crimes of all types and approximately 116,000 non-phishing cyber crimes in the last 12 months. For UK charities, the estimate is approximately 924,000 cyber crimes of all types in the last 12 months. It should be noted that these estimates of scale will have a relatively wide margin of error.
The average (mean) annual cost of cyber crime for businesses is estimated at approximately £1,120 per victim (this excludes crimes where the only activity was phishing).
Chapter 1: Introduction
1.1 Code of practice for statistics
The Cyber Security Breaches Survey is an official statistic and has been produced to the standards set out in the Code of Practice for Statistics.
1.2 Background
Publication date: 9 April 2024
Geographic coverage: United Kingdom
The Department for Science, Innovation and Technology (DSIT), in partnership with the Home Office, commissioned the Cyber Security Breaches Survey of UK businesses, charities and education institutions as part of the National Cyber Security Programme.[footnote 1] The findings of this survey provide a comprehensive description of cyber security for a representative sample of UK organisations, which provides a snapshot of UK cyber resilience at this point in time. It tells us about the cyber threats’ organisations face and the actions they are taking to stay secure. It also supports the government to shape future policy in this area, in line with the National Cyber Strategy 2022.
To increase the value of these statistics, the study now includes estimates of cyber crime, and fraud that occurred as a result of cyber crime (see Chapter 6). Whilst questions on cyber crime were included in the 2023 survey, they were significantly changed for the 2024 survey and so there is no baseline for comparison. These statistics should ideally be considered alongside other related evidence on computer misuse, such as the general public statistics from the Crime Survey for England and Wales (CSEW). The Cyber Security Breaches Survey adds to the broad picture from these other surveys by looking at these types of crimes across businesses and charities.
The research was conducted by the independent research organisation, Ipsos. The project requirements and reporting are approved by Department for Science, Innovation and Technology and the Home Office. The 2024 publication includes coverage of the following areas:
- prioritisation, information seeking (including use of government guidance) and decision making on cyber security, including among organisations’ management boards
- cyber security approaches, covering risk management (including cyber insurance and supply chain risks), technical controls, staff training and responsibilities and governance
- the cyber threat landscape, including identification of cyber security breaches or attacks, their outcomes and impacts, their estimated financial cost
- incident response approaches and reporting of cyber security breaches or attacks
- the prevalence, nature, scale and financial costs of cyber crime, as well as the prevalence, nature and scale of fraud that occurred as a result of cyber crime
This 2024 publication follows previous surveys in this series, published annually since 2016. In each publication year, the quantitative fieldwork has taken place in the winter of the preceding year (for example, September 2023 to January 2024, for this latest survey).
This Statistical Release focuses on the business and charity outcomes. The results for educational institutions have been included in a separate Education Annex.
1.3 Methodology
As in previous years, there were two strands to the Cyber Security Breaches Survey:
- We undertook a random probability telephone and online survey of 2,000 UK businesses, 1,004 UK registered charities and 430 education institutions from 7 September 2023 to 19 January 2024. The data for businesses and charities have been weighted to be statistically representative of these two populations.
- We carried out 44 in-depth interviews between December 2023 and January 2024, to gain further qualitative insights from some of the organisations that answered the survey.
Sole traders and public-sector organisations are outside the scope of the survey. In addition, businesses with no IT capacity or online presence were deemed ineligible. These exclusions are consistent with previous years, and the survey is considered comparable across years.
The educational institutions, covered in the separate Education Annex, comprise 185 primary schools, 171 secondary schools, 43 further education colleges and 31 higher education institutions.
More technical details and a copy of the questionnaire are available in the separately published Technical Annex.
1.4 Changes since the 2023 study
The core approach for the 2024 study - data collected from organisations via a random-probability survey, predominantly conducted by telephone is unchanged from the previous years. As such, we continue to make comparisons to previous years with the exceptions noted below.
Whilst there were no changes to the methodology between 2023 and 2024, there were some changes to the questionnaire. Key changes include modifications to the questions capturing breaches or attacks; wording changes throughout e.g. switching from ‘infected’ to ‘targeted’ and significant changes to the cyber crime questions. The significant changes made to the cyber crime questions were done primarily to reduce complexity of the overall section of the survey.
Respondents were guided through a series of questions which determine what the principle crime was (not relying on respondent to recall order of events) and avoid double counting. This was intended to prevent respondents from contradicting themselves and thus improve data quality. Full details of the questionnaire’s changes are covered in the Technical Annex. Due to these changes, it is not possible to make direct comparisons between 2024 and previous years on incidence of cyber breaches or attacks and on the cyber crime questions.
1.5 Interpretation of findings
How to interpret the quantitative data
The survey results are subject to margins of error, which vary with the size of the sample and the percentage figure concerned. For all percentage[footnote 2] results, subgroup differences have been highlighted only where statistically significant (at the 95% level of confidence).[footnote 3] This includes comparison by size, sector, and previous years. By extension, where we do not comment on differences across years, for example in line charts, this is specifically because they are not statistically significant differences. There is a further guide to statistical reliability at the end of this release.
As noted throughout the report, the survey questionnaire included both ‘prompted’ and ‘unprompted’ questions. A prompted question is where the respondent is given a list of possible answers and is asked to choose from this list. An unprompted question asks the respondent to answer in their own words. In general, a prompted question is more appropriate where the possible answers are more clearly defined or known in advance, whereas an unprompted question is more exploratory and produces a wider range of answers.
Subgroup definitions and conventions
For businesses, analysis by size splits the population into micro businesses (1 to 9 employees), small businesses (10 to 49 employees), medium businesses (50 to 249 employees) and large businesses (250 employees or more).
For charities, analysis by size is primarily considered in terms of annual income band, specifically looking at the subgroups of high-income charities (with annual incomes of £500,000 or more) and very high-income charities (£5 million or more). Throughout the report we primarily report on High-Income Charities (with annual incomes of £500,000 or more).
Due to the relatively small sample sizes for certain business sectors, these have been grouped with similar sectors for more robust analysis. Business sector groupings referred to across this report, and their respective SIC 2007 sectors, are:
- administration and real estate (L and N)
- agriculture, forestry, and fishing (A)
- construction (F)
- education (P)[footnote 4]
- health, social care, and social work (Q)
- entertainment, service, and membership organisations (R and S)
- finance and insurance (K)
- food and hospitality (I)
- information and communications (J)
- utilities and production (including manufacturing) (B, C, D and E)
- professional, scientific and technical (M)
- retail and wholesale (including vehicle sales and repairs) (G)
- transport and storage (H).
Analysis of organisation cyber security split by geographical region is considered to be out of the scope of this reporting. While we may occasionally provide data specific for UK regions (at International Territorial Level 1), we recommend caution in attributing these differences to actions taken or not taken by that region regional differences may also be attributable to the size and sector profile of the sample in that region.
Where figures in charts do not add to 100%, or to an associated net score, this is due to rounding of percentages or because the questions allow more than one response.
How to interpret the qualitative data
The qualitative findings offer more nuanced insights into the attitudes and behaviours of businesses and charities with regards to cyber security. The findings reported here represent common themes emerging across multiple interviews. Insights and verbatim quotes from individual organisations are used to illustrate findings that emerged more broadly across interviews. However, as with any qualitative findings, these examples are not intended to be statistically representative.
1.6 Acknowledgements
Ipsos UK, DSIT and the Home Office would like to thank all the organisations and individuals who participated in the survey. We would also like to thank the organisations who supported the survey development work, endorsed the fieldwork, and encouraged organisations to participate, including:
- the Association of British Insurers (ABI)
- the Charity Commission for England and Wales
- the Charity Commission for Northern Ireland
- Jisc, a not-for-profit company that provides digital infrastructure, services, and guidance for UK further and higher education institutions
- the Office for National Statistics (ONS)
- the Office of the Scottish Charity Regulator (OSCR)
- TechUK
- UCISA (formerly known as the Universities and Colleges Information Systems Association).
Chapter 2: Awareness and attitudes
This chapter explores:
- prioritisation of cyber security within organisations
- receiving and reacting to information and guidance about cyber security
- qualitative data on how organisations make decisions on cyber security.
2.1 Perceived importance of cyber security
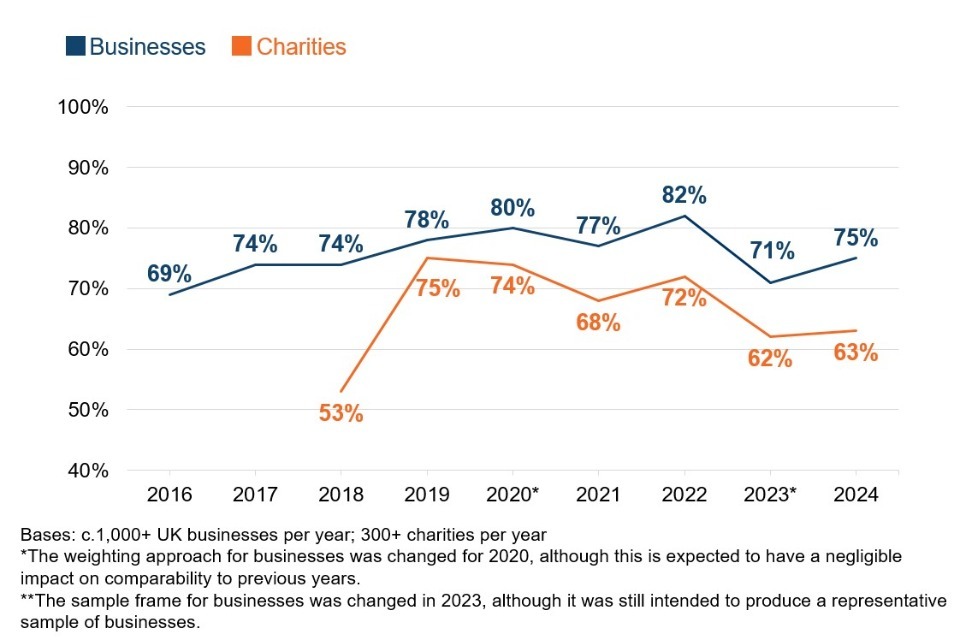
Three-quarters of businesses (75%) and more than six in 10 charities (63%) report that cyber security is a high priority for their senior management (Figure 2.1).
In interpreting this question, note that in smaller organisations, the individuals responsible for cyber security i.e. the ones who completed this survey tend to be senior management, so are answering with regards to their own views. In larger organisations, these individuals may not be part of senior management, so their answers will reflect their own perceptions of their senior management team’s views.
Figure 2.1: Extent to which cyber security is seen as a high or low priority for directors, trustees, and other senior managers
| Organisation Type | % Very High | % Fairly High | % Fairly Low | % Very Low | % Don’t Know | - |
|---|---|---|---|---|---|---|
| Businesses Overall | 35 | 40 | 17 | 7 | 1 | |
| Charities Overall | 29 | 33 | 22 | 12 | 3 |
Bases: 991 UK businesses; 456 charities
Among businesses, there has been a shift in the proportion saying cyber security is a “fairly” high priority (e.g. from 35% of businesses last year, to 40% this year). The proportions of businesses saying it is a very high priority is consistent with last year (36% last year and 35% this year). In 2023, as evidenced by the qualitative interviews, it was felt that cyber security had moved down the agenda among the businesses where it was already seen as a more marginal priority, and among businesses that typically have the fewest resources to deploy. The qualitative findings this year point towards an increased awareness of the risks that are faced when not prioritising cyber security, which could explain the increase in businesses this year rating it as a high priority.
It is more common for larger businesses to say that cyber security is a high priority (93% of medium businesses and 98% of large businesses, vs. 75% overall). The same is true for high-income charities (93% of those with income of £500,000 or more, vs. 63% overall). This continues the pattern seen since 2020, where larger organisations tend to treat cyber security more seriously, and consequently allocate more resources to it.
Businesses in the following sectors tend to treat cyber security as a higher priority than others:
- information and communications (65% a “very” high priority)
- finance and insurance (61% say it is a “very” high priority)
- health, social care and social work (62% a “very” high priority).
Unlike in previous years, where food and hospitality businesses tended to regard cyber security as a lower priority than those in other sectors, they now regard cyber security as a higher priority in line with businesses overall (72% vs. 75% of businesses overall).
By contrast, businesses in the agriculture sector tend to regard cyber security as a lower priority than those in other sectors (59% say it is a high priority, vs. 75% of businesses overall).
Whilst in the 2023 CSBS business in the South East tended to place a higher prioritisation on cyber security than the average UK business (80% said it is a high priority, vs. 71% overall), in 2024 the region with the highest prioritisation on cyber security vs. total businesses is the North West (83% said it is a high priority, vs. 75% overall).
Trends over time
Figures 2.2 shows how the prioritisation score has changed over time. For businesses, the apparent drop in prioritisation of cyber security in 2023 (71% saying it was a high priority) is somewhat reversed with 75% now rating it as a high priority, more in line with previous years of the survey.
The drop among charities rating cyber security as a high priority in 2023 has been maintained in 2024 (it is now 63%, in line with 62% in 2023 and both down from 72% in 2022).
Figure 2.2 Percentage of organisations over time where cyber security is seen as a high priority for directors, trustees, and other senior managers
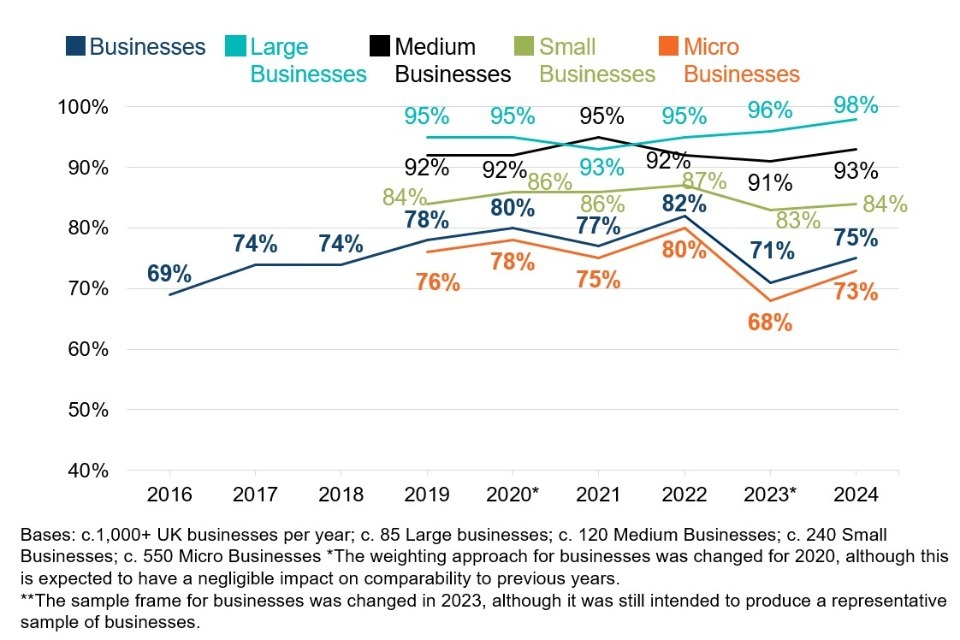
The increase in prioritisation of cyber security is found across all sizes of businesses however, no changes are statistically significant:
- 73% of micro businesses say it is a high priority (vs. 68% in 2023)
- 84% of small businesses say it is a high priority (vs. 83% in 2023)
- 93% of medium businesses say this (vs. 91% in 2023)
- 98% of large businesses say this (vs. 96% in 2023).
Figure 2.3 Percentage of business organisations over time where cyber security is seen as a high priority for directors, trustees, and other senior managers
Qualitative insights on cyber security prioritisation in the current economic environment
The qualitative interviews suggest that, despite economic conditions, many organisations have continued to invest either the same amount or more in cyber security over the last 12 months. There was a sense across the interviews that cyber security was still high on the priority list and, in some cases, has grown in importance.
“We have been resilient; I don’t feel it [current economic condition] has had a huge impact. Cyber security is not going to be de-prioritised.”
Business Systems and IT Project Manager, Medium Sized Business
There were exceptions - a few smaller organisations and charities said their budgets had been cut which meant they had to cut back on their cyber security spend. As a result, these organisations tended to take a reactive approach, where they would look at individual cyber security problems as and when they arose. For example, one medium sized organisation said they are having to rely on internal teams to provide staff training because they don’t have the budget to spend on something more comprehensive:
“Have to be more savvy as an IT team. Using Teams for staff webinars, emails, things we can do for free. Do not have money to purchase more comprehensive training. All budgets have been slashed.”
Head of IT Operations, Medium Sized Business
Another theme emerging from the interviews was the number of cyber attacks had increased because the difficult economic conditions were driving opportunists to take advantage. Often, interviewees who mentioned a rise in cyber-attacks referred to an increase in phishing risks. Because of this, some organisations said they have become more vigilant and have invested more in cyber security as a result.
“I think the [risks] are only growing in that there are more threats and actors out there, and investment is required to keep pace with that.”
Business Systems and IT Project Manager, Medium Sized Business
“We’re acutely aware of the cost of living and people doing whatever they can to financially gain for it there’s surely a rise in opportunistic cyber criminals.”
Operations and IT lead, Medium Income Charity
The qualitative interviews also highlighted that phishing attacks have become more sophisticated because of an advancement in technology. One small business said they had an unsuccessful phishing attempt where the attacker had pretended to be their CEO. Their concern was that while the IT team can quickly identify the signs of phishing attack, the wider team may not be as quick to recognise these.
“We’ve had a couple of unusual ones where they’ve actually spoofed the website, the branding, the person brilliantly. But then the general wording of the email just doesn’t read right”.
Head of IT, Medium Sized Business
“In harder economic conditions, the level of attacks is going up. So, we have to be doubly certain and be extra cautious about social engineering sophisticated attacks.”
Finance Director, High Income Charity
2.2 Involvement of senior management
How often are senior managers updated on cyber security?
Figure 2.4 breaks down how often senior managers get updates on the state of cyber security and any actions being taken. It shows that updates tend to be more frequent in businesses than in charities, continuing a trend from previous years.
As with last year, this question was restricted to medium and large businesses, and to high-income charities. Nearly two-thirds of medium businesses (63%) and almost eight in ten large businesses (78%) update their senior team at least quarterly, as do nearly two-thirds of high-income charities (63%). Four-fifths of businesses (79% of medium businesses and 87% of large businesses) and a similar proportion of charities (86%) say senior managers are updated at least once a year.[footnote 5]
Figure 2.4 How often directors, trustees or other senior managers are given an update on any actions taken around cyber security
| Organisation | % Monthly or more frequently | % Quarterly | % Annually | % Less than once a year | % Each time there is a breach or attack | % Don’t know | - |
|---|---|---|---|---|---|---|---|
| Medium businesses | 40 | 23 | 15 | 3 | 5 | 10 | |
| Large businesses | 55 | 22 | 9 | 1 | 1 | 10 | |
| High-Income charities | 26 | 37 | 23 | 4 | 3 | 4 |
Bases: 264 medium businesses; 170 large businesses; 335 high-income charities
The results for medium and large businesses are similar to last year. However, there has been an increase in the proportion of high-income charities updating senior managers at least quarterly (63% vs. 54% in 2023) and at least annually (86% vs. 80% in 2023). Whilst 29% of high-income charities updated senior managers on a quarterly basis in 2023, 37% are doing so this year, suggesting that among high-income charities senior management discussion of cyber security is now a more common activity.
Board responsibilities
Three in ten businesses (30%) and the same proportion of charities (30%) have board members or trustees taking explicit responsibility for cyber security as part of their job (Figure 2.5). This is across all organisations (i.e. not just those that have a formal management board) – although all registered charities have boards of trustees.
As might be expected, board-level responsibility is much more common in larger businesses, where the management board is likely to be larger. Around two-thirds of large businesses (63%) have a board member responsible for cyber security (vs. 30% of businesses overall). Similarly, low-income charities (those with an income of less than £100,000) were less likely to have a board member responsible for cyber security (28%) than those with an income of more than £100,000 (38%).
Figure 2.5 Percentage of organisations with board members or trustees that have responsibility for cyber security
Bases: 2,000 UK Businesses; 1,060 micro businesses; 506 small businesses; 264 medium businesses; 170 large businesses; 124 information and communications businesses; 142 finance and insurance businesses; 221 professional, scientific and technical businesses; 1,004 charities
Information and communications businesses (60%), finance and insurance businesses (52%) and professional, scientific and technical businesses (42%) are each more likely than average to have board members taking responsibility for cyber security. These sectors, which tend to prioritise cyber security more, were also above average in the 2023, 2022 and 2021 surveys. At the other end of the scale, businesses in agriculture (15%), construction (20%), entertainment, service or membership organisations (22%), and food and hospitality (22%) are among the least likely to have board members assigned this role.
Trends over time
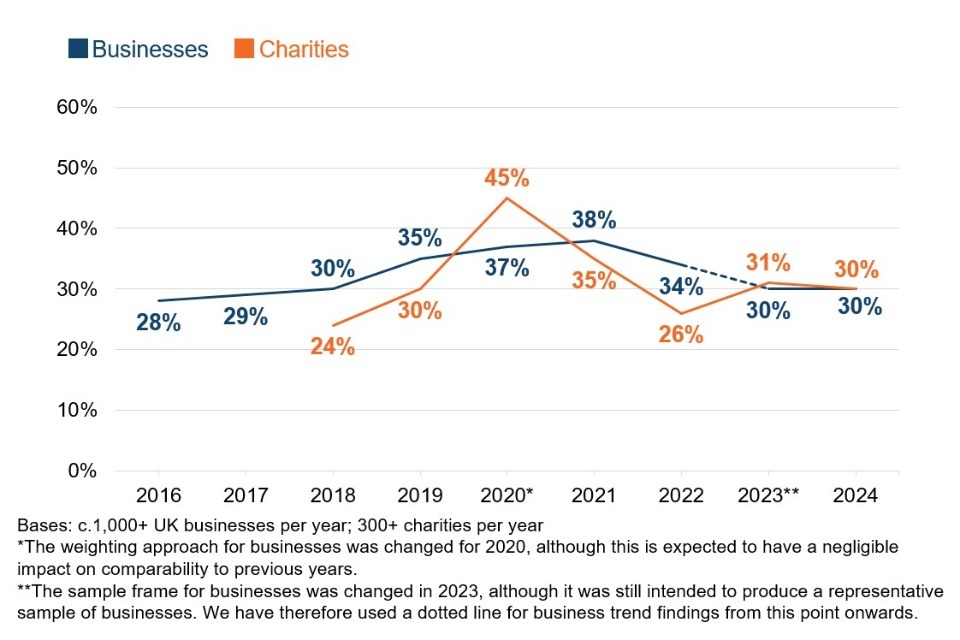
Figure 2.6 shows the trend over time for board members taking on cyber security responsibilities. Among businesses overall, the same proportion had board members taking on cyber security responsibilities in 2024 and 2023 (30%).
Among medium and large businesses, the decline observed amongst those businesses regarding having board members has been reversed and is back to 2021 levels, with a significantly higher proportion of medium (51% vs. 41% in 2023) and large businesses (63% vs. 53% in 2023) now having board members with responsibility for cyber security.
Among charities, this year’s result sustains the increase between 2022 and 2023 (30% this year and 31% in 2023 vs. 26% in 2022).
Figure 2.6 Percentage of organisations over time with board members or trustees with responsibility for cyber security
Qualitative insights on formal versus informal board engagement
As seen in previous years, the qualitative interviews suggest that individuals taking day-to-day responsibility for cyber security highly value engagement from senior board members. This senior engagement helps them secure the buy-in of wider staff (e.g. when cyber security directives came with the backing of senior management), to challenge and improve their own approaches, and to get quicker approval for new measures.
“They are very supportive and understanding, they are very aware of the consequences.”
IT and Digital Services Manager, High Income Charity
“It’s on their radar and they’re astute. They agree with what we suggest most of the time. With spending decisions, it’s largely their job to decide the benefit, but we don’t get much pushback from them.”
Director of Operations, Medium Income Charity
However, there were several recurring reasons to explain why board members did not engage, including a lack of understanding or interest in cyber security relative to the day-to-day operations of the organisation, a lack of training, a lack of time and a perception that their kind of organisation was not facing an especially high risk from cyber-attacks.
“I was supposed to be attending a board meeting to talk about cyber security, but the meeting filled up with lots of things and funnily enough the thing that got pushed off the agenda was the cyber security piece”.
Data and Insight Manager, High Income Charity
The findings suggest board engagement becomes more structured and formal as organisations grow. Some of the larger organisations had regular cyber security reports going to the board, had cyber security as a standing agenda item at board meetings (or at a subcommittee level just below the board), or reviewed cyber security as part of a regular look at their risk register.
By contrast, in small and medium-sized organisations, the approaches for keeping boards informed tended to be more informal. Several of these interviewees mentioned discussing cyber security with senior managers in an ad hoc and reactive manner, i.e. only when specific issues arose. One small charity suggested their board would only need to hear about cyber security when they needed to make spending decisions or an IT upgrade for board approval. Another medium sized architecture firm said they hoped that by obtaining the ISO accreditation, they would be able to implement a more regular reporting system on cyber security. At the moment, they are reporting reactively to specific events.
Often, in these cases, it was clear that boards were placing a great deal of trust either in their internal IT leads, or in their external IT providers they assumed these individuals would flag any serious issues with them. There was a sense among some of the small businesses interviewed that the problem of cyber security had been passed onto external contractors, resulting in senior managers disengaging from the topic and failing to understand the actions being taken, both internally and externally.
2.3 Sources of information
Overall proportion seeking cyber security information or guidance
External sources of information and guidance on cyber security include government sources, third-party cyber security or IT providers, and trade bodies, as well as information found through an internet search or from the media. Around four in ten businesses (41%) and charities (39%) report actively seeking information or guidance on cyber security from outside their organisation in the past year.
For charities this result mirrors the previous iterations of the study in 2023 and 2022, however, for businesses this result represents a significant decrease from 2023 (when 49% of businesses sought information or guidance on cyber security from outside their organisation). There has been a steady decrease in the proportion of businesses seeking external information or guidance since it peaked in 2018 and 2019 (59%), which was seen in the lead up to, and following the implementation of the General Data Protection Regulation (GDPR). For charities, it has remained around the same level since 2018 (when 36% of charities had sought external information or guidance).
As Figure 2.7 illustrates, external information is less often sought in micro businesses. There is a similar pattern among charities only a third (34%) of charities with incomes under £100,000 have sought external information compared to three-quarters (76%) of high-income charities with incomes of £500,000 or more, and 39% of charities overall.
The sectors where businesses are most likely to seek out external information are finance and insurance (61%), admin and real estate (58%) and the professional, scientific and technical sector (54%).
Figure 2.7 Proportion of organisations that have sought external information or guidance in the last 12 months on the cyber security threats faced by their organisation
Bases: 991 UK businesses; 532 micro businesses; 245 small businesses; 129 medium businesses; 85 large businesses; 76 finance and insurance businesses; 106 professional, scientific and technical businesses; 456 charities
Only one in 20 businesses (6%) and one in ten charities (9%) seek information internally within their organisations. This is in line with last year (when it was 8% of businesses and 12% of charities doing so).
As might be expected, internal information seeking is higher within large businesses (17%), which are more likely to employ cyber security specialists. This is higher than in both medium businesses (12%) and high-income charities (11%).
Where do organisations get information and guidance?
As in previous years, the most common individual sources of information and guidance are:
- external cyber security consultants, IT consultants or IT service providers (mentioned by 23% of businesses and 16% of charities)
- any government or public sector source, including government websites, regulators, and other public bodies (3% of businesses and 4% charities)
- general online searching (4% of businesses and 3% of charities).
To note, this question is unprompted for those doing the survey by telephone (the vast majority), while those doing it online look at a prompted response list, meaning that the responses here are top of mind and initially where organisations go to first.
A wide range of individual sources are mentioned, with relatively low proportions for each. For example, just 1% of businesses and 2% of charities mention the National Cyber Security Centre (NCSC) by name, in line with 2023 (2% of businesses and charities mentioned it). This highlights that organisations are not going to official sources for advice and more likely to rely on IT consultants which are more likely to cost more for organisations.
There are a small number of further differences by size, or between businesses and charities that should be noted, particularly around the use of external cyber security consultants, IT consultants or IT service providers:
- Seeking information and guidance from external consultants or providers is most common among medium businesses (45%) higher than among large businesses (35%) and continuing the pattern from previous years. It reflects that these businesses may recognise the need for more cyber security expertise, but have to procure it externally, rather than employing experts internally like many large businesses.
- Among micro businesses, the most common sources are also external security/ IT consultants (21%). The next most common response is online searching (4%).
- Among charities, fewer than one in twenty (3%) mention charity-specific sources such as their relevant Charity Commission.[footnote 6]
Awareness of government guidance, initiatives, and communications
The question around information sources in the previous subsection tends to under-represent actual awareness of government communications on cyber security, as it is asked unprompted for individuals doing the telephone survey. In these kinds of unprompted questions, individuals often do not recall specific things they have seen and heard. We therefore ask organisations, in a later set of prompted questions, whether they have heard of specific initiatives or communications campaigns before. These include:
- the national Cyber Aware communications campaign, which offers tips and advice to protect individuals and small businesses against cyber crime
- the 10 Steps to Cyber Security guidance, which summarises how organisations can protect themselves by managing cyber risk
- the government-endorsed Cyber Essentials scheme, which enables organisations to be certified independently for having implemented technical good-practice in cyber security.
As Figure 2.8 shows, Cyber Aware is the most commonly recognised of these. However, initiatives or campaign awareness, only a minority of businesses and charities have heard of any of them.
Figure 2.8 Percentage of organisations aware of the following government guidance, initiatives, or communication campaigns
| Organisation type | Businesses | Charities |
|---|---|---|
| Cyber Aware campaign | 25% | 30% |
| 10 Steps to Cyber Security guidance | 13% | 18% |
| Cyber Essentials scheme | 12% | 11% |
Bases: 1,009 UK businesses; 548 charities
Medium and large businesses are substantially more aware of these guidance packages:
- 45% of medium businesses and 57% of large businesses have heard of Cyber Aware (vs. 25% overall)
- 37% of medium businesses and 44% of large businesses are aware of the 10 Steps guidance (vs. 13% overall)
- 43% of medium businesses and 59% of large businesses are aware of Cyber Essentials (vs. 12% of all businesses).
In a similar pattern, high-income charities are also substantially more aware of these guidance packages:
- 44% of high-income charities have heard of Cyber Aware (vs. 30% overall)
- 41% of high-income charities are aware of the 10 Steps guidance (vs. 18% overall)
- 38% of high-income charities are aware of Cyber Essentials (vs. 11% of all businesses).
As in previous years, there is little difference between UK nations and regions when it comes to awareness of these different schemes or campaigns.
Trends over time
Figure 2.9 illustrates that business awareness of these schemes and initiatives is close to the previous survey, although there is a pattern of declining awareness of all three initiatives over the last two to three years - with significant declines seen since 2022. Fewer charities also report having heard of Cyber Essentials compared to the previous year (11% this year vs. 15% in 2023).
Figure 2.9 Percentage of businesses over time aware of the following government guidance, initiatives, or communication campaigns
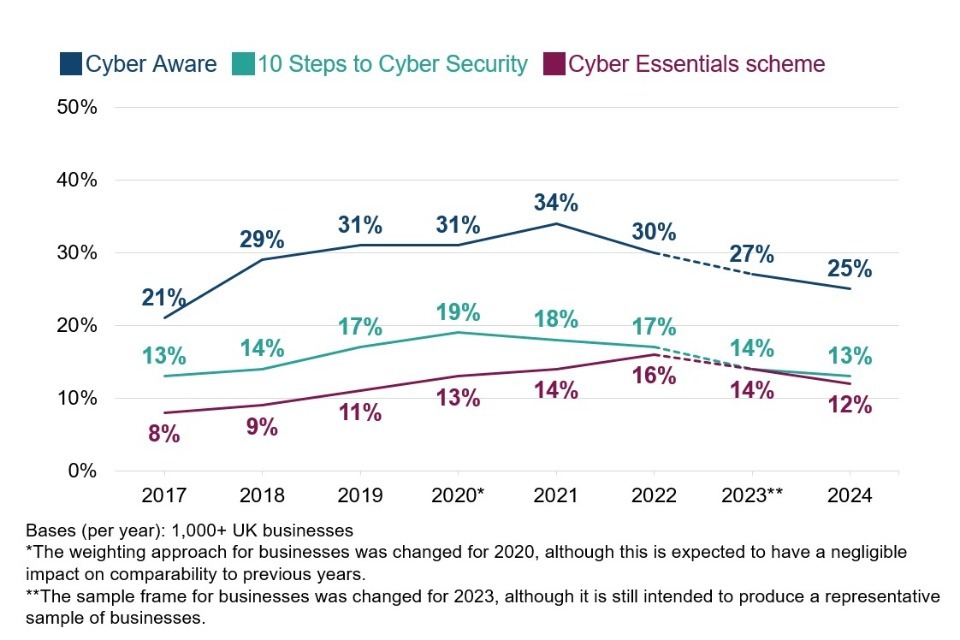
The decline in awareness for Cyber Aware since 2022 is driven by a decline among Micro and Small business. There was a significant decline in awareness for Cyber Aware among Micro businesses since 2021 from 34% to 24% in 2024 and a similar, and significant, decline among small business since 2021 from 38% to 28% in 2024. Similarly, the decline in awareness seen for 10 Steps to Cyber Security is driven by a decline Micro and Small business, but to a lesser extent.
Guidance targeted at specific types of organisations
Since 2020, the survey has asked about NCSC guidance that is directed to specific sizes of business or towards charities. This includes:
- the NCSC’s Small Business Guide and Small Charity Guide, which outline more basic steps that these smaller organisations can take to protect themselves
- the NCSC’s Board Toolkit, which helps management boards to understand their obligations, and to discuss cyber security with the technical experts in their organisation.
Figure 2.10 shows that around one in eight micro and small businesses (12%) have heard of the Small Business Guide. This is similar between micro businesses (11%) and small businesses (13%), which was also the pattern in previous years. Whilst this does not represent a significant drop from last year in awareness among micro and small businesses (15% in 2023), it does point towards steadily declining awareness of the small business guide over the last three years.
Around one in seven charities (14%) have heard of the Small Charity Guide. This result for charities overall has been relatively consistent across years. However, as Figure 2.9 shows, the result for high-income charities increased last year, with more than a third of these charities (36%) aware of the Small Charity Guide. It is also important to note the increase seen among mid-income level charities seeing an increase this year in awareness of the Small Charity Guide.
Figure 2.10 Percentage of businesses and charities over time aware of the Small Business Guide and Small Charity Guide
The Board Toolkit was specifically explored with medium and large businesses in the survey, as well as high-income charities (from the 2021 study onwards). Among medium and large businesses, as Figure 2.11 shows, awareness of the Toolkit has been on the rise, particularly amongst large businesses, since it was first published in 2020. However, the majority of medium and large businesses and high-income charities remain unaware of it.
Figure 2.11 Percentage of medium and large businesses, and charities over time aware of the Board Toolkit
Broadly, these findings suggest that larger organisations are increasing their engagement with cyber security, and any stagnation (e.g. drops in awareness of the Cyber Aware campaign) is more localised among micro and small businesses.
Impact of government information and guidance
A total of 39% of businesses and 44% of charities recall seeing, when prompted, at least one of the government communications or guidance covered in the previous section. This is consistent with 2023. The survey then asks a random sub-sample of these organisations an unprompted question about the changes they have made to their cyber security measures as a result of what they have seen. Just under half of the selected businesses and charities (43% and 44% respectively) report making at least one change. The figure for businesses making changes has decreased since 2023 (when it was 54%).
Large businesses are significantly more likely to have acted on seeing government initiatives or campaigns (60%, vs 44% of all businesses made at least one change). Around six in ten high-income charities report having done so on seeing this guidance (63%, vs. 44% of charities overall made at least one change).
In terms of the specific changes made, there are a wide variety of unprompted responses given. No single response appears that frequently. The most notable changes are:
- 25% of businesses and 29% of charities which recall seeing these government communications report making changes of a technical nature (e.g. to firewalls, malware protections, user access or monitoring)
- 13% of businesses and 14% of charities have made governance-related changes (e.g. increased spending, or updated policies or documentation)
- 18% of businesses and 15% of charities say they have made changes regarding staffing (e.g. employing new cyber security staff), outsourcing or training.
The top unprompted individual response categories are:
- changing or updating firewalls or system configurations (10% of businesses and 8% of charities)
- staff training and communications (8% and 11%)
- changing or updating antivirus or antimalware software (7% and 4%)
- outsourced cyber security/hired external provider (8% and 2%).
Chapter 3: Approaches to cyber security
This chapter looks at the various ways in which organisations are dealing with cyber security.
This covers topics such as:
- risk management (including supplier risks)
- reporting cyber risks
- cyber insurance
- technical controls
- training and awareness raising
- staffing and outsourcing
- governance approaches and policies.
We then explore the extent to which organisations are meeting the requirements set out in government-endorsed Cyber Essentials scheme and the government’s 10 Steps to Cyber Security guidance.
3.1 Identifying, managing, and minimising cyber risks
Actions taken to identify risks
Organisations can take a range of actions to identify cyber security risks, including monitoring, risk assessment, audits, and testing. They are not necessarily expected to be doing all these things the appropriate level of action depends on their own risk profiles.
Figure 3.1 shows the six actions covered by the survey. Deploying security monitoring tools and undertaking risk assessments continue to be the most common actions undertaken by both businesses and charities - although businesses are significantly more likely to be using monitoring tools than charities (33% vs. 23%).
Figure 3.1: Percentage of organisations that have carried out the following activities to identify cyber security risks in the last 12 months
| Organisation type | Businesses | Charities |
|---|---|---|
| Any of the listed activities | 51% | 40% |
| Used specific tools designed for security monitoring | 33% | 23% |
| Risk assessment covering cyber security risks | 31% | 26% |
| Tested staff (e.g. with mock phishing exercises) | 18% | 14% |
| Carried out a cyber security vulnerability audit | 17% | 12% |
| Penetration testing | 11% | 8% |
| Invested in threat intelligence | 10% | 6% |
Bases: 2,000 UK businesses; 1,004 charities
Each one of these actions is more common in larger organisations. Over eight in ten medium businesses (83%), nine in ten large businesses (92%) and over eight in ten high-income charities (86%) have carried out at least one of the listed activities. As specific examples:
- 63% of medium businesses and 71% of large businesses have used security monitoring tools
- similarly, 63% and 72% respectively have undertaken cyber security-related risk assessments.
Among these subgroups, in line with the wider business and charity populations, investing in threat intelligence remains the least common activity. This is undertaken by around four in ten (42%) of large businesses, while every other activity is carried out by between 60-70% of large businesses.
How organisations undertake audits and implement their findings
Among the 17% of businesses that undertake cyber security vulnerability audits, a third only undertake internal audits (31%), a slightly larger proportion only have external audits (41%) and a fifth (21%) carry out both.
The way that businesses undertake audits continues to be strongly linked to size:
- micro, small and medium businesses are most likely to solely use external contractors to undertake audits (42% of micro businesses, 41% of small businesses, and 35% of medium businesses)
- large businesses, likely having greater financial and personnel capacity, are more likely to state that audits have been undertaken both internally and externally (57%).
A similar proportion of charities have carried out cyber security vulnerability audits (12%, vs. 17% of businesses). The charities undertaking audits are, contrary to the average business, most likely to solely use internal staff for this (43%). They are less likely to do so via both internal and external contractors (28%), or just externally (20%).
Reviewing supplier risks
Suppliers can pose various risks to an organisation’s cyber security, for example:
- third-party access to an organisation’s systems
- suppliers storing the personal data or intellectual property of a client organisation
- phishing attacks, viruses or other malware originating from suppliers.
Despite this, relatively few businesses or charities are taking steps to formally review the risks posed by their immediate suppliers and wider supply chain. Just over one in ten businesses say they review the risks posed by their immediate suppliers (11%) and under one in ten are looking at their wider supply chain (6%). Among charities, the respective figures are slightly lower (9% look at their immediate suppliers and 4% at their wider supply chain).
As Figure 3.2 shows, the overall figures mask the wide variation by size and type of organisation. Possibly reflecting a more complex supply chain, over a quarter of medium businesses (28%) and nearly half of large businesses (48%) review the cyber security risks posed by their immediate suppliers, in comparison to 9% of micro business and 18% of small businesses. It is still relatively rare for larger businesses to review their wider supply chain (15% and 23% respectively do so).
Among charities, over a third of high-income charities have reviewed immediate supplier risks (36%, vs. 9% overall). However, only 15% of these high-income charities have reviewed their wider supply chains.
Figure 3.2: Percentage of organisations that have carried out work to formally review the potential cyber security risks presented by the following groups of suppliers
| Organisation type | Their immediate suppliers | Their wider supply chain |
|---|---|---|
| Businesses overall | 11% | 6% |
| Micro businesses | 9% | 5% |
| Small businesses | 18% | 8% |
| Medium businesses | 28% | 15% |
| Large businesses | 48% | 23% |
| Charities overall | 9% | 4% |
Bases: 2,000 UK businesses; 1,058 micro businesses; 504 small businesses; 264 medium businesses; 170 large businesses; 1,004 charities
Trends over time
This question has been asked since the 2020 study. As Figure 3.3 shows, among large businesses specifically, the proportions saying they review both their immediate supplier and their wider supply chain risks have decreased since last year, when they reached their peak proportions. For businesses, this figure is still higher than in 2021. However, the chart shows no clear longer-term trend for businesses or charities.
Figure 3.3: Percentage of large businesses over time that have carried out work to formally review the potential cyber security risks presented by the following groups of suppliers
Qualitative insights on broad supply chain risks
The qualitative interviews suggest that organisations have an increasing awareness of the cyber security risks posed by supply chains. Despite this, organisations, particularly at the smaller end, tend to have limited formal procedure in place to manage cyber risks from wider supply chains. Some organisations recognised that there were supply chain risks but acknowledged they have not yet done the work to fully protect themselves. For instance, one high-income charity mentioned that they are working on bringing in a more formalised cyber security approach to suppliers.
“A third-party liaison is coming in very soon to think specifically about this [supply chain risks] we want to be in a place where we have to give explicit permission to people to access our internal software and systems.”
Director of Operations, High Income Charity
At the more sophisticated end, organisations dealt with supplier risks in a variety of ways. Examples included contractual arrangements, supplier questionnaires, suppliers having to attain external accreditations (e.g. ISO 27001), regular meetings with key suppliers, adding supplier risks to risk registers, and logging of data flows with suppliers on data protection registers. At the other end of the scale, there were a small number of examples of more informal supply chain cyber risk management, including emailing suppliers ad hoc to ask what they have in place. One high income charity said they would not discuss much, other than sharing a data protection contract with the supplier to sign.
“We have data protection contracts but aside from that, not much”
Finance Director, High Income Charity
The ongoing monitoring of suppliers, post-procurement, appeared to be less common. This was often put down to a lack of formal processes, and conversations about cyber security only happening at the start of the contract. Many organisations felt they simply had to trust suppliers to comply with contracts, and that it was difficult to extract further information if suppliers or partners were not forthcoming.
“There is a reliance on them informing us if they have an attack.”
Operations Executive, Small Business
“We have no formalised supply chain risk assessment. But we have a risk management framework around onboarding new providers.”
Cyber and Information Security Manager, Small Business
Regardless of the type of supplier, there was a sense that conversations about cyber security tended to happen at the beginning of the contract. Some organisations felt it would be awkward to start having discussions about cyber security with suppliers who they have worked with for many years. Other organisations didn’t feel that it was necessary to have regular conversations with their supplier because the contract should ensure they will stick to their word.
“We have these longstanding relationships; we know them, and they know what their permission levels are… no one individual can make devastating changes to our internal systems”
Director of Operations, Medium Income Charity
“The primary communication would be onboarding process relating to the technical things. For example, ensuring they have the right accreditation, and asking right questions to make sure that they are both aligned. The contract promises to provide the service we require.”
Cyber and Information Security Manager, Small Business
Qualitative insights on Digital Service Providers (DSPs)
The qualitative interviews also looked at perceptions of the risks posed by Digital Service Providers (DSPs), such as cloud service providers. Organisations tend to have a broad understanding of who their DSPs are and how essential they are for their work. However, when organisations were asked about the reasons for choosing a certain supplier, and the levels of risks associated with them, there was a sense that cyber security was not the priority.
Among the interviewees that did discuss the topic, this covered a wide range of DSPs, including general IT service providers (including hardware and software maintenance), cloud storage providers, network monitoring, threat identification, and training providers.
Cyber security was not commonly raised as a consideration when choosing a DSP. Instead, the focus centred more on track record and cost. Some organisations said that the DSPs were chosen a number of years ago, often when cyber security risks were not as prominent as they are currently.
“I inherited the DPS’s from my predecessor, so I’m in too deep to move. Doubt Cyber Security was involved when they were engaged initially.”
Director, Small Business
“Choosing the DSP was way before my time. Cyber security not originally discussed with them (5 years ago), but it is now.”
Operations Executive, Small Business
There was often an assumption that the DSP would be responsible for the risks and management of cyber security and would, at a minimum, be keeping back-ups in case of any data loss or disruption. As such, there was a great deal of trust placed in the DSPs that organisations had chosen, especially if they were household name companies like Microsoft or Google. There was an acknowledgement that DSPs took on a high level of responsibility.
“Haven’t thought about [the risks] really. But not a big threat I would say. They seem very good and professional and always have an answer. They’ve always struck me as well covered in that regard and if I’ve asked questions they’ve always answered well.”
Business Manager, Medium Income Charity
“We do not really worry about it. Like I said, Microsoft is a huge renowned DSP so we are aware that data breaches would be slim to none. We have never had to reach them before so there is not much to tell you.”
Senior Specialist IT, Medium Sized Business
3.2 Cyber security strategies
As Figure 3.4 shows, large businesses are more likely to have a formal cyber security strategy in place - that is, a document underpinning all policies and processes relating to cyber security.
There is a significant increase among medium businesses with respect to having a formal cyber security strategy in place (rising from 49% to 58%). Likewise, the proportion of charities that have a formal cyber security strategy in place has risen from a third (36%) last year to roughly half (47%) this year.
Figure 3.4 Organisations that have a formal cyber security strategy
Bases: 264 medium businesses; 170 large businesses; 335 high-income charities
Among the larger organisations that do have a cyber security strategy in place, around eight in ten of this business (80%) and three-quarters of charities (74%) report that this has been reviewed by senior executives or trustees within the last 12 months.
3.3 Insurance against cyber security breaches
Which organisations are insured?
Four in ten businesses (43%) and a third of charities (34%) report being insured against cyber security risks in some way. In most cases, as Figure 3.5 shows, cyber security insurance is an addition to a wider insurance policy only 8% of businesses and 5% of charities have a specific cyber security insurance policy. Larger businesses (25% of medium businesses and 26% of large businesses) are more likely to have a specific policy in place.
Like previous years, medium businesses are the most likely to have some form of cyber insurance (62%, vs. 54% of large businesses and 41% of micro or 49% of small businesses). This could be because medium businesses are more likely to be able to afford insurance than smaller businesses but may not have the skills or tools to be able to address all cyber security risks internally like larger businesses.
It is worth noting the high level of uncertainty that remains, in line with previous years, at this question. One-fifth of business (19%) and charities (18%) do not know if their employer has any form of cyber security insurance, despite the survey being carried out with the individual identified by the organisation as having most responsibility for cyber security.
Figure 3.5 Percentage of organisations that have the following types of insurance against cyber security risks
| Organisation type | Cyber security cover as part of a wider insurance policy | A specific cyber security insurance policy |
|---|---|---|
| Businesses overall | 35% | 8% |
| Micro businesses | 35% | 6% |
| Small businesses | 38% | 11% |
| Medium businesses | 38% | 25% |
| Large businesses | 29% | 26% |
| Charities overall | 29% | 5% |
Bases: 991 UK Businesses; 532 micro businesses; 245 small businesses; 129 medium business; 85 large businesses; 456 charities
Trends over time
Compared to the 2023 survey, the proportion of businesses with some form of insurance has increased from 37% to 43%, an equal proportion to that in the 2022 survey (also 43%). The increase is driven by higher inclusion of cyber security cover as part of a wider insurance policy amongst micro businesses (up from 29% to 35%) and small businesses (up from 33% to 38%).
The proportion of charities with some form of insurance has remained consistent when compared to the 2023 survey (34% this year, vs. 33% last year).
3.4 Technical cyber security controls
Each year, we ask whether organisations have a range of technical rules and controls in place to help minimise the risk of cyber security breaches. The full list is shown in Figure 3.6. Many of these are basic good practice controls taken from government guidance such as the 10 Steps to Cyber Security or the requirements for Cyber Essentials certification.
A clear majority of businesses and charities have a broad range of basic rules and controls in place. The most frequently deployed rules or controls involve cloud back-ups, updated malware protection, passwords, network firewalls and restricted admin rights, each administered by two-thirds or more of businesses. The least common rules and controls are two-factor authentication (2FA), user monitoring, separated Wi-Fi networks, applying software updates and use of Virtual Private Networks (VPNs). For most rules and controls, businesses are more likely to have them in place than charities (with exact percentages included in Figure 3.6). The two areas where a more substantial number of large businesses do not have technical rules and controls are in backing up data by other means (66%) and only allowing access via organisation-owned devices (71%).
Figure 3.6 Percentage of organisations that have the following rules or controls in place
| Rules or controls in place | Businesses | Charities |
|---|---|---|
| Up-to-date malware protection | 83% | 65% |
| A password policy that ensures that users set strong passwords | 72% | 54% |
| Backing up data securely via a cloud service | 71% | 54% |
| Restricting IT admin and access rights to specific users | 73% | 65% |
| Firewalls that cover the entire IT network, as well as individual devices | 75% | 48% |
| Security controls on organisation-owned devices (e.g. laptops) | 58% | 44% |
| Only allowing access via organisation-owned devices | 61% | 34% |
| An agreed process for staff to follow with fraudulent emails or websites | 54% | 35% |
| Rules for storing and moving personal data securely | 48% | 47% |
| Backing up data securely via other means | 55% | 41% |
| Any Two-Factor Authentication (2FA) for networks/applications | 39% | 33% |
| Separate Wi-Fi networks for staff and visitors | 35% | 25% |
| Monitoring of user activity | 30% | 29% |
| A virtual private network, or VPN, for staff connecting remotely | 32% | 18% |
| A policy to apply software security updates within 14 days | 34% | 20% |
Bases: 2,000 UK Businesses, 1,004 charities
Medium and large businesses are more likely than average to have each of these technical rules and controls in place. Specifically, across large businesses, around nine in ten have adopted each of the following:
- restricting admin rights (96%)
- password policies (96%)
- security controls on their devices (93%)
- up-to-date malware protection (93%)
- network firewalls (93%)
- separate Wi-Fi for staff and visitors (93%).
- data backups, either via the cloud or other means (92%)
- VPNs (88%)
Trends over time
Compared to 2023, the deployment of various controls and procedures has risen slightly among businesses:
- using up-to-date malware protection (up from 76% to 83% among businesses, similar to the 83% of businesses in the 2022 survey)
- restricting admin rights (up from 67% to 73%)
- network firewalls (up from 66% to 75%)
- agreed processes for phishing emails (up from 48% to 54%).
In the previous three years of the survey (2021, 2022, 2023), some of these areas had seen consistent declines among businesses, including password policies (79% in 2021; 75% in 2022; 70% in 2023; and 72% in 2024), network firewalls (78% in 2021; 74% in 2022; 66% in 2023; and 75% in 2024) and restricted admin rights (75% in 2021; 72% in 2022; 67% in 2023; and 73% in 2024). However, the increases seen this year represent a partial reversal of this trend.
It is important to note that these trends (the decline from 2021-2023 and the partial reversal in 2024) mainly reflect shifts in micro businesses and, to a lesser extent, small and medium businesses over time. On each of the technical controls in Figure 3.6, large businesses remain in line with where they were in 2023. The proportion of charities who deploy these various controls and procedures has also remained relatively consistent since 2023.
3.5 Staff training and awareness raising
This survey does not explore cyber security skills and training in detail, given that there is another annual government study dealing with this topic - the cyber security skills series. Nevertheless, staff training is an important aspect of the 10 Steps to Cyber Security guidance, so we continue to estimate the proportion of organisations that have undertaken training or awareness raising activities around cyber security in the past year.
Our results (Figure 3.7) show that in the last 12 months, around a fifth of businesses (18%) and charities (18%) have provided some form of staff training.Half of all medium businesses (52%), four-fifths of large businesses (74% which is a decline vs 2023 of 77%) and half (52%) of high-income charities provided this training.
Figure 3.7 Percentage of organisations that have had training or awareness raising sessions on cyber security in the last 12 months
| Businesses overall | 18% |
| Micro businesses | 14% |
| Small businesses | 30% |
| Medium businesses | 52% |
| Large businesses | 74% |
| Charities overall | 18% |
Bases: 2,000 UK businesses; 1,058 micro businesses; 504 small businesses; 264 medium businesses; 170 large businesses; 1,004 charities
Trends over time
Since the 2021 survey, the proportion of medium and large businesses running training has consistently increased. For example, it was 47% for large businesses in 2021, compared to 61% in 2022, 77% in 2023, and 80% in 2024. The result for high-income charities has also risen (from 35% in 2021, to 45% in 2022 49% in 2023, and 52% in 2024).
3.6 Responsibility for cyber security
The job titles of those completing the survey, who are identified by their organisation as being the individual most responsible for cyber security, provide an insight as to the likely seniority and influence of these individuals.
These results do not necessarily show the definitive proportion of organisations that have, for example, a Chief Information Officer (CIO) or Chief Information Security Officer (CISO). In organisations with these functions, we may have been directed to another senior individual with more day-to-day responsibility for cyber security, such as a senior IT colleague.
Generally, the larger the organisation, the more specific the job title of the individual covering cyber security matters. The findings outlined here are all in line with the previous year (2023), when this was first asked:
- In micro businesses, it is most likely to be a Chief Executive (23%), business owner (17%), or another senior management role (15%). Very few micro businesses have someone specifically in an IT-role looking after cyber security matters (2%).
- In small businesses, the most common job roles were general office managers (28%), Chief Executives (13%) or those with another (unspecified) senior management role (16%).
- In half of large businesses, it is either the IT director (25%) or an IT manager, technician or administrator (22%), looking after cyber security. The respective figures for medium sized businesses are 14% and 17%.
- In three in ten charities (32%), a trustee performs this function. Within high-income charities (with an income of £500,000 or more), 12% of interviews were completed by an IT Director, similar to the proportion among medium businesses.
3.7 Outsourcing of cyber security functions
Four in ten businesses (43%) and a quarter of charities (23%) have an external cyber security provider. These overall figures are broadly consistent with those recorded in the previous three years of the survey.
As Figure 3.8 shows, outsourcing of cyber security is substantially higher among small and medium businesses, as opposed to micro and large businesses. This pattern has also been evidenced in previous years. It is possible that large businesses are relying more on internal cyber security expertise than on outsourcing, while small and medium businesses perhaps cannot afford to recruit specialists to the same extent.
Figure 3.8 Percentage of organisations that have an external cyber security provider
| Businesses overall | 43% |
| Micro businesses | 39% |
| Small businesses | 56% |
| Medium businesses | 66% |
| Large businesses | 40% |
| Charities overall | 23% |
Bases: 2,000 UK businesses; 1,060 micro businesses; 506 small businesses; 264 medium businesses; 170 large businesses; 1,004 charities
3.8 Cyber security policies and other documentation
Do organisations formally document their approaches?
A third of businesses (33%) and charities (32%) report having formal cyber security policies in place. To note, these may be part of a wider policy within the organisation, such as the IT policy. A similar proportion of businesses (31%), and a smaller proportion of charities (22%) have a business continuity plan that covers cyber security.
Figure 3.9 shows strong differences by size, with the majority of medium and large businesses having each form of documentation.
Figure 3.9 Percentage of organisations that have the following kinds of documentation
| Organisation type | A formal policy or policies covering cyber security risks | A business continuity plan that covers cyber security |
|---|---|---|
| Businesses overall | 33% | 31% |
| Micro businesses | 28% | 27% |
| Small businesses | 51% | 44% |
| Medium businesses | 77% | 67% |
| Large businesses | 85% | 77% |
| Charities overall | 32% | 22% |
Bases: 2,000 UK businesses; 1,058 micro businesses; 504 small businesses; 264 medium businesses; 170 large businesses; 1,004 charities
When were policies last reviewed?
Of the 33% of businesses and 32% of charities that have cyber security policies in place, over four in ten (44%) of those businesses and a similar proportion (43%) of those charities reviewed these policies within the last six months (Figure 3.10). For businesses, the figure is similar to the last three years, however, is still significantly lower than 2020 when 52% said they had reviewed policies or documentation in the past six months.
Figure 3.10: When organisations last created, updated, or reviewed their cyber security policies or documentation
| Organisation type | % in last 3 months | % 3 to under 6 months ago | % 6 to under 12 months ago | % 12 to under 24 months ago | % 24 months ago or earlier | % don’t know | - |
|---|---|---|---|---|---|---|---|
| Businesses overall | 28 | 16 | 32 | 13 | 2 | 9 | |
| Charities overall | 23 | 20 | 30 | 13 | 5 | 10 |
Bases: 658 businesses with cyber security policies; 329 charities
What is covered in cyber security policies?
As Figure 3.11 indicates, cyber security policies tend to cover a range of topics. The aspects most often covered are around data storage and the appropriate use of the organisation’s IT devices. The use of personal devices and Digital Service Providers (DSPs) were less commonly mentioned.
Businesses are significantly more likely than charities to cover the use of cloud computing in their cyber security policies (63% vs. 54%); use of network provided, and digital services provided (both at 60% vs. 51%).
Figure 3.11 Percentage of organisations with cyber security policies that have the following features in their cyber security policies
| Features in organisations cyber security policies | Businesses | Charities |
|---|---|---|
| How data is supposed to be stored | 84% | 83% |
| What staff are permitted to do on organisation’s IT devices | 80% | 77% |
| Remote or mobile working | 68% | 71% |
| Use of cloud computing | 66% | 54% |
| Use of network-connected devices | 60% | 51% |
| What can be stored on removable devices (e.g. USB sticks) | 63% | 60% |
| Use of personally-owned devices for business activities | 55% | 66% |
| Digital Service Providers such as cloud services | 60% | 51% |
Bases: 938 businesses with cyber security policies; 472 charities
In 2023, the proportion of businesses that covered cloud computing in their cyber security policies rose to 63% after a decline in the previous year (to 56%). The figure for 2024 has remained consistent, at 66%.
3.9 Cyber accreditations and government initiatives
This section looks at both government and external cyber accreditations and initiatives. It looks at which organisations adhere to specific accreditations. It then combines some of the results regarding individual actions and controls covered earlier in this chapter, to provide estimates of how many businesses and charities are fulfilling the range of requirements laid out in two government initiatives - Cyber Essentials and the 10 Steps to Cyber Security.
Cyber Essentials
The government-endorsed Cyber Essentials scheme enables organisations to be independently certified for having implemented a good-practice standard in cyber security, which protects against the most common cyber-attacks. Specifically, it requires them to enact basic technical controls across five areas:
- boundary firewalls and internet gateways
- secure configurations
- user access controls
- malware protection
- patch management (i.e. applying software updates).
Chapter 2 highlighted that overall, there is low awareness of Cyber Essentials among businesses (12%) and charities (11%). Despite this lack of awareness, a slightly higher proportion of businesses and charities do actually have technical controls in these five areas.
The survey asks questions which correspond to the five areas. In total, 22% of businesses and 14% of charities report having technical controls in all five areas.[footnote 7] As might be expected, this is considerably higher for medium businesses (53%) and large businesses (68%).
The overall proportions are still lower than in 2021, when 29% of businesses and 20% of charities had technical controls in place in all five Cyber Essentials areas. However, the result for medium businesses specifically has, risen from 46% in 2022 and 43% in 2023 to 53% in 2024.
We also ask organisations if they recall adhering to either the Cyber Essentials or Cyber Essentials Plus standards. Both require organisations to implement cyber security measures in the same five areas, but the latter includes an external technical assessment. This year’s results show that 3% of businesses and charities report adhering to Cyber Essentials (vs. 5% of businesses and 4% of charities respectively in 2023, though this change is not statistically significant). Just 1% of businesses and charities say they adhere to the standard. Among large businesses, this rises to 28% for Cyber Essentials and 15% for Cyber Essentials Plus. This continues to indicate that some organisations - especially medium and large businesses - are potentially already meeting the Cyber Essentials standard, but not seeking certification.
Qualitative insights on the motivations behind seeking accreditation
The qualitative interviews touched on the rationale for organisations seeking accreditation, among organisations that had done so. Across interviews, organisations spoke about Cyber Essentials and ISO 27001 in the main. We also attempted to explore the NCSC’s Cyber Assessment Framework, but only some of the organisations had heard of the name and didn’t know much about it.
Both Cyber Essentials and ISO 27001 were viewed positively. The latter was considered as more internationally recognised than the former, but it was also considered difficult to obtain. Some organisations felt that Cyber Essentials was more of a tick-box exercise, covering the basics, rather than being particularly robust:
“Cyber Essentials is a fairly low bar and has set it as a minimum baseline to achieve acceptable standards of security and a tolerable level of risk. Then we will go for Plus.”
Data and Insight Manager, High Income Charity
The overall reasons for seeking accreditation reflected themes that have been raised in previous years of this study:
- Demand from clients organisations mentioned that they were able to win more business and contracts by obtaining cyber security accreditation.
“Had an account that represented 90% of our turnover at the time. They asked if we were aligned to ISO standards, but we put it off. The requests were coming through over the years and account directors said (sales / revenue) would be limited if we did not get it”.
Head of IT, Medium Sized Business
- Pressure from board members - there was a sense that, when it comes to accreditations, board members tend to get more involved because it helps to win new business but also gives them peace of mind that they are fully compliant. One medium sized charity said they had pressure from board members to obtain Cyber Essentials so that they could carry out necessary staff training.
“Needed for some of the government contracts regarding training and education activities. Our board had actually started mentioning, ‘why haven’t we got Cyber Essentials Accreditation?’, and that led to a conversation with Audit and Risk Committee.”
Head of IT, Medium Sized Business
- Enforcing a change in the staff culture - one charity suggested their adoption of Cyber Essentials Plus allowed them to identify the weaknesses in their system. It also gave them the authority to enforce rules and policies so that employees will work within minimum cyber security standards.
- For peace of mind for stakeholders - one charity said that working towards Cyber Essentials is required to uphold their contract with funders.
“External pressure to uphold contracts of funders. It’s listed in our contract as the basic that we need to have.”
Business Manager, Medium Income Charity
10 Steps to Cyber Security
The 10 Steps to Cyber Security is government guidance that breaks down the task of managing cyber risk across an organisation into 10 key components. It is intended to provide a broad set of areas organisations should address to have a good corporate approach to cyber security. It is not, however, an expectation that organisations fully apply all the 10 Steps - this will depend on each organisation’s ways of working.
These steps have been mapped to several specific questions in the survey (in Table 3.1), bringing together findings that have been individually covered across the rest of this chapter. This is not a perfect mapping as some of the steps are overlapping and require organisations to undertake action in the same areas. However, it does provide an indication of whether organisations have taken relevant actions on each Step. This is regardless of whether they are actually aware of the 10 Steps guidance (covered earlier in Section 2.3).
As a remapping exercise took place in 2023, results for the 10 Steps to Cyber Security is only comparable to 2023.
The 10 Steps are actions that all organisations can take, but the guidance is specifically aimed at medium to large organisations. As such, we have also pulled out the results for medium and large businesses in Table 3.1. Any significant changes from last year have been noted in the table. For four of the 10 steps the proportion of businesses overall that are doing them has increased, the same is true for three of the measures for charities.
Table 3.1: Percentage of organisations undertaking key actions in each of the 10 Steps areas
| Step description | Businesses | Medium businesses | Large businesses | Charities |
| 1 Risk management - organisations have undertaken a cyber security risk assessment | 31% | 63% (vs. 51% 2023) | 74% (vs. 63% 2023) | 26% |
| 2 Engagement and training - organisations have carried out staff training or awareness raising activities | 18% | 52% | 74% | 18% |
| 3 Asset management - organisations have a list of critical assets | 27% | 61% (vs. 52% 2023) | 65% | 28% |
| 4 Architecture and configuration - organisations have at least three of the following technical rules or controls: up-to-date malware protection, network firewalls, restricted IT admin and access rights, security controls on organisation-owned devices, only allowing access via organisation-owned devices, separate Wi-Fi networks for staff and visitors, specific rules for personal data storage and transfer, or a VPN | 81% (vs. 75% in 2023) | 98% (vs. 94% 2023) | 100% (vs. 96% 2023) | 58% |
| 5 Vulnerability management - organisations have policy to apply software security updates within 14 days | 34% (vs. 31% in 2023) | 59% (vs. 49% 2023) | 72% | 20% |
| 6 Identity and access management - organisations have any requirement for two-factor authentication when people access the organisation’s network, or for applications they use | 39% | 73% | 76% | 33% (vs. 27% in 2023) |
| 7 Data security - organisations have cloud backups or other kinds of backups | 88% (vs. 83% in 2023) | 96% | 92% (vs. 97% in 2023) | 72% (vs. 67% in 2023) |
| 8 Logging and monitoring - organisations fulfil at least one of the following criteria: using specific tools designed for security monitoring, such as Intrusion Detection Systems, or doing any monitoring of user activity | 48% | 80% | 91% | 40% |
| 9 Incident management - organisations have a formal incident response plan, or at least three of the following: written guidance on who to notify of breaches, roles or responsibilities assigned to specific individuals during or after an incident, external communications and public engagement plans, guidance around when to report incidents externally | 28% (vs. 25% in 2023) | 65% (vs. 52% 2023) | 82% (vs. 71% in 2023) | 27% (vs. 22% in 2023) |
| 10 Supply chain security - organisations monitor risks from suppliers or their wider supply chain | 12% | 29% | 46% | 10% |
The vast majority of businesses (94%) and charities (82%) have undertaken key actions associated with at least one of the 10 Steps. The proportion of businesses undertaking at least one of the 10 Steps has increased since 2023 (91%), whilst charities remain in line with 2023 (79%).
Around two-fifths of businesses (39%) and a third of charities (32%) have taken action on 5 or more of the 10 Steps, as Figure 3.12 shows. This is also much higher in large businesses, of which nine in ten (91%) have progressed at least 5 of these steps and a quarter (27%) of which have taken action in all 10 areas.
Looking at Figure 3.12, supply chain security is the main area for improvement for large organisations.
Figure 3.12 Percentage of organisations that have undertaken action in half or all the 10 Steps guidance areas
| Organisation type | Undertaken 5 or more of the 10 Steps | Undertaken all the 10 Steps |
|---|---|---|
| Businesses overall | 39% | 3% |
| Micro businesses | 34% | 1% |
| Small businesses | 54% | 6% |
| Medium businesses | 80% | 14% |
| Large businesses | 91% | 27% |
| Charities overall | 32% | 3% |
Bases: 2,000 UK businesses; 1,058 micro businesses; 504 small businesses; 264 medium businesses; 170 large businesses; 1,004 charities
Chapter 4: Prevalence and impact of breaches or attacks
This chapter explores the nature, extent and impact of cyber-attacks and other cyber security breaches on organisations over the past year. We also provide broad estimates of the financial cost of these breaches and attacks.
Across these findings, the survey aims to account for all the types of breaches or attacks that organisations might face. This includes accidental breaches, as well as ones perpetrated intentionally. It also includes recorded cyber-attacks that did not necessarily get past an organisation’s defences (but attempted to do so). Furthermore, we isolate and discuss the cases that had a material outcome, such as a loss of money, assets, or data.
It is important to remember the survey only includes the breaches or attacks that organisations were able to identify and willing to report. There are likely to be hidden attacks, and other breaches that go unidentified, so the findings reported here may underestimate the full extent of the prevalence of cyber-attacks and breaches.
To note, there is a separate chapter (Chapter 6) that covers similar statistics specifically on prevalence and financial impact of attacks which meet the definition of cyber crime, as well as the prevalence of fraud that occurred as a result of cyber crime. These are a subset of all cyber security breaches and attacks.
4.1 Note on comparability to previous years
There were some noteworthy changes this year to the question that seeks to capture overall incidence of cyber-attacks and breaches, Q53A. Changes to this question can be summarised as follows:
- The question now explicitly includes text asking the respondent to include events even if the organisation was not impacted by them. This was only implicit in previous years (never said aloud).
- For some of the question codes the word ‘infected’ was replaced with ‘targeted’. For example, ‘Your organisation’s devices being targeted with ransomware’.
- At code 6 on phishing, the text ‘even if they did not engage with these websites or emails’ was added so that it reads ‘phishing attacks, i.e. staff receiving fraudulent emails, or arriving at fraudulent websites even if they did not engage with these emails or websites.
Due to these changes, we would expect to see a change in the numbers. As such, any direct comparisons between 2024 and 2023 it is not possible.
4.2 Identified breaches or attacks
Half of businesses (50%) and around a third of charities (32%) report having experienced any kind of cyber security breach or attack in the last 12 months (Figure 4.1). This accounts for approximately 718,000 businesses and 65,000 registered charities - although these estimates, like all survey results, will be subject to a margin of error (see Appendix A).[footnote 8]
The survey does not have a separate question to ask whether organisations have experienced any type of breach or attack, as this approach would be subject to considerable recall errors. Instead, the above percentages are based on calculating the proportions of businesses and charities that identified one or more of 11 specific types of breaches or attacks (listed in Figure 4.2), as well as an option allowing organisations to state any other type of breach or attack.
Larger businesses are more likely to identify breaches or attacks than smaller ones. High-income charities (66% of those with incomes of £500,000 or more) are significantly more likely to record any breaches or attacks than the average for all charities.
Figure 4.1: Percentage of organisations that have identified breaches or attacks in the last 12 months
| Businesses overall | 50% |
| Micro businesses | 47% |
| Small businesses | 58% |
| Medium businesses | 70% |
| Large businesses | 74% |
| Information or communication | 72% |
| Within utilities or production | 62% |
| Charities overall | 32% |
Bases: 2,000 UK businesses; 1,060 micro businesses; 506 small businesses; 264 medium businesses; 170 large businesses; 124 Information or communication; 156 utilities or production businesses; 1,004 charities
As Figure 4.1 shows, businesses in the information or communication, and utilities or production sectors are more likely than average to have identified breaches or attacks (72% and 62% respectively vs. 50% of businesses overall).
Types of breaches or attacks identified
Figure 4.2 shows the types of breaches and attacks that organisations report having, among those that have identified any in the last 12 months. The most common by far is phishing (84% among businesses and 83% among charities) - defined in the context of this survey as staff receiving fraudulent emails or being directed to fraudulent websites. This is followed, to a much lesser extent, by others impersonating organisations in emails or online (35% among businesses and 37% among charities) and then viruses or other malware (17% among businesses and 14% among charities).
Figure 4.2: Percentage of types of breaches or attacks in the last 12 months, among the organisations that have identified any breaches or attacks
| Types of breaches or attacks | Businesses | Charities |
|---|---|---|
| Phishing attacks, i.e. staff receiving fraudulent emails or arriving at fraudulent websites | 84% | 83% |
| Others impersonating, in emails or online, your organisation or your staff | 35% | 37% |
| Organisation’s devices being targeted with other malware (e.g. viruses or spyware | 17% | 14% |
| Takeovers or attempts to take over your website social media accounts or email accounts | 8% | 6% |
| Hacking or attempted hacking of online bank accounts | 7% | 5% |
| Organisation’s devices being targeted with ransomware | 6% | 3% |
| Denial of service attacks, i.e. attacks that try to slow or take down your website, applications or services | 5% | 5% |
| Unauthorised accessing of files or networks by staff even if accidental | 1% | 4% |
| Unauthorised accessing of files or networks by people outside your organisation (other than staff or students) | 1% | 1% |
| Unauthorised listening into video conferences or instant messaging | 1% | 0% |
| Any other breaches or attacks | 3% | 3% |
Bases: 1,111 businesses that identified a breach or attack in the last 12 months; 459 charities
Among the organisations identifying any breaches or attacks, just under half (46% of these businesses and 45% of these charities) say they have only experienced phishing attacks and no other kinds of breaches or attacks. The proportion of those only experiencing phishing attacks and no other type of attack falls to just 11% of large businesses and 20% of medium businesses. Among organisations identifying any breaches or attacks, medium and large organisations are more likely to report:
- phishing attacks (91% of large businesses and 88% of medium businesses, vs. 84% overall)
- impersonation (80% and 67% respectively, vs. 35% overall)
- malware (40% of large businesses, vs. 17% overall)
- unauthorised access by people within the organisation (14% of large businesses, vs. 1% overall)
- unauthorised access by people outside the organisation (7% of large businesses, vs. 1% overall)
4.3 The breaches or attacks considered most disruptive
Among the organisations that report having had breaches or attacks in the past 12 months, phishing attacks are commonly reported as the most disruptive types of attack that organisations face (by 61% of the businesses and 56% of the charities that identify any breaches or attacks).
Figure 4.3 shows also shows that impersonations are the second most prevalent breach or attack that causes the most disruption.
Figure 4.3 Percentage that report the following types of breaches or attacks as the most disruptive, across all who experienced a breach in the last 12 months
| Types of breaches or attacks | Businesses | Charities |
|---|---|---|
| Phishing attacks, i.e. staff receiving fraudulent emails or arriving at fraudulent websites | 61% | 56% |
| People impersonating, in emails or online, your organisation or your staff | 16% | 22% |
| Takeovers or attempts to take over your website, social media accounts or email accounts | 4% | 4% |
| Your organisation’s devices being targeted with other malware (e.g. viruses or spyware) | 4% | 3% |
| Hacking or attempted hacking of online bank accounts | 3% | 2% |
| Your organisations’ devices being targets with ransomware | 2% | 1% |
| Denial of service attacks, i.e. attaksthat try to slow or take down your website, applications or… | 2% | 2% |
| Unauthorised accessing of files or networks by staff, even if accidental | 0% | 3% |
| Any other types of cyber security breaches or attacks | 1% | 1% |
Bases: 1,111 businesses and 459 charities that identified a breach or attack aside from phishing attack in the last 12 months
Time taken to recover from the most disruptive breach or attack
When considering their most disruptive breach or attack, the vast majority of businesses (92%) and charities (91%) report being able to restore their operations within 24 hours.
Furthermore, almost eight in ten businesses (79%) and charities (77%) say it took ‘no time at all’ to recover, as shown in Figure 4.4.
Figure 4.4 How long it took to get operations back to normal after their most disruptive breach or attack was identified
| Organisation type | % No time at all | % Less than a day | % Less than a week | % Less than a month | % Over a month | % don’t know | - |
|---|---|---|---|---|---|---|---|
| Businesses overall* | 79 | 13 | 5 | 0.5 | 0.5 | 0.5 | |
| Charities overall* | 77 | 14 | 6 | 0.5 | 0.5 | 0.5 |
Bases: 1,028 UK businesses; 428 charities; Unlabelled bars are less than 5%
*Values greater than 0% but too small to be rounded up to 1% are shown as 0.5%.
4.4 Frequency of breaches or attacks
Among those identifying any breaches or attacks in the previous 12 months, over half of businesses (53%) and just under half of charities (45%) say this happens once a month or more often, and a third of businesses (32%) and a fifth of charities (20%) say they experience breaches or attacks at least once a week. The full results are shown in Figure 4.5.
Figure 4.5 How often organisations have experienced breaches or attacks in the last 12 months
| Organisation type | % Only once | % Less than once a month | % Once a month | % Once a week | % Once a day | % Several times a day | % don’t know | - |
|---|---|---|---|---|---|---|---|---|
| Businesses overall* | 20 | 24 | 21 | 18 | 7 | 7 | 0.5 | |
| Charities overall* | 22 | 31 | 26 | 10 | 5 | 5 | 0.5 |
Bases: 1,111 businesses that identified a breach or attack in the last 12 months; 459 charities; Unlabelled bars are less than 5%
*Values greater than 0% but too small to be rounded up to 1% are shown as 0.5%.
4.5 How are businesses affected?
Outcomes of breaches or attacks
Among the 50% of businesses that identify breaches or attacks, just over one in ten (13%) experienced at least one of the negative outcomes listed in Figure 4.6, such as a loss of money or data. The low proportion stating a negative outcome indicates that a large proportion of attacks are unsuccessful. Similarly, among the 32% of charities identifying breaches or attacks, around one in ten (12%) have negative outcomes. Disruption to websites, and the temporary loss of access to files or networks are the most commonly reported outcomes (4% for both). However, as Figure 4.6 indicates, cyber incidents that overcome defences can have a wide range of outcomes.
Figure 4.6 Percentage that had any of the following outcomes, among the organisations that have identified breaches or attacks in the last 12 months
| Outcome | Businesses | Charities |
|---|---|---|
| Any listed outcome | 13% | 12% |
| Website, or online services taken down or made slower | 4% | 4% |
| Temporary loss of access to files or networks | 4% | 4% |
| Money stolen | 3% | 2% |
| Lost access to relied-on third-party services | 2% | 1% |
| Compromised accounts or systems used for illicit purposes | 2% | 2% |
| Money was paid as a ransom | 2% | 2% |
| Software or systems corrupted or damaged | 1% | 2% |
| Personal data altered, destroyed or taken | 1% | 1% |
| Damage to physical devices or equipment | 1% | 2% |
| Permanent loss of files (not personal data) | 1% | 1% |
| Lost or stolen assets, trade secrets or intellectual property | 1% | 1% |
Bases: 1,111 businesses that identified a breach or attack in the last 12 months; 459 charities
These outcomes are all more prevalent among large businesses. Among those that have identified any breaches or attacks, 32% of large businesses have had some sort of negative outcome from these (vs. 13% of businesses overall). Among these large businesses, 9% report compromised accounts or systems used for illicit purposes (vs. 2% overall) and 5% say assets, trade secrets or intellectual property were lost or stolen (vs. 1% overall).
Nature of the impact
Even breaches that do not result in negative financial consequences or data loss can still have an impact on organisations. Almost a quarter of businesses (24%) and two-fifths of charities (41%) that have had any breaches or attacks report being impacted in at least one of the ways noted in Figure 4.7.
Most commonly, breaches or attacks led to organisations having to redirect staff resources to deal with the breach or having to take up new measures to prevent or protect against future cases.
Figure 4.7 Percentage that were impacted in any of the following ways, among the organisations that have identified breaches or attacks in the last 12 months
| Impact | Businesses | Charities |
|---|---|---|
| Any listed impact | 24% | 41% |
| Added staff time to deal with breach or inform others | 14% | 25% |
| New measures needed for future attacks | 14% | 21% |
| Stopped staff carrying out daily work | 7% | 7% |
| Other repair or recovery costs | 3% | 3% |
| Complaints from customers | 3% | 2% |
| Loss of revenue or share value | 2% | 2% |
| Discouraged from executing intended businesses activity | 2% | 3% |
| Prevented provision of goods and services | 1% | 1% |
| Reputational damage | 1% | 2% |
| Goodwill compensation to customers* | 0.5% | 0.5% |
| Fines or legal costs* | 0.5% | 0.5% |
Bases: 1,111 businesses that identified a breach or attack in the last 12 months; 459 charities
*Values greater than 0% but too small to be rounded up to 1% are shown as 0.5%.
The impact is most substantial for large businesses. For example:
- 30% needed extra staff time to deal with breaches (vs. 14% of all the businesses identifying breaches or attacks)
- 34% of large businesses say they have had to take up new measures to prevent or protect against future attacks (vs. 14% overall)
- 18% report staff being stopped from carrying out their day-to-day work (vs. 7% overall)
4.6 Financial cost of breaches or attacks
Each year, this survey series has attempted to capture the cost of cyber security breaches or attacks on organisations.
As in previous years of the survey, we asked granular questions breaking down different aspects of the cost of the single most disruptive breach or attack that organisations recall facing in this period. Tables 4.1 to 4.4 show these cost estimates. Table 4.5 brings together these granular breakdowns for an overall cost estimate for the most disruptive breach. These are presented for all organisations experiencing breaches or attacks, as well as those with an actual outcome, such as a loss of assets or data. The latter subgroup of organisations tends to face higher costs, as these tables show.
In these tables, in order to allow for a bigger sample size for more robust estimates, we combine micro and small businesses together, and medium and large businesses.
To note, the way these cost estimates are compiled was substantially changed in the 2021 survey, so they cannot be compared to results from before 2021.
As displayed in Table 4.1, we cover the short-term direct costs of the most disruptive breach or attack. In the survey, we defined these as being any external payments that were made when the breach was being dealt with. This includes, as examples offered to respondents:
- any payments to external IT consultants or contractors to investigate or fix the problem
- any payments to the attackers, or money they stole
Table 4.1: Average short-term direct cost of most disruptive breach or attack from the last 12 months[footnote 9]
| Across organisations identifying any breaches or attacks | All businesses | Micro/small businesses | Medium/large businesses | All charities |
| Mean cost | £510 | £330 | £4,670 | £70 |
| Median cost | £0 | £0 | £0 | £0 |
| Base | 983 | 723 | 260 | 413 |
| Only across organisations identifying breaches with an outcome | All businesses | Micro/small Businesses | Medium/large businesses | All charities |
| Mean cost | £3,270 | £2,240 | £17,970 | £610 |
| Median cost | £0 | £0 | £0 | £0 |
| Base | 160 | 97 | 63 | 60 |
We defined long-term direct costs, shown in Table 4.2, as external payments in the aftermath of the breach incident.
The examples included in the survey were:
- any payments to external IT consultants or contractors to run cyber security audits, risk assessments or training
- the cost of new or upgraded software or systems
- recruitment costs if you had to hire someone new
- any legal fees, insurance excess, fines, compensation, or PR costs related to the incident
Table 4.2: Average long-term direct cost of most disruptive breach or attack from the last 12 months
| Across organisations identifying any breaches or attacks | All businesses | Micro/small businesses | Medium/large businesses | All charities |
| Mean cost | £240 | £90 | £3,550 | £200 |
| Median cost | £0 | £0 | £0 | £0 |
| Base | 982 | 725 | 257 | 412 |
| Only across organisations identifying breaches with an outcome | All businesses | Micro/small Businesses | Medium/large businesses | All charities |
| Mean cost | £1,340 | £350 | £15,330 | £250 |
| Median cost | £0 | £0 | £0 | £0 |
| Base | 160 | 99 | 61 | 61 |
We also asked about the costs of any staff time (i.e., indirect costs of the breach), as displayed in Table 4.3. This includes, for instance, how much staff would have got paid for the time they spent investigating or fixing any problems caused by the breach. We explicitly asked respondents to include the cost of this time regardless of whether this duty was part of the staff member’s job function or not.
Table 4.3: Average staff time cost of the most disruptive breach or attack from the last 12 months
| Across organisations identifying any breaches or attacks | All businesses | Micro/small businesses | Medium/large businesses | All charities |
| Mean cost | £130 | £90 | £1,010 | £160 |
| Median cost | £0 | £0 | £30 | £0 |
| Base | 975 | 728 | 247 | 410 |
| Only across organisations identifying breaches with an outcome | All businesses | Micro/small Businesses | Medium/large businesses | All charities |
| Mean cost | £470 | £390 | £1,660 | £890 |
| Median cost | £150 | £150 | £350 | £150 |
| Base | 156 | 97 | 59 | 62 |
Finally, as Table 4.4 shows, we asked about other indirect costs related to breaches, including the following areas (offered as examples to respondents):
- the cost of any time when staff could not do their jobs
- the value of lost files or intellectual property
- the cost of any devices or equipment that needed replacing
Table 4.4: Average indirect cost of the most disruptive breach or attack from the last 12 months
| Across organisations identifying any breaches or attacks | All businesses | Micro/small businesses | Medium/large businesses | All charities |
| Mean cost | £350 | £280 | £1,930 | £40 |
| Median cost | £0 | £0 | £0 | £0 |
| Base | 991 | 734 | 257 | 417 |
| Only across organisations identifying breaches with an outcome | All businesses | Micro/small businesses | Medium/large businesses | All charities |
| Mean cost | £2,150 | £1,790 | £7,310 | £190 |
| Median cost | £0 | £0 | £0 | £0 |
| Base | 162 | 100 | 62 | 61 |
Table 4.5 combines the estimates across all the areas of costs covered in the survey (direct costs, staff time and other indirect costs). The figures here can be considered the average total cost that organisations have faced from their single most disruptive breach.
Table 4.5: Average total cost of the most disruptive breach or attack from the last 12 months
| Across organisations identifying any breaches or attacks | All businesses | Micro/small businesses | Medium/large businesses | All charities |
| Mean cost | £1,205 | £780 | £10,830 | £460 |
| Median cost | £0 | £0 | £50 | £0 |
| Base | 1006 | 740 | 266 | 424 |
| Only across organisations identifying breaches with an outcome | All businesses | Micro/small businesses | Medium/large businesses | All charities |
| Mean cost | £6,940 | £4,590 | £40,400 | £1,850 |
| Median cost | £500 | £500 | £970 | £200 |
| Base | 168 | 102 | 66 | 63 |
Commentary on the financial costs
The following key findings should be noted from these cost tables (Tables 4.1 to 4.5):
- Among those identifying breaches with an outcome, the immediate direct costs of a cyber security incident (Table 4.1) are reported by micro and small businesses as being much higher than the costs in the aftermath of an incident (Table 4.2). This was also the case in 2023 and 2022. This could be because immediate costs (e.g. the payment of a ransom) are easier to calculate and more tangible than the more long-term costs in the aftermath.
- As in previous years, businesses tend to identify higher costs than charities. This does not necessarily mean that charities face a lower risk - it could be that they tend to have a less comprehensive understanding of the cost implications, so report lower costs.
- The median cost is typically £0 across businesses and charities - also a similar pattern to previous years. This reflects the fact that, for most breaches or attacks, organisations do not identify any material outcome (a loss of assets or data), so do not always recognise the need for a response. An area of exception, where the median cost is not £0, is the staff time cost among businesses and charities that experienced an outcome from their most disruptive breach.
Chapter 5: Dealing with breaches or attacks
This chapter explores how well businesses and charities deal with breaches or attacks, including identification, response, reporting and adaptation to prevent future cases.
In the survey, questions on this topic were generally framed in terms of the most disruptive breach or attack an organisation had faced in the last 12 months. Most of this chapter is therefore only based on the 50% of business and 32% of charities that have identified breaches or attacks (unweighted sample sizes of 1,111 and 529 respectively), rather than the full sample. Consequently, the size and sector subgroups tend to have very small sample sizes, and subgroup analysis is featured much less in this chapter.
The questions on incident response and ransomware in the first sections are, however, asked of the full sample.
5.1 Incident response
Figure 5.1 shows the actions organisations say they take, or would take, in response to a cyber incident - this is a prompted list. By far the top response is to inform senior management. It is far less common for organisations to say they would inform regulators - perhaps expected, given that not all sectors are regulated to the same extent. Around five in ten say they take, or would take, each of the other listed actions (except for informing insurance providers).
The result for informing insurance providers is specifically taken from the 43% of businesses and 34% of charities that have any form of cyber insurance. In total, 50% of these businesses and 54% of these charities say they would inform their provider.
Figure 5.1: Percentage of organisations that say they take, or would take, the following actions following a cyber security incident
| Action taken following a cyber security incident | Businesses | Charities |
|---|---|---|
| Inform your directors or trustees of the incident | 77% | 81% |
| Keep an internal record of incidents | 54% | 68% |
| Assess the scale and impact of the incident | 53% | 63% |
| Inform your cyber insurance provider (among those with insurance)* | 50% | 54% |
| Formal debriefs or discussions to log any lessons learnt | 50% | 63% |
| Attempting to identify the source of the incident | 45% | 46% |
| Inform a regulator of the incident when required | 44% | 56% |
Bases: 2,000 UK businesses; 1,004 charities *This code is based on the 477 businesses and 213 charities that have some form of cyber insurance
Figure 5.2 shows the documentation, guidance and processes that organisations have in place for such incidents. While a large majority of organisations say in Figure 5.1 that they will take several actions following a cyber incident, in reality a smaller proportion already have processes in place to support this. The most common processes, mentioned by around a third of businesses and charities, are having specific roles and responsibilities assigned to individuals, having guidance on external reporting, and guidance on internal reporting. Formal incident response plans are relatively rare, when looking across all organisations (22% of businesses and 19% of charities have one in place).
Figure 5.2: Percentage of organisations that have the following measures in place for dealing with cyber security incidents
| Measure in place | Businesses | Charities |
|---|---|---|
| Roles or responsibilities assigned to individuals during or after incident | 37% | 34% |
| Written guidance on who to notify | 32% | 30% |
| Guidance for when to report externally (e.g. to regulators or insurers) | 29% | 28% |
| Formal incident response plan | 22% | 19% |
| External communications and public engagement plans | 15% | 15% |
Bases: 2,000 UK businesses; 1,004 charities
Larger organisations are more likely than average to say they would do or have in place each of the measures in Figures 5.1 and 5.2. For example, 55% of medium-sized businesses, 73% of large businesses and 50% of high-income charities have a formal incident response plan. Nevertheless, even among large businesses, under half (48%) have a communications plan in place.
Two sectors tend to have a more formalised cyber incident response approach:
- finance and insurance businesses are more likely to have an incident response plan (51%, vs. 22% overall) among several of the other listed measures
- health, social care and social work businesses are also more likely to have this (53%), among other measures.
Qualitative insights on the challenges around incident response
The qualitative interviews highlighted several challenges organisations might face when dealing with cyber incidents. In smaller organisations, there was a heavy reliance on DSPs for incident response, such as IT providers and cloud storage providers. Several organisations said they would simply turn to these providers for advice and guidance following an incident. In a number of cases, they had delegated all responsibility for cyber security to these providers, so did not feel the need to come up with any internal processes.
“We have a lot of protection in place by service providers - they would notify us and tell us what to do.”
Security Architect, Medium Sized Business
Smaller organisations also found it harder to develop incident response plans, because of a lack of in-house expertise or capacity.
“The challenges in planning for cyber security incidents is the unknown. We are a support organisation, and we don’t have an IT infrastructure. You don’t feel like you’ve got the support. Apart from external forms of support, we are not big enough to have resource. We have to cobble it together. Sometimes that doesn’t feel good enough.”
Director, Small Business
Another broad challenge raised in smaller organisations was the inherent unpredictability of cyber incidents, and not knowing how to prepare.
“Probably the vast number of ways you could be breached… it feels difficult to plan for so many options.”
Facilities and Operations Manager, Medium Income Charity
Tighter budgets and team capacity is also a challenge for smaller organisations when preparing for cyber security attacks.
“Ultimately it is budget and headcount that are the limiting factors”.
Head of IT and Technical Operations, Medium Sized Business
In larger organisations, the challenges were often more related to a disconnect between IT or cyber teams and wider staff, including senior managers.
“The difficulty is expecting what users and staff members are going to do and how they’ll react to having things change.”
IT Operations Manager, Small Business
Some of the medium and large organisations have simulation exercises and scenario tests in place to identify any weak spots in their staff training and preparedness. However, when it comes to regularly running these exercises, the organisations sometimes felt push back from staff who were reluctant to dedicate the time and effort towards these.
“People do not get as invested when it’s role play. Other priorities take over, they say they are too busy for that, rather than taking it seriously.”
Head of IT Operations, Small Business
On the other hand, several medium and large organisations reported that their IT teams were relatively well prepared for a cyber incident - in some cases, they had even received incident response training or gathered relevant guidance from the NCSC - but they expected their management boards and wider staff to be much less knowledgeable.
“I haven’t done practical exercises; I think it would stress them all out!”
Office Assistant, Medium Income Charity
“The only challenge is testing potential cyber security incidents due to staff engagement and time and availability. It’s all good to have policies in place but they are no good if don’t test it. Planning for the incidents is no problem but confirming those plans is. I am seeing resistance to taking everything down for 4 days to simulate an attack.”
Cyber & Information Security Manager, Medium Sized Business
Ransomware payments
Around half of businesses (48%) and just under four in ten charities (37%) have a rule or policy to not pay ransomware payments - this is lower than last year (businesses 57% and charities 43%). However, there is still a high level of uncertainty among organisations on this topic, with two in ten of respondents (20%) and under a quarter in charities (23%) saying they do not know what their organisation’s policy on this is.
Small businesses are more likely than large businesses to state that they have such a rule or policy in place (54% of small businesses, vs 42% of large businesses).
Findings are largely similar across sectors, although information and communication businesses are more likely than others to say they have a rule not to pay out (66%, vs. 48% overall).
5.2 External reporting breaches or attacks
External reporting of breaches remains uncommon amongst organisations. This year, among those identifying breaches or attacks, a third of businesses (34%) and almost two-fifths of charities (37%) reported their most disruptive breach outside their organisation.
As in previous years, many of these cases simply involve organisations reporting breaches to their external cyber security or IT providers and no one else. When excluding these, we find that a quarter of the businesses (25%) and three in ten of the charities (29%) identifying breaches or attacks reported these externally. Figure 5.3 shows the top places, beyond cyber security or IT providers, that businesses and charities tend to report breaches to externally. To note, this question is unprompted in both the telephone and online surveys.
Figure 5.3 serves to highlight the important role played by banks primarily for businesses while for charities the most important role is internet or service provider when it comes to cyber security. They are also a common information source for micro businesses on the topic (covered in Section 2.3).
Figure 5.3 Percentage of organisations reporting their most disruptive breach or attack in the last 12 months to the following groups, among those that reported externally (beyond cyber security or IT providers)
Top unprompted responses (5% or more) beyond cyber security or IT providers
| Organisation or individuals reported to | Businesses | Charities |
|---|---|---|
| Bank, building society, or credit card company | 32% | 13% |
| Police | 10% | 14% |
| Website administrator | 10% | 2% |
| Internet/Network Service Provider | 9% | 19% |
| Action Fraud | 8% | 10% |
| National Cyber Security Centre (NCSC) | 5% | 12% |
| Suppliers/business partners | 6% | 1% |
| Outsourced cyber security provider | 5% | 4% |
| Social media site (e.g. Facebook) | 5% | 6% |
| Clients/customers | 5% | 3% |
Bases: 224 businesses that reported their most disruptive breach externally (to someone other than an outsourced cyber security or IT provider, or a parent company; 115 charities
Among the businesses and charities that do not report their most disruptive breach or attack, the most common reason given for this is that it was not considered significant enough to warrant reporting (for 68% of both businesses and charities). Beyond this, the next most common reasons are:
- they do not know who to report to (for 13% of businesses and 11% of charities)
- they do not think reporting will make any difference (for 9% and 4% respectively)
- the breach or attack was too recent or that they haven’t had enough time to report it (for 4% and 3% respectively).
Qualitative insights as to why organisations may not report breaches
The qualitative interviews examined organisations’ experiences of reporting breaches externally. Reflecting the findings from the survey, qualitative respondents varied between those who said they reported all or nearly all incidents externally, and those who did not.
There was a broad distinction between organisations that had detailed incident response plans that stipulated how they should report incidents, and those that dealt with incidents in a more ad-hoc or reactive manner, where a specific member of staff would use their discretion as to whether to report the incident. One respondent acknowledged that their approach needed to be improved; even though they had an incident response plan, this needed to be updated to incorporate external organisations.
Another theme from the qualitative interviews was that organisations with limited experience of breaches in the past were less clear on the need for external reporting. One respondent noted that it was only through experience of incidents that they would develop knowledge of who to report incidents to and when.
“Communication is always the thing to work on and improve how we communicate outside the business. Unfortunately, we will only get the experience through actual incidents.”
Cyber & Information Security Manager, Medium Sized Business
When considering the circumstances in which incidents should be reported externally, qualitative respondents said that this depended on the scale or seriousness of the breach. For example, breaches that involved disclosure of personal information or those with financial implications were generally seen as requiring external reporting.
As noted previously, some organisations said they would simply report incidents to their cyber security or IT provider and rely on them to deal with the issue. In other cases, incidents would be reported to a parent company, again with the expectation that this organisation would address the issue.
Some respondents said that incidents were routinely reported externally, for example to the ICO or NCSC, to their insurer or to their customers. More commonly, respondents said that incidents would only be reported to external organisations who were directly affected or involved in the breach, or to their bank if the incident affected the organisation’s finances or bank account.
5.3 Actions taken to prevent future breaches or attacks
Among those that have identified any breaches or attacks, 59% of businesses and 70% of charities report taking any action to prevent further breaches. As Figure 5.4 shows, the most common specific action taken are a mixture of additional staff training or communications and implementing new technical controls.
Figure 5.4: Percentage of organisations that have done any of the following since their most disruptive breach or attack of the last 12 months
Top unprompted responses (5% or more)
| Action taken | Businesses | Charities |
|---|---|---|
| Additional staff training or communications | 23% | 35% |
| Changed or updated firewall or system configurations | 9% | 8% |
| Installed, changed or updated antivirus or anti-malware software | 8% | 3% |
| Increased monitoring | 5% | 5% |
| No action taken | 39% | 27% |
Bases: 1,028 businesses that recalled their most disruptive breach or attack in the last 12 months; 429 charities
We can further categorise the answers into changes of a technical nature (e.g. to firewalls, admin access or antivirus software), people-related changes (e.g. to training or staffing) and governance changes (e.g. updates to policies or other documentation). When viewed in this way, a more significant proportion of charities than businesses have made people-related changes (41% and 28% respectively) compared to technical changes (at 29% for both). For both groups, fewer decided to make changes to their governance processes (4% of businesses and 6% of charities).
Medium businesses (74%, vs. 59% overall) and large businesses (86%) are the most likely than smaller businesses to have taken any actions to prevent further breaches or attacks.
As may be expected, the picture in Figure 5.5 changes slightly when looking only at the organisations whose most disruptive breach resulted in a material outcome (e.g. the loss of files, money, or other assets). Amongst businesses 79% took any form of action while among charities 97% took any form of action here. These tend to be more focused around additional training/communication (19% among businesses and 42% among charities) and changing/updating firewall/system configurations (18% among businesses and 6% among charities).
Figure 5.5 Percentage of organisations that have done any of the following since their most disruptive breach or attack of the last 12 months, in cases where breaches had material outcomes
Top unprompted responses (5% or more)
| Action taken | Businesses | Charities |
|---|---|---|
| Additional staff training or communications | 19% | 42% |
| Changed or updated firewall or system configurations | 18% | 6% |
| Installed, changed or updated antivirus or anti-malware software | 17% | 4% |
| New software or tools (other than antivirus or anti-malware) | 7% | 13% |
| Outsourced cyber security | 7% | 0% |
| New or updated cyber security policies | 6% | 9% |
| Increased monitoring | 6% | 4% |
| Changed user admin / access rights | 5% | 12% |
| Vetting staff / extra vetting | 1% | 6% |
| No action taken | 18% | 3% |
Bases: 176 businesses that recalled their most disruptive breach or attack with an outcome in the last 12 months; 63 charities
Chapter 6: Cyber crime
This chapter covers cyber crime and the frauds that occur as a result of cyber crime. It further explores the threat landscape for UK organisations, by establishing a subset of the number of cyber-attacks or breaches that could be defined as crimes, in terms of the Computer Misuse Act 1990 and the Home Office Counting Rules.
Cyber crime involves gaining unauthorised access, or causing damage, to computers, networks, data or other digital devices, or the information held on those devices. Examples of cyber crime include hacking or unauthorised access into online accounts (e.g. banking, email or social media accounts), denial of service attacks, or devices being infected by a virus or other malicious software (including ransomware).
The chapter covers:
- the prevalence of cyber crimes, i.e. how many organisations are affected by them
- the nature of these cyber crimes
- the scale of cyber crimes, i.e. the number of times each organisation is impacted, and estimates for the total number of cyber crimes against UK organisations
- estimates of the financial cost of cyber crime
- a similar set of statistics with regards to frauds that occur as a result of cyber crime (cyber-facilitated fraud).
Some of the cyber security breaches and attacks reported in Chapter 4 do not constitute cyber crimes under the above definition. For example, some attempted attacks will not have penetrated an organisation’s cyber defences and some, such as online impersonation, would be beyond the scope of the Computer Misuse Act. Therefore, the statistics on prevalence and financial cost of cyber crime differ from the equivalent estimates for all cyber security breaches or attacks (in Chapter 4). They should be considered as a distinct set of figures, specifically for crimes committed against organisations, so are a subset of all breaches and attacks.
The questions reported in this chapter allow us to monitor the prevalence of, and harm caused by, cyber crimes against organisations, using a similar approach to existing official estimates of crime against individuals. Other such estimates include police-recorded crime as well as the estimates from the general public Crime Survey for England and Wales (CSEW), both of which follow the Home Office Counting Rules.
It is important to remember that, as with all cyber security breaches and attacks, the survey can only measure cyber crimes or fraud that organisations can identify and recall. There are likely to be hidden crimes, and others that organisations cannot recall in detail, so the findings reported here may have a tendency to underestimate prevalence and scale.
6.1 Changes from the 2023 report
Cyber crime was previously covered in the 2023 report. However, the cyber crime and cyber-facilitated fraud questions in the 2024 questionnaire are substantially different. These changes were made in order to strengthen the reliability of the more experimental data from 2023, based on feedback from Home Office and from new cognitive testing this year. Due to these changes, it is not possible to make direct comparisons between 2023 and 2024. The new 2024 data should also still be considered experimental.
6.2 What constitutes crime
This survey covers multiple forms of cyber crime:
- ransomware that breached an organisation’s defences (i.e. it was not stopped by software)
- hacking unauthorised access of files or data, as well as online takeovers (e.g. of websites, social media accounts or email accounts and hacking of online bank accounts that did not lead to fraud) that was carried out intentionally, including attacks that led to extortion
- denial of service attacks that breached an organisation’s defences and were carried out intentionally, including attacks that led to extortion
- other computer viruses or malware that breached an organisation’s defences
- phishing attacks that individuals engaged with (e.g. by opening an attachment) or that were targeted towards a specific organisation/recipient (e.g. containing personal data), and did not lead to any further crimes being committed
Sometimes multiple attack vectors can be involved in one cyber incident, for example a phishing attack could lead to malware being installed on a device, which then allows the attacker unauthorised access to files. In order to adhere to the Home Office Counting Rules, and avoid double-counting of crimes, the survey asks respondents about each crime type in turn, in the order presented above (i.e. ransomware first, and phishing last). For each crime type, respondents are asked about any additional incidents that were separate to those already mentioned under the previous crime types. As a worked example, if an organisation experienced hacking that led to ransomware, and this breached their defences:
- we first ask about the ransomware
- we then establish that the ransomware constitutes a cyber crime (i.e. it was not blocked by cyber security software)
- we then ask the respondent to disregard that particular incident when being asked about further hacking attacks, so that the same crime is not counted twice
Cyber crime also facilitates other offences. In recognition of this, we have included questions that capture where cyber crime has led to fraud (i.e. cyber-facilitated fraud). Cyber-facilitated fraud is deception to make a gain, or cause a loss, in relation to money, services, property or goods, which uses data or access obtained through cyber crimes. In these cases, to avoid double-counting, the incident is recorded here as a fraud rather than a cyber crime. We have included these fraud estimates to complement the cyber crime estimates. However, these cyber-facilitated fraud statistics are not intended to capture all frauds committed against businesses - they only represent the frauds preceded by cyber crimes.
More details on the approach to this chapter can be found in the separately published Technical Annex.
6.3 The prevalence of cyber crime
Looking across all the different types of cyber crime, we estimate that 22% of businesses and 14% of charities have been the victim of at least one cyber crime in the last 12 months. This accounts for approximately 312,000 businesses and 27,000 registered charities - although these estimates, like all survey results, will be subject to a margin of error (see Appendix A).[footnote 10] This excludes cyber-facilitated fraud, which is discussed separately in Section 6.7.
Looked at another way, among the 50% businesses and 32% of charities identifying any cyber security breaches or attacks, just over two-fifths (44% for businesses and 42% for charities) ended up being victims of cyber crime.
As Figure 6.1 shows, across all organisations (i.e. not just those identifying breaches or attacks), medium and large businesses are significantly more likely to experience a cyber crime than smaller ones. Similarly, high-income charities (37% of those with an income of £500,000 or more, vs. 14% of all charities) are also significantly more likely to have experienced a cyber crime. This reflects the pattern for cyber security breaches and attacks more generally, as described in Chapter 4. While there is a higher prevalence of cyber crime amongst small business compared to the overall business figure, this is significantly lower than for medium and large businesses. This may indicate underreporting in smaller organisations as they may have less sophisticated cyber security monitoring in place.
Figure 6.1 Percentage of organisations that have experienced any cyber crime (excluding cyber-facilitated fraud) in the last 12 months
| Businesses overall | 22% |
| Micro businesses | 19% |
| Small businesses | 29% |
| Medium businesses | 45% |
| Large businesses | 58% |
| Information or communication | 42% |
| Utilities or production businesses | 31% |
| Charities overall | 14% |
Bases: 2,000 UK businesses; 1,060 micro businesses; 506 small businesses; 264 medium businesses; 170 large businesses; 124 Information or communication; 156 utilities or production businesses; 1,004 charities
The next section (Section 6.4) covers the types of cyber security breaches or attacks that resulted in cyber crime. It is worth noting that most of the 22% of businesses and 14% of charities that identify any cyber crime are referring to phishing-related cyber crimes where individuals responded to a phishing email (e.g. by opening an attachment) or where the phishing email was targeted towards a specific organisation/recipient, but no other crime occurred as a result. When removing these phishing-related cyber crimes from the calculation, we estimate that a total of 3% of businesses and 2% of charities have experienced at least one non-phishing cyber crime in the last 12 months. This amounts to approximately 46,000 businesses and 4,000 registered charities.
Non-phishing cyber crimes are again more prevalent than average among large businesses (16% for large businesses vs. 3% of businesses overall) and high-income charities (5%, vs. 2% of charities overall).
6.4 The nature of cyber crimes experienced
This section breaks down the types of cyber crimes that organisations have faced, among the 22% of businesses and 14% of charities that have been victim to at least one cyber crime.
Figure 6.2 shows that phishing attacks (90% among business and 94% among charities) are by far the most common type of cyber crime in terms of prevalence while other cyber crimes were much rarer. The least commonly identified types of cyber crime are ransomware (2% among businesses and 1% among charities) and denial of service attacks (1% for both businesses and charities).
Figure 6.2 Percentage of organisations that have identified the following types of cyber crime in the last 12 months, among the organisations that have identified any cyber crime
| Type of Cyber crime | Businesses | Charities |
|---|---|---|
| Phishing attacks | 90% | 94% |
| Hacking (unauthorised access or online takeovers) | 10% | 11% |
| Viruses, spyware or malware | 2% | 3% |
| Ransomware | 2% | 1% |
| Denial of service attacks | 1% | 1% |
Bases: 575 businesses that identified a cyber crime in the last 12 months; 233 charities
It is worth noting that there is a considerable drop between the number of businesses reporting ransomware in Chapter 4, as an attempted or successful attack, and the number who say that the ransomware breached the organisation’s defences (i.e. was not stopped by internal security software) and as such would be classed as a crime. This is surprising as we suspect that many recipients typically would not know that a cyber attack was going to result in ransomware until the ransom is demanded, at which point systems have already been infiltrated and a crime has been committed. We anticipate that prior to this point, any suspicious activity detected would likely be indiscernible for many businesses from a malware or unauthorised access incident, but it is possible a business could identify that they had successfully defended against a certain malware strain that was linked to ransomware. Given this uncertainty, we suggest caution in the interpretation of the statistics around ransomware, and we will explore this issue further as part of next year’s publication. We will also then consider whether there is value in amending any question wording in relation to either breaches, or crimes, experienced to help clarify the situation.
6.5 The scale of cyber crime
Some organisations may be the victims of cyber crime multiple times. Our survey also estimates the scale of cyber crime - that is, the number of times cyber crime has occurred among the 22% of businesses and 14% of charities that identified any cyber crime in the last 12 months. Looking at the proportions among those who experienced a cyber crime by organisation type we see that:
- Among these businesses, just under a third (28%) identified 1 cyber crime over this period, just over one in ten (13%) identified 2 cyber crimes, and just under three-fifths (59%) experienced 3 or more.
- Among these charities, just over a third (35%) identified 1 cyber crime in the last 12 months, one fifth (20%) identified 2 cyber crimes, and over two-fifths (45%) experienced 3 or more.
On average (taking the mean estimates), these businesses experienced 25 cyber crimes of any kind in the last 12 months, and these charities experienced 34 cyber crimes in the last 12 months. Both mean score estimates, particularly the charities estimate, are driven up by a handful of sampled organisations that recorded a very high number of phishing-related crimes (in the thousands). The median result, which may be more reflective of the typical organisation, was 4 cyber crimes for businesses and 2 cyber crimes for charities.
This data indicates a high level of repeat victimisation amongst organisations experiencing cyber crime. Whilst this is still the case when looking at non-phishing related crime, it is to a much lesser extent. Amongst the 3% of businesses identifying non-phishing cyber crimes, the average experienced 3 such events (the mean estimate). The typical business experienced 1 such event (the median estimate). There were too few cases of non-phishing cyber crime among the sampled charities to report statistically reliable results here.
As the results are representative of the overall business and charity populations, it is possible to extrapolate from the mean results and present estimates for the scale of cyber crime across the overall UK business and charity populations. However, it should be noted that these population estimates will have an associated wide margin of error, especially for the non-phishing cyber crimes for businesses (a sample size of 95 for businesses).
Using the results from this Cyber Security Breaches Survey, we estimate that:
- UK businesses have experienced approximately 7.78 million cyber crimes of all types and approximately 116,000 non-phishing cyber crimes in the last 12 months.
- UK charities have experienced approximately 924,000 cyber crimes of all types in the last 12 months.
6.6 Financial cost of cyber crimes
Table 6.1 shows the estimated costs organisations incurred from all the identified cyber crimes over the past 12 months. This excludes crimes where the only activity was phishing, i.e. where there was no follow-on crime from the phishing email, such as a successful ransomware attack or hacking. For crimes of this nature the cost is expected to be negligible for organisations. Where the phishing did lead to a follow-on crime, the cost of this – in theory - should be captured in the follow-on crime types. Whether or not the survey has been able to fully capture this is discussed further below.
Due to small sample sizes, it is not possible to break down these figures by the size of business (as is done with the cost estimates for cyber security breaches and attacks in Chapter 4), or by crime type. Similarly, the number of cases for charities experiencing non-phishing cyber crime is too low to report cost estimates.
A proportion of businesses say that the cyber crimes they experienced incurred no cost.The estimates excluding them are effectively showing the cost of cyber crimes that have a material impact on the business.
The wide gap between mean and median costs highlights that - just as with all cyber security breaches or attacks - the typical business faces relatively low costs, but a small minority of businesses face potentially crippling costs from cyber crime.
Whilst the cyber crime cost figures are not comparable to 2023, it is recognised that the mean cost is notably lower than in 2023. Furthermore, as outlined in Section 4 of this report, there is quite a disparity between these and the costs for a most disruptive breach, which are typically associated with phishing attacks. These results were unexpected and reasons for these disparities are not completely clear. They may reflect general challenges in securing reliable cost data from business or there may simply have been fewer high-cost crimes in the year (as the cyber crime cost median is broadly similar to 2023). Alternatively, it may reflect a potential issue with the revised questionnaire as most respondents reflected on phishing as the most disruptive incident, but if the most disruptive costs are as high as suggested, then it might indicate another crime was involved that has not been captured by the survey questions, as phishing alone is just a facilitator.
Table 6.1: Average cost per business of all cyber crimes (excluding phishing and cyber-facilitated fraud) experienced in the last 12 months [footnote 11]
| Businesses experiencing any cyber crime other than phishing (including those giving a cost of £0) | Businesses experiencing any cyber crime other than phishing (excluding those giving a cost of £0) | |
| Mean cost | £1,120 | £1,720 |
| Median cost | £200 | £450 |
| Base | 83 | 47 |
6.7 Cyber-facilitated fraud
Prevalence of cyber-facilitated fraud
A total of 3% of all businesses and 1% of all charities have been a victim of fraud that resulted from a cyber crime in the last 12 months.
When extrapolating this to the respective overall populations, this equates to approximately 43,000 businesses and 2,000 registered charities experiencing cyber-facilitated fraud.
The overall percentage estimates are slightly, but significantly, higher among large businesses, 7% of which have been victims of cyber-facilitated fraud (vs. 3% of businesses overall).Construction businesses and utilities or production business (both 6%) were also more likely to have been victims of cyber-facilitated fraud, when compared to businesses overall.
Scale of cyber-facilitated fraud
Amongst the 3% of businesses that report cyber-facilitated fraud, almost three in five (59%) say this happened just once in the last 12 months. The average (mean) number of cyber-facilitated frauds experienced by these businesses is a little over 2 per business. The median number was 1 cyber-facilitated fraud per business.
As with the scale of cyber crime estimates (see Section 6.5), it is possible to extrapolate from these results and present estimates for the overall business population. Once again, it should be noted that these will have an associated wide margin of error (based on a sample size of 73 businesses). Nevertheless, we estimate that there were approximately 96,000 cyber-facilitated fraud events across the entire business population in the last 12 months (based on the unrounded mean estimates).
The sample size is too low to include the results (including any extrapolated population estimates) for charities.
The breaches or attacks preceding cyber-facilitated fraud
Among the 3% of businesses that fell victim to cyber-facilitated fraud, Figure 6.3 shows the cyber crimes that led to the fraud. For example, 43% say that they were a victim of fraud which resulted from a phishing attack. The most common enablers of cyber-facilitated fraud, in terms of the types of cyber crime, are therefore phishing, and hacking of online bank accounts. The remaining types of cyber crime more rarely appear to lead to fraud. It should be noted that these questions are dependent on respondents being able to identify the origins of the fraud, but we do not know how often or how accurately they are able to do this.
Figure 6.3 Percentage of businesses that had specific breaches or attacks leading to cyber-facilitated fraud, among the businesses experiencing any cyber-facilitated fraud
| Phishing attacks | 43% |
| Hacking or attempted hacking of online bank accounts | 35% |
| Takeovers of organisation’s or users’ accounts | 10% |
| Viruses, spyware or malware (excluding ransomware) | 8% |
| Unauthorised accessing of files or networks by people outside your organisation | 5% |
| Denial of service attacks | 3% |
| Ransomware* | 0.5% |
| Unauthorised accessing of files or networks by staff* | 0.5% |
Bases: 73 businesses that incurred fraud as a direct result of cyber crime in the last 12 months (excluding small numbers that say “don’t know” at each answer code)
*Values greater than 0% but too small to be rounded up to 1% are shown as 0.5%.
As noted in Section 6.2, our survey estimates for cyber crime and cyber-facilitated fraud are mutually exclusive - we do not double-count instances of fraud to be cyber crime as well. If criminal activities like targeted hacking led to fraud, they are counted as cyber-facilitated fraud. If they did not lead to fraud, i.e. if the targeted hacks did not lead to anything else, they are counted as cyber crimes.
Chapter 7: Conclusions
Prevalence of cyber security breaches or attacks
In this year’s survey, half of businesses and around a third of charities report having experienced any kind of cyber security breach or attack in the last 12 months. As in previous years, larger businesses and charities are more likely to identify breaches or attacks than smaller ones.
It is not possible to make direct comparisons between 2023 and 2024, as there have been substantive changes to the main question that seeks to capture overall incidence of cyber-attacks and breaches.
The important context for trend findings
Organisations have faced significant challenges in recent years related to the COVID pandemic and the economic climate. In last year’s survey, smaller organisations in particular highlighted rising costs and challenges with financial planning, due to high inflation, higher energy prices and overall economic uncertainty. This may have resulted in cyber security falling as a priority, relative to these wider concerns.
The overall context is somewhat more stable in the 2024 survey. While economic challenges remain, the picture is broadly similar to last year, and some issues such as rising inflation have become less acute.
This context is reflected in the trend findings comparing 2023 with 2024. Organisations’ practices and activities have remained broadly similar compared with a year ago, and some longer-term negative trends have stabilised or been partially reversed. These patterns are explored in more detail below.
Priority given to cyber security
The proportion that says cyber security is a high priority has increased slightly among businesses and has remained stable among charities. This follows an apparent drop in prioritisation observed in 2023. The qualitative interviews suggest that, despite economic conditions, many organisations have continued to invest either the same amount or more in cyber security over the last 12 months. This is in part a response to the perceived increase in the number of cyber-attacks and their sophistication.
Approaches to cyber security
Most businesses and charities have a broad range of measures in place to protect themselves against cyber threats. The 2024 survey has seen a slight increase in the deployment of some controls and procedures among businesses: using up-to-date malware protection, restricting admin rights, use of network firewalls and agreed processes for phishing emails. This follows a period of consistent decline in the use of some measures in the previous three years of the survey. As a result, this year’s figures represent a partial reversal of the longer-term pattern.
The 2024 survey also shows increases since 2023 in the following areas:
- Both businesses and charities are more likely to say they have a formal cyber security strategy in place than in 2023.
- The proportion of businesses with some form of insurance against cyber security risks has increased, while the proportion has remained stable among charities.
- Since the 2021 survey, the proportion of medium and large businesses running training or awareness raising activities around cyber security has consistently increased. The result for high-income charities has also risen over this time period. The 2021 cyber security skills study highlighted the pressure that COVID-19 restrictions had placed on cyber security training, providing a rationale for the uplift we have seen since then, as restrictions have been lifted.
- There is no clear long-term trend for businesses or charities, in the proportions that review cyber risks from their immediate supplier and their wider supply chain. The qualitative interviews suggest that organisations have an increasing awareness of the cyber security risks posed by supply chains, but often have limited formal procedures in place to manage these risks.
Awareness and information
While the previous section suggests that the prevalence of some activities have increased or at least stabilised in 2024, the trends are mostly negative when looking at organisational awareness and the use of the information. Firstly, there has been a fall in the proportion of businesses seeking information or guidance on cyber security from outside their organisation in the past year. This is part of a steady decrease since 2018 and 2019, during the lead up to, and implementation of, the General Data Protection Regulation (GDPR). There has been no change among charities in this year’s survey.
The survey also examines awareness of specific initiatives or communications campaigns: the national Cyber Aware communications campaign, the 10 Steps to Cyber Security guidance, and the government-endorsed Cyber Essentials scheme. Business awareness of these schemes and initiatives is close to the previous survey, although there is a pattern of declining awareness of all three initiatives over the last two to three years. Fewer charities also report having heard of Cyber Essentials compared to the previous year.
Cyber crime
This survey includes new questions on cyber crime and cyber facilitated fraud. Changes were made in order to strengthen the reliability of the more experimental data from the 2023 survey, although 2024 data should still be viewed as experimental. Further exploration of the survey findings is required to better understand certain unexpected findings and consideration will be given as to whether further edits are required to questions next year.
Among those that can recall experiencing cyber crime, it can also be a very frequent occurrence for some businesses and charities. The findings show that cyber crime is more prevalent among larger organisations, although this may be a sign of underreporting among smaller organisations.
It is clear that phishing is by far the most common type of cyber crime in terms of prevalence. This confirms findings from other sources, such as the Commercial Victimisation Survey (CVS). The least commonly identified types of cyber crime are ransomware and denial of service attacks. The most common enablers of cyber-facilitated fraud were phishing and hacking of online bank accounts.
Appendix A: Guide to statistical reliability
The final data from the survey are based on weighted samples, rather than the entire population of UK businesses or charities. Percentage results are therefore subject to margins of error, which vary with the size of the sample and the percentage figure concerned.
For example, for a question where 50% of the 2,000 businesses sampled in the survey give a particular answer, the chances are 95 in 100 that this result would not vary more or less than 2.6 percentage points from the true figure the figure that would have been obtained had the entire UK business population responded to the survey. The margins of error that are assumed to apply in this report are given in the following table.[footnote 12]
Margins of error (in percentage points) applicable to percentages at or near these levels
| 10% or 90% | 30% or 70% | 50% | |
| 2,000 businesses | ±1.6 | ±2.4 | ±2.6 |
| 1,060 micro businesses | ±1.9 | ±2.8 | ±3.1 |
| 506 small businesses | ±2.7 | ±4.1 | ±4.5 |
| 264 medium businesses | ±3.7 | ±5.6 | ±6.2 |
| 170 large businesses | ±4.6 | ±7.0 | ±7.6 |
| 1,004 charities | ±2.3 | ±3.5 | ±3.8 |
There are also margins of error when looking at subgroup differences. A difference from the average must be of at least a certain size to be statistically significant. The following table is a guide to these margins of error for the subgroups that we have referred to several times across this report.
Differences required (in percentage points) from overall (business or charity) result for significance at or near these percentage levels
| 10% or 90% | 30% or 70% | 50% | |
| 1,060 micro businesses | ±1.0 | ±1.6 | ±1.7 |
| 506 small businesses | ±2.3 | ±3.4 | ±3.7 |
| 264 medium businesses | ±3.4 | ±5.2 | ±5.7 |
| 170 large businesses | ±4.4 | ±6.7 | ±7.3 |
| 142 finance and insurance businesses | ±5.5 | ±8.3 | ±9.1 |
| 335 high-income charities | ±3.1 | ±4.6 | ±5.1 |
Appendix B: Glossary
Broad definitions of cyber security terms
| Term | Definition |
| Cyber attack | A cyber-attack is a malicious and deliberate attempt by an individual or organisation to breach the information system of another individual or organisation. |
| Cyber crime | In the context of this study, cybercrime involves gaining unauthorised access, or causing damage, to computers, networks, data or other digital devices, or the information held on those devices. Examples of Cyber crime include hacking or unauthorised access into online accounts (e.g. banking, email or social media accounts), denial of service attacks, or devices being infected by a virus or other malicious software (including ransomware). |
| Cyber-facilitated fraud | In the context of this study, we define fraud as being dishonest action, with the intent of making a financial gain at the expense of an organisation. Cyber-facilitated fraud is deception to make a gain, or cause a loss, in relation to money, services, property or goods, which uses data or access obtained through one or more of the following: ● ransomware viruses, spyware or malware ● denial of service attacks ● hacking - unauthorised access to devices (including, computers, smartphones and other internet-connected devices), as well as online takeovers ● phishing attacks |
| Cyber security | Cyber security includes any processes, practices or technologies that organisations have in place to secure their networks, computers, programs or the data they hold from damage, attack or unauthorised access. |
| Cyber security breach | A cyber security breach is any incident that results in unauthorised access of data, applications, services, networks and/or devices by bypassing their underlying security mechanisms. |
| Impact | A negative impact from a cyber security breach or attack does not have to involve a material loss. This could be issues relating to staff disruption or implementing new measures in the organisation. |
| Outcome | A negative outcome from a cyber security breach or attack involves a temporary or permanent material loss from an organisation, such as a loss of money or data. |
Definitions of types of cyber security breaches
| Term | Definition |
| Denial of service attack | Denial of service attacks try to slow or take down organisations’ website, applications or online services, to render these services inaccessible. |
| Hacking | In the context of this study, we define two forms of hacking. Firstly, unauthorised access of files or networks, or entry into video conferences or instant messaging. Secondly, online takeovers of organisations’ websites, social media accounts or email accounts. |
| Malware | Malware (short for “malicious software”) is a type of computer program designed to infiltrate and damage computers without the user’s consent (e.g. viruses, worms and Trojan horses). |
| Phishing | Phishing involves fraudulent attempts to extract information such as passwords or personal data (e.g. through emails or by filling in forms on websites), or to install malware on the recipient’s device or network. In the context of this study, we define phishing as staff receiving fraudulent emails, or arriving at fraudulent websites. |
| Ransomware | Ransomware is a type of malicious software designed to block access to a computer system until a sum of money (a ransom) is paid. |
| Social engineering | Social engineering involves manipulation of specific individuals to extract important information, such as passwords or personal data, from an organisation, for example, through impersonation. |
Definitions relating to cyber security processes or controls
| Term | Definition |
| Cloud computing | Cloud computing uses a network of external servers accessed over the internet, rather than a local server or a personal computer, to store or transfer data. This could be used, for example, to host a website or corporate email accounts, or for storing or transferring data files. |
| Digital Service Providers | Digital Service Providers (DSPs) manage a suite of IT services like an organisation’s network, cloud computing and applications. |
| Patch management | Patch management is about software security being regularly or automatically patched. In the context of this study, we define it as organisations having a policy to apply software security updates within 14 days of them being made available. |
| Penetration testing | Penetration testing is where staff or contractors try to breach the cyber security of an organisation on purpose, in order to show where there might be weaknesses in cyber security. |
| Removable devices | Removable devices are portable devices that can store data, such as USB sticks. |
| Restricting IT admin and access rights | This is where only certain users are able to make changes to the organisation’s network or computer settings, for example to download or install software. |
| Software as a Service | Software as a Service (SaaS) is a software distribution model in which a cloud provider hosts applications and makes them available to end users over the internet. |
| Threat intelligence | Threat intelligence is where an organisation may employ a staff member or contractor or purchase a product to collate information and advice around all the cyber security risks the organisation faces. |
| Two-factor authentication | Two-factor authentication (2FA), or multi-factor authentication (MFA) is an electronic authentication method in which a user is granted access to a network or application only after successfully presenting two or more pieces of evidence to an authentication mechanism (e.g. a password and a one-time passcode). |
| Virtual Private Network | A Virtual Private Network (VPN) are encrypted network connections, allowing remote users to securely access an organisation’s services. |
Definitions relating to business or charity characteristics
| Term | Definition |
| Micro business | Businesses with 1 to 9 employees |
| Small business | Businesses with 10 to 49 employees |
| Medium business | Businesses with 50 to 249 employees |
| Large business | Businesses with 250 or more employees |
| SME | Small to medium enterprise |
| Low-income charity | Charities with an income of less than £100,000 |
| High-income charity | Charities with an income of £500,000 or more |
| Very high-income charity | Charities with an income of £5 million or more |
Appendix C: Further information
C1.The Department for Science, Innovation and Technology and the Home Office would like to thank the following people for their work in the development and carrying out of the survey and for their work compiling this report:
- Alice Stratton, Ipsos
- Nada El-Hammamy, Ipsos
- Sally-Ann Barber, Ipsos
- Finlay Proctor, Ipsos
- Nick Coleman, Ipsos
- Jayesh Navin Shah, Ipsos.
C2.The Cyber Security Breaches Survey was first published in 2016 as a research report, and became an Official Statistic in 2017. The previous reports can be found at https://www.gov.uk/government/collections/cyber-security-breaches-survey. This includes the full report and the technical and methodological information for each year.
C3.The lead DSIT analyst for this release is Maddy Ell. The responsible statistician is Saman Rizvi. For enquiries on this release, please contact DSIT at cybersecurity@dsit.gov.uk.
C4.The Cyber Security Breaches Survey is an official statistics publication and has been produced to the standards set out in the Code of Practice for Official Statistics. For more information, see https://www.statisticsauthority.gov.uk/code-of-practice/. Details of the pre-release access arrangements for this dataset have been published alongside this release.
C5.This work was carried out in accordance with the requirements of the international quality standard for Market Research, ISO 20252.
-
This research was previously commissioned by the former Department for Digital, Culture, Media and Sport (DCMS). In February 2023, the parts of DCMS responsible for cyber security policy moved to the new Department for Science, Innovation and Technology (DSIT). ↩
-
Where subgroup mean scores are compared, the large variation in the data often means that these differences are not statistically significant this is made clear throughout. However, looking at the pattern of mean scores across subgroups, and the direction of travel since the 2016 and 2017 surveys, can still generate valuable insights in these instances. ↩
-
Subgroup differences highlighted are either those that emerge consistently across multiple questions or evidence a particular hypothesis (i.e. not every single statistically significant finding has been commented on). ↩
-
To note, these are private sector education businesses. Results for public sector schools, colleges and universities are covered in the separately published Education Institutions Findings Annex. ↩
-
These aggregated results (for organisations updating managers at least quarterly and at least annually) across this section exclude the proportion of businesses and charities that say they update senior managers each time there is a breach (although these are still included in the base). ↩
-
The charities mentioning their country’s charity regulator are also included in the 7% mentioning a government or public sector information source. ↩
-
The charities mentioning their country’s charity regulator are also included in the 7% mentioning a government or public sector information source. The charities mentioning their country’s charity regulator are also included in the 7% mentioning a government or public sector information source. ↩
-
These extrapolated figures are based on estimates of the total population of businesses (1,444,985 according to the DBT Business Population Estimates 2023) and charities (201,697 when combining the charity registers for England and Wales, Northern Ireland and Scotland). These extrapolated figures are rounded to the nearest thousand. We use the unrounded prevalence estimates in this calculation for example, the unrounded prevalence of cyber security breaches or attacks in businesses is 49.7% (rounding up to 50%, as noted in the main body of this report), so the calculation is 1,444,985 × 49.7%, which rounds to 718,000. ↩
-
The cost estimates in this section are presented to three significant figures, or to the nearest £10 (if under 100). The mean and median scores exclude “don’t know” and “refused” responses. They merge together the answers from respondents who gave a numeric value as well as those who gave only a banded value (because they did not know the exact answer). For the latter, we have imputed numeric values from the given banded values. We lay out this approach in detail in the Technical Annex. ↩
-
These extrapolated figures are based on estimates of the total population of businesses (1,444,985 according to the DBT Business Population Estimates 2023) and charities (201,697, when combining the charity registers for England and Wales, Northern Ireland and Scotland). Across the chapter, any extrapolated figures are rounded to three significant figures (or to the nearest thousand, if under 1 million). We use the unrounded prevalence estimates in this calculation for example, the unrounded prevalence of cyber crime in charities is 13.6% (rounding up to 14%, as noted in the main body of this report), so the calculation is 201,697 × 13.6%, which rounds to 27,000. ↩
-
Similarly to Chapter 4, the cost estimates in Chapter 6 are presented to three significant figures, or to the nearest £10 (if under 100). The mean and median scores exclude “don’t know” and “refused” responses. They merge together the answers from respondents who gave a numeric value as well as those who gave only a banded value (because they did not know the exact answer). ↩
-
In calculating these margins of error, the design effect of the weighting has been taken into account. This lowers the effective base size used in the statistical significance testing. The overall effective base size was 1,398 for businesses (vs. 1,702 in 2023 and 816 in 2022) and 652 for charities (vs. 808 in 2023 and 267 in 2022). ↩