Council Tax: challenges and changes statistical summary
Published 4 August 2022

© Crown copyright 2022
This publication is licensed under the terms of the Open Government Licence v3.0 except where otherwise stated. To view this licence, visit nationalarchives.gov.uk/doc/open-government-licence/version/3 or write to the Information Policy Team, The National Archives, Kew, London TW9 4DU, or email: psi@nationalarchives.gov.uk.
Where we have identified any third party copyright information you will need to obtain permission from the copyright holders concerned.
This publication is available at https://www.gov.uk/government/statistics/council-tax-challenges-and-changes-in-england-and-wales-march-2022/council-tax-stock-of-properties-statistical-summary
About this release:
This release includes statistics on challenges against and changes made to the England and Wales Council Tax valuation lists between 1 April 1993 and 31 March 2022.
Responsible Statistician:
Claire Lyall
Statistical enquiries:
Date of next publication:
Summer 2023
1. Headline facts and figures – 1 April 2021 to 31 March 2022
Challenges against and changes made to the Council Tax Valuation Lists for England (1993) and Wales (2005) in 2021 to 2022:
The number of received challenges in 2021 to 2022 was
49,940
`
Up from 40,850 in 2020 to 2021
The number of resolved challenges in 2021 to 2022 was
46,430
Up from 38,070 in 2020 to 2021
The number of outstanding challenges as at 31 March 2022 was
15,090
Up from 11,580 in 2020 to 2021
The percentage of challenges resulting in no change to the Council Tax band in 2021 to 2022 was
63%
Up from 60% in 2020 to 2021
The number of amendments to the Council Tax lists in 2021 to 2022 was
74,860
Up from 60,590 in 2020 to 2021
2. About these statistics
The statistics in this publication relate to England and Wales only. Property valuations are not carried out by the Valuation Office Agency (VOA) in Scotland and Northern Ireland, where the valuation law and practice differ from England and Wales.
The statistics are available at national, regional and billing authority level.
This publication is released in support of bringing greater transparency to VOA functions. The data are also used to inform government policy and conduct analyses to support the operations of the VOA.
3. Challenges against the Council Tax Valuation Lists for England (1993) and Wales (2005)
These are challenges against the entries in the Council Tax Valuation Lists for England (1993) and Wales (2005). For England before 1 April 2008 and for Wales, this consists of band reviews and appeals. For England from 1 April 2008, this consists of band reviews, proposals, and of these proposals, the number which were sent to the Valuation Tribunal Service for appeal, referred to as appeals.
Figure 1: Number of challenges received and resolved in England and Wales, 1 April 2021 to 31 March 2022
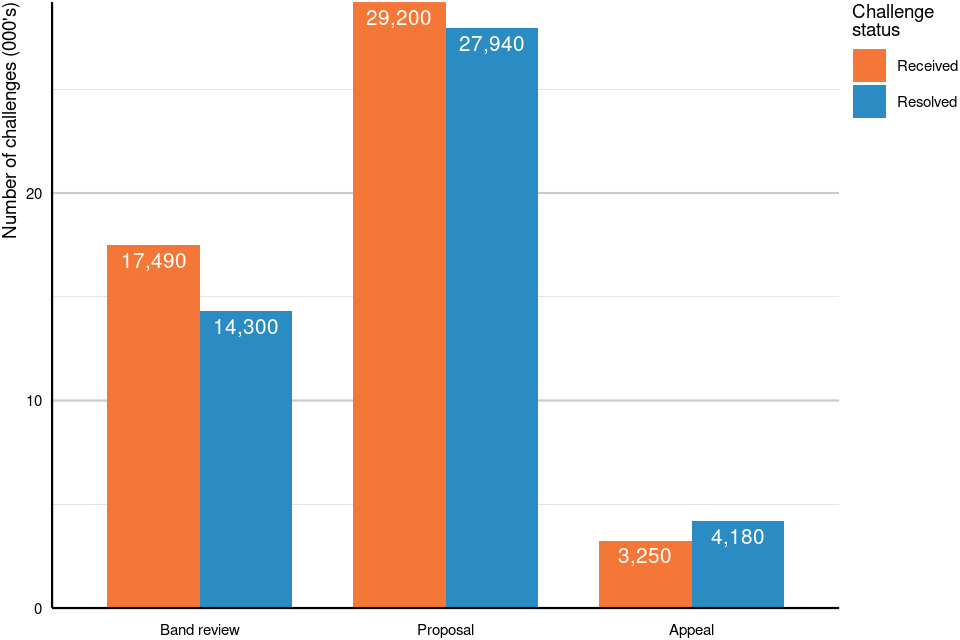
Figure 1
Source: Tables CTCAC1.2 to CTCAC1.4
Figure notes:
Counts are rounded to the nearest 10.
The number of challenges received and resolved between 1 April 2021 and 31 March 2022 are shown in Figure 1.
Of the 49,940 challenges received by VOA in 2021 to 2022, there were 29,200 (58%) proposals, 17,490 (35%) band reviews and 3,250 (7%) appeals.
Of the 46,430 challenges resolved by VOA in 2021 to 2022, there were 27,940 (60%) proposals, 14,300 (31%) band reviews and 4,180 (9%) appeals. Of these:
-
63% resulted in no change to the council tax band
-
29% resulted in a reduction to the council tax band
-
less than 1% resulted in an increase to the council tax band
-
5% resulted in a property being deleted from the Council Tax list
-
2% resulted in a new entry to the list
-
2% resulted in either a property being split or multiple properties being merged
Figure 2: Number of challenges outstanding in England and Wales, 31 March 2022
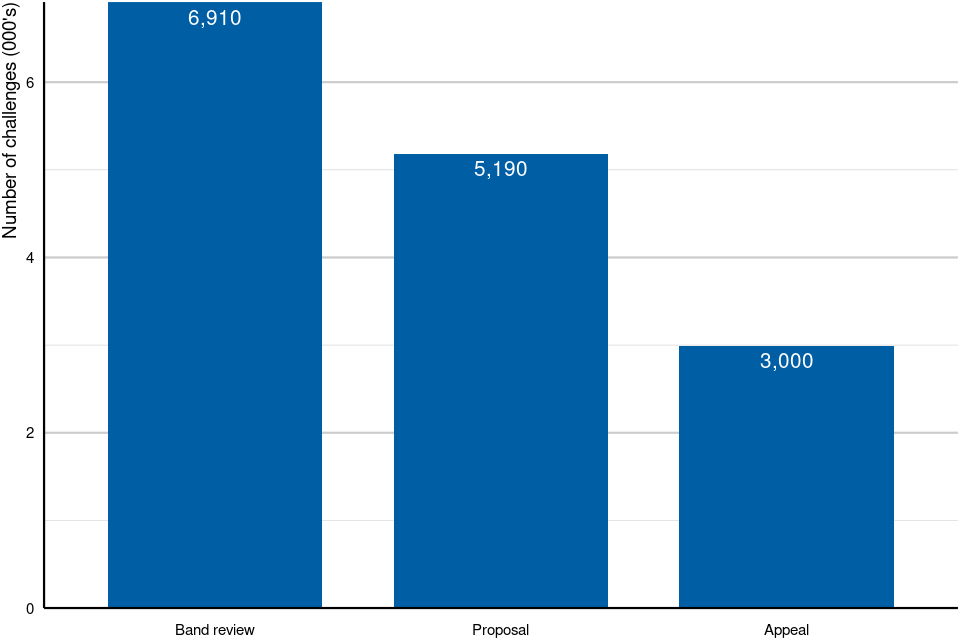
Figure 2
Source: Tables CTCAC1.2 to CTCAC1.4
Figure notes:
Counts are rounded to the nearest 10.
The number of challenges outstanding at 31 March 2022 is shown in Figure 2.
Of the 15,090 challenges outstanding at 31 March 2022, there were 6,910 (46%) band reviews, 5,190 (34%) proposals and 3,000 (20%) appeals.
4. Band reviews
Band reviews were introduced in the 2004 to 2005 financial year. A band review is carried out when the taxpayer brings a potential inaccuracy to the attention of the VOA. The taxpayer must provide sufficient evidence to the VOA to show why they consider their council tax band to be incorrect. The VOA will investigate the matter and inform the taxpayer of the outcome. The taxpayer does not have the right to appeal the outcome of a band review.
Figures 3 and 4 show the number of band reviews received between 1 April 2004 and 31 March 2022.
Following the introduction of a new Council Tax list on 1 April 2005 in Wales, there was an increase in the number of band reviews received for Welsh properties, which constituted most of the total band reviews received in 2005 to 2006. Media campaigns began in early 2007 which drew public attention to the process of taxpayers challenging their council tax band, consequently, the number of band reviews increased.
From October 2015, a change in VOA standard practice to only raise band reviews when sufficient evidence is brought to its attention likely contributed to the reduction in band reviews. Between October 2015 and January 2022 the number of band reviews received and resolved was relatively stable.
On 3 February 2022, the Government announced that households in Council Tax bands A to D in England would receive a £150 rebate on their Council Tax bills. Following this announcement, the VOA received an increase in band reviews as taxpayers challenged their council tax band.
Figure 3: Number of band reviews received and resolved in England, 1 April 2004 to 31 March 2022
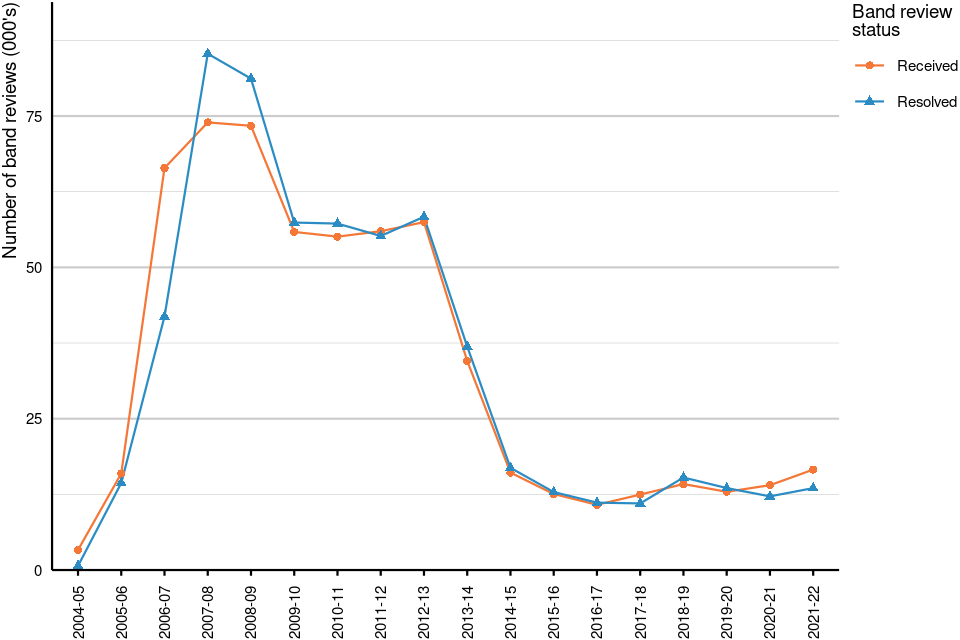
Figure 3
Source: Tables CTCAC4.1 & CTCAC4.2
Figure 4: Number of band reviews received and resolved in Wales, 1 April 2004 to 31 March 2022
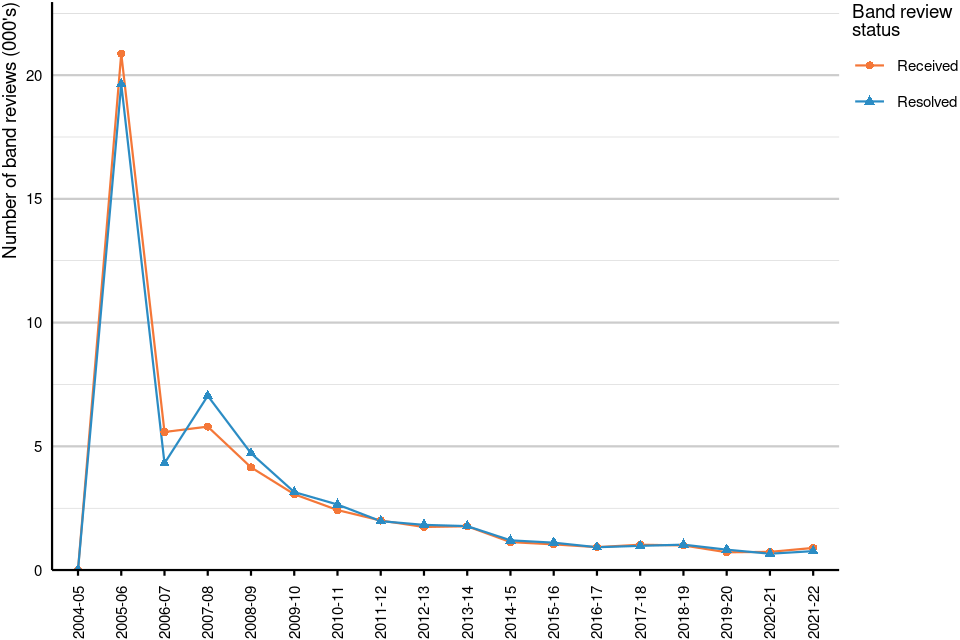
Figure 4
Source: Tables CTCAC4.1 & CTCAC4.2
4.1 Outstanding band reviews
The number of band reviews outstanding spiked following their introduction in the 2004 to 2005 financial year until 2007, but since 2007 the number outstanding reduced steadily.
The number of outstanding band reviews started to increase since 31 March 2020 and increased in each of the last two years (figure 5).
In 2021 to 2022, the VOA resolved 14,300, which is 11% more than the 12,830 resolved in 2020 to 2021. This was more than counter-balanced by an increase of 19% over the same period of band reviews VOA received by 17,490 in 2021 to 2022 compared with 14,750 in 2020 to 2021. The increase in received band reviews is attributable to the £150 Council Tax rebate announced by the government. Figure 5 shows the number of band reviews outstanding at 31 March of each year from 2005 to 2022.
Figure 5: Number of band reviews outstanding in England and Wales, 31 March 2005 to 31 March 2022
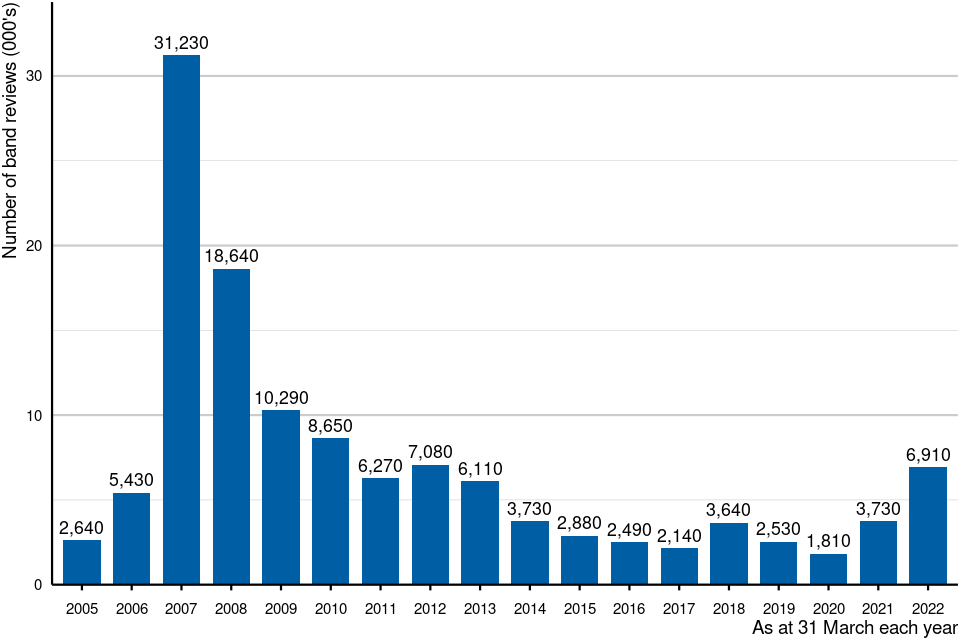
Figure 5
Source: Table CTCAC4.3
Figure notes:
Counts are rounded to the nearest 10.
4.2 Outcomes of band reviews
Band reviews can either result in a Council Tax band increase, a Council Tax band decrease or no change to the Council Tax band. Between 1 April 2021 and 31 March 2022, 59% of band reviews resolved resulted in no change to the Council Tax Band, 41% resulted in a reduction to the band and less than 1% resulted in an increase to the band.
Figure 6: Outcomes of band reviews resolved in England and Wales, 1 April 2004 to 31 March 2022
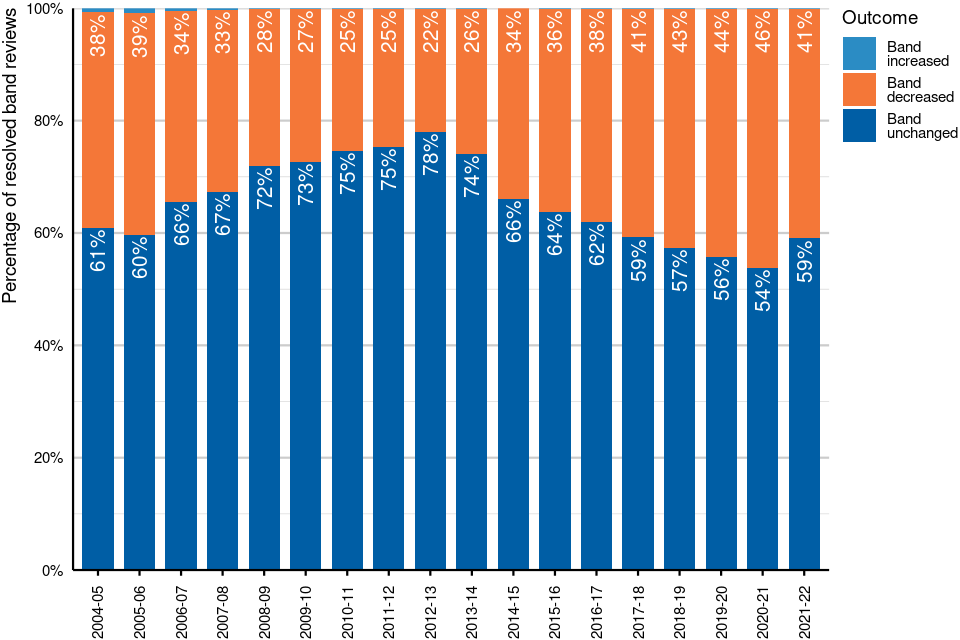
Figure 6
Source: Table CTCAC4.2
Figure notes:
Please note that the percentage labels are displayed for the outcomes of ‘Band decreased’ and ‘Band unchanged’ only; therefore, the percentages will not sum to 100 per cent for each year.
Table 1: Outcomes of band reviews resolved in England and Wales, 1 April 2004 to 31 March 2022
| Financial year | Band increased | Band decreased | Band unchanged | Total |
| 2004-05 | 10 | 260 | 410 | 680** |
| 2005-06 | 310 | 13,420 | 20,270 | 34,010 |
| 2006-07 | 230 | 15,690 | 30,270 | 46,190 |
| 2007-08 | 200 | 30,040 | 62,100 | 92,340 |
| 2008-09 | 110 | 24,010 | 61,780 | 85,900 |
| 2009-10 | 80 | 16,460 | 44,010 | 60,560 |
| 2010-11 | 40 | 15,180 | 44,660 | 59,880 |
| 2011-12 | 40 | 14,060 | 43,070 | 57,160 |
| 2012-13 | 30 | 13,200 | 46,960 | 60,190 |
| 2013-14 | 10 | 10,020 | 28,650 | 38,690 |
| 2014-15 | – | 6,120 | 11,950 | 18,080 |
| 2015-16 | 10 | 5,050 | 8,920 | 13,990 |
| 2016-17 | 10 | 4,580 | 7,470 | 12,060 |
| 2017-18 | 10 | 4,880 | 7,100 | 11,990 |
| 2018-19 | 10 | 6,960 | 9,340 | 16,310 |
| 2019-20 | 20 | 6,350 | 8,000 | 14,360 |
| 2020-21 | 20 | 5,910 | 6,910 | 12,830 |
| 2021-22 | 20 | 5,840 | 8,440 | 14,300 |
Source: Table CTCAC4.2
Table notes:
Counts are rounded to the nearest 10 with counts of 0 being reported as 0 and counts fewer than 5 reported as negligible and denoted by ‘–’. Totals may not sum due to rounding.
Figure 6 and Table 1 show the outcomes of band reviews resolved between 1 April 2004 and 31 March 2022. In 2021 to 2022, 41% resulted in a band decrease and 59% resulted in no change to the band, in 2020 to 2021, the figures were 46% and 54% respectively.
5. Proposals in England since 1 April 2008
A proposal is a formal challenge to a Council Tax list entry. There are limited circumstances under which a proposal can be accepted; for example, a new occupier can make a proposal within the first six months of becoming the taxpayer for their home. If the taxpayer has a statutory right to make a proposal, unlike band reviews, they do not need to provide evidence upfront that the banding is wrong. In England since 1 April 2008, the VOA will review the proposal and provide the taxpayer with a written decision, usually within two months; the taxpayer then has up to three months to appeal to a Valuation Tribunal (VT). In Wales, and in England before 1 April 2008, the VOA transmits all proposals to the Valuation Tribunal Service (VTS) for appeal within 30 days of receiving them. Therefore, only proposals in England since 1 April 2008 are included in these statistics.
The numbers of proposals received and resolved in each year track each other consistently, though there has been considerable fluctuation in the number of proposals received over the years. Numbers started to increase in 2012 to 2013, but since 2016 to 2017 there has been a general decline, except for an uptick in 2019 to 2020 and then again in 2021 to 2022. Figure 7 shows the number of proposals received between 1 April 2008 and 31 March 2022
Figure 7: Number of proposals received and resolved in England, 1 April 2008 to 31 March 2022
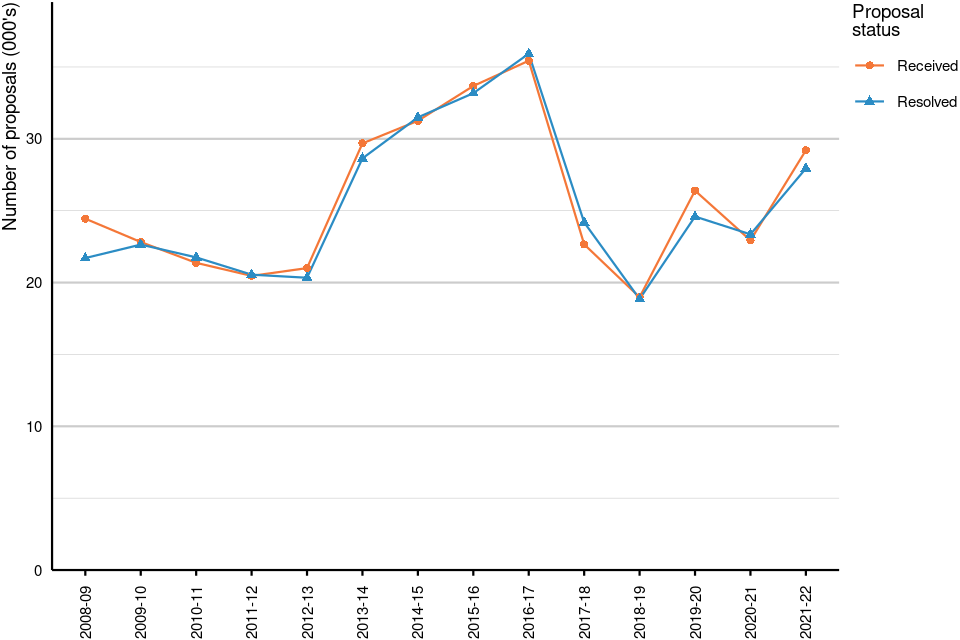
Figure 7
Source: Tables CTCAC5.1 & CTCAC5.2
5.1 Outstanding proposals
Over the years, numbers of unresolved proposals generally will reflect the number of proposals received and resolved. The temporary reduction in rates of Stamp Duty Land Tax ended on 30 September 2021 and during 2021 to 2022, the VOA received an increase in proposals from new taxpayers challenging their council tax band. The VOA received a 27% increase in proposals from 22,940 received in 2020 to 2021 to 29,200 in 2021 to 2022. Over the same period, VOA resolved 27,940, which is 20% more than the 23,360 resolved the previous year. Consequently, the number of outstanding proposals has increased at 31 March 2022. There were 5,190 proposals outstanding at 31 March 2022; this is 32% higher than the 3,920 outstanding at 31 March 2021.
Figure 8: Number of proposals outstanding in England, 31 March 2009 to 31 March 2022
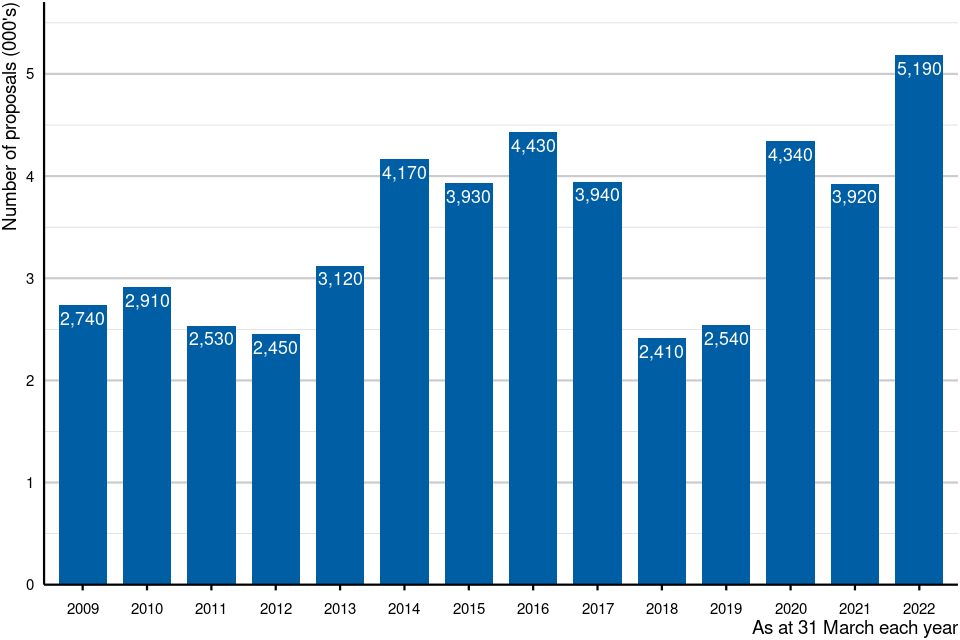
Figure 8
Source: Table CTCAC5.3
Figure notes:
Counts are rounded to the nearest 10.
5.2 Outcomes of proposals
Proposals can result in a Council Tax band increase, a Council Tax band decrease, no change to the Council Tax band, a new entry to the Council Tax list, a deleted entry from the list or a property on the list being either split or merged. Of the proposals resolved between 1 April 2021 and 31 March 2022:
-
65% resulted in no change to the Council Tax Band
-
24% resulted in a reduction to the band
-
less than 1% resulted in an increase to the band
-
7% resulted in a property being deleted from the Council Tax list
-
3% resulted in a new entry to the list
-
2% resulted in either a property being split or multiple properties being merged.
Figure 9: Outcomes of proposals resolved in England, 1 April 2008 to 31 March 2022
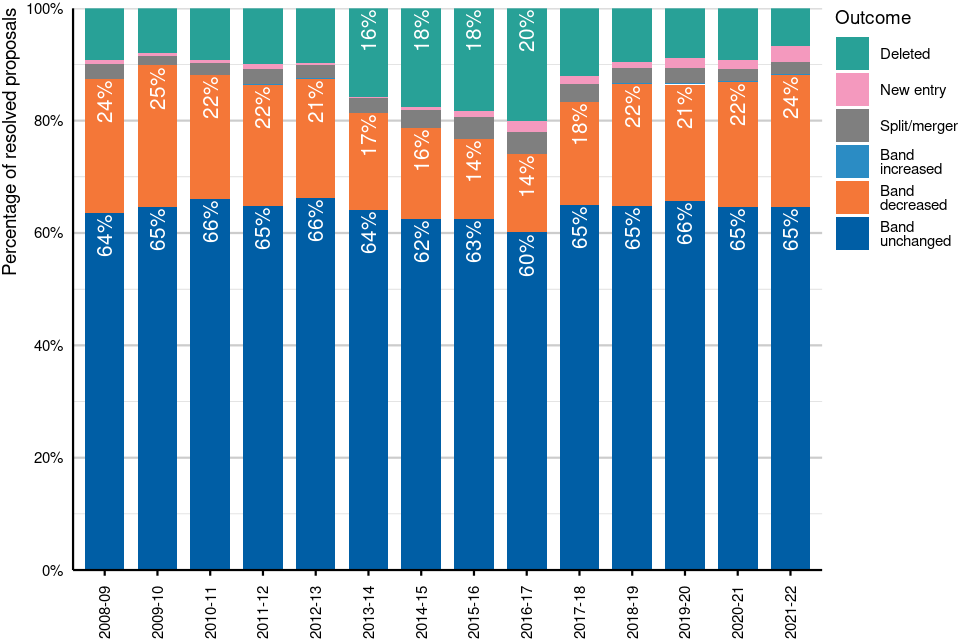
Figure 9
Source: Table CTCAC5.2
Figure notes:
Please note that the percentage labels are only displayed for the outcomes of ‘Band decreased’ and ‘Band unchanged’, as well as for any other outcome that accounts for at least 15 per cent of the total in the year. Therefore, the percentages will not sum to 100 per cent for each year.
Table 2: Outcomes of proposals resolved in England, 1 April 2008 to 31 March 2022
| Financial year | Band increased | Band decreased | Band unchanged | Deleted | Split/merger | New entry | Total |
| 2008-09 | 10 | 5,180 | 13,800 | 1,990 | 570 | 170 | 21,710 |
| 2009-10 | 10 | 5,700 | 14,640 | 1,800 | 390 | 110 | 22,640 |
| 2010-11 | 10 | 4,790 | 14,370 | 1,980 | 480 | 120 | 21,750 |
| 2011-12 | 10 | 4,430 | 13,330 | 2,030 | 570 | 190 | 20,550 |
| 2012-13 | 10 | 4,330 | 13,470 | 2,000 | 470 | 60 | 20,340 |
| 2013-14 | 10 | 4,930 | 18,380 | 4,510 | 730 | 90 | 28,640 |
| 2014-15 | 10 | 5,110 | 19,660 | 5,550 | 990 | 180 | 31,490 |
| 2015-16 | 20 | 4,700 | 20,750 | 6,090 | 1,300 | 330 | 33,180 |
| 2016-17 | 20 | 5,020 | 21,590 | 7,230 | 1,390 | 680 | 35,920 |
| 2017-18 | 20 | 4,420 | 15,730 | 2,920 | 770 | 330 | 24,190 |
| 2018-19 | 20 | 4,110 | 12,210 | 1,790 | 500 | 220 | 18,850 |
| 2019-20 | 50 | 5,100 | 16,160 | 2,160 | 690 | 440 | 24,590 |
| 2020-21 | 20 | 5,200 | 15,110 | 2,150 | 500 | 380 | 23,360 |
| 2021-22 | 30 | 6,590 | 18,050 | 1,860 | 590 | 810 | 27,940 |
Source: Table CTCAC5.2
Table notes:
Counts are rounded to the nearest 10 with counts of 0 being reported as 0. Totals may not sum due to rounding.
Figure 9 and Table 2 show that the percentage of proposals resulting in each outcome in 2021 to 2022 has remained similar to figures from previous years. In 2021 to 2022, 24% of proposals resulted in a band decrease and 65% resulted in no change to the band. In 2020 to 2021, these figures were 22% and 65% respectively.
6. Appeals in England from 1 April 2008
In England since 1 April 2008, the VOA will review a proposal and provide the taxpayer with a written decision, usually within two months; the taxpayer then has up to three months to appeal this decision to an independent Valuation Tribunal (VT). In order to demonstrate the connection between proposals and appeals, appeals are recorded using the date that their associated proposal was resolved.
Currently, the appeal process at the Valuation Tribunal Service (VTS) takes about 9 months, from submission of an appeal form to final decision. Due to the time taken to complete the appeals process 1,690, proposals resolved in 2021 to 2022 that were subsequently appealed are sitting in the appeal process at the VTS. Therefore the resolution of proposals in 2021 to 2022 represents an interim position as many cases proceed to Tribunal which means they are settled later.
Figure 10: Percentage of proposal decisions which were appealed in England, 1 April 2008 to 31 March 2022
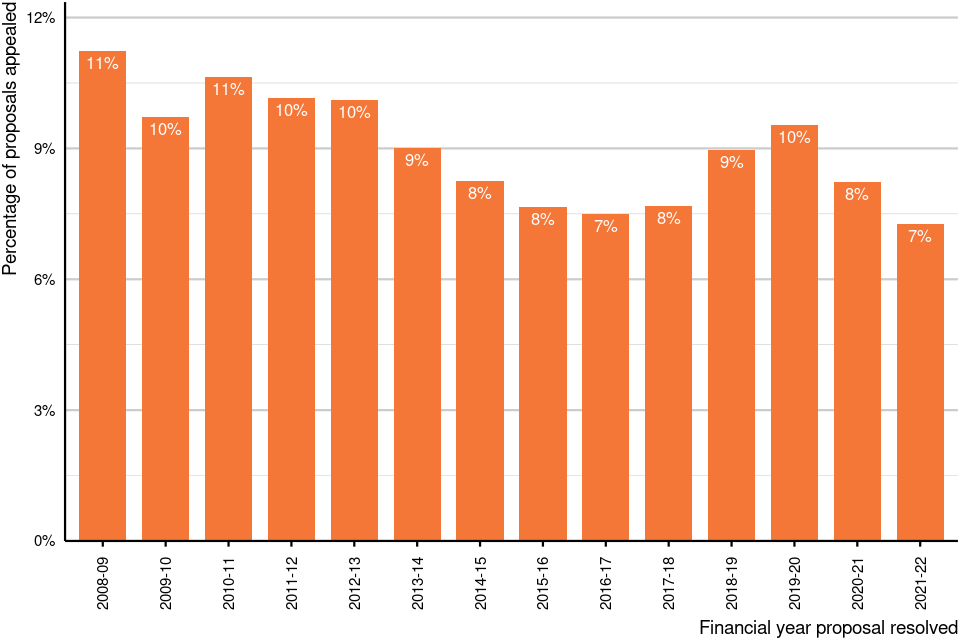
Figure 10
Source: Table CTCAC5.2
Figure 10 shows the percentage of proposals resolved that were subsequently appealed, by the year that the proposal was resolved. Over the years, these percentages have remained fairly steady, ranging from 7% to 11%. Of the 27,940 proposals resolved in 2021 to 2022, 0% were subsequently appealed; this is lower than the 0% in 2020 to 2021.
6.1 Outcomes of appeals in England from 1 April 2008
Appeals are often withdrawn or settled before reaching the Valuation Tribunal.
Figure 11: Percentage of appeals resolved without a tribunal and resolved at tribunal in England, 1 April 2008 to 31 March 2022

Figure 11
Source: Table CTCAC5.2
Figure notes:
The bars outlined with a dashed line represent the interim position that will be revised in next year’s release as appealed cases proceed to Tribunal and the VOA are notified of the outcome.
Please note that the percentage labels are displayed for the outcomes of ‘Band decreased’ and ‘Band unchanged’ only. Therefore, the percentages may not sum to 100 per cent for each year.
Figure 11 shows the percentage of appeals resolved without a tribunal and at tribunal, by the year that the associated proposal was resolved. In the ‘Council Tax Challenges and Changes in England and Wales, March 2021’ release, we reported that 15% of appeals were resolved at tribunal where the associated proposal was resolved in 2020 to 2021. This has now increased to 54%. In 2021 to 2022 the percentage of appeals resolved at tribunal is 17%. The VOA expects this figure to increase as the proposals resolved in 2021 to 2022 which have been subsequently appealed are resolved at tribunal and the VOA notified of the outcome.
Figure 12: Proposals resolved in England from 1 April 2020 to 31 March 2021 with the action taken by the taxpayer following the issuing of the decision notice
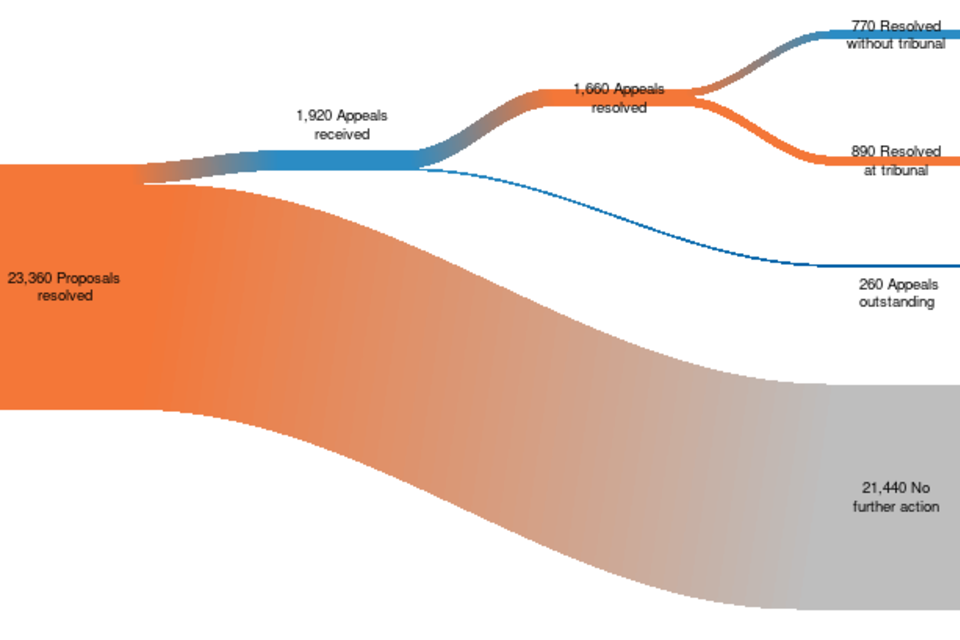
Figure 12
Source: Table CTCAC5.2
Figure notes:
Counts are rounded to the nearest 10.
In 2020 to 2021, 23,360 proposals were resolved (figures 7 and 12) and 1,920 (8%) of those proposals were subsequently appealed (figures 10 and 12). Of the proposals that were subsequently appealed, 1,660 were resolved as at 31 March 2022 (table 2 and figure 12); 770 (46%) of them were resolved without a tribunal and 890 (54%) required a tribunal (figures 11 and 12).
In 2021 to 2022 27,940 proposals were resolved (figure 7) and 2,030 (7%) of those proposals were subsequently appealed (figure 10). Of the proposals that were subsequently appealed, 340 were resolved at 31 March 2022 (table 2). These figures will be revised in next year’s release.
Appeals, like proposals, can result in a Council Tax band increase, a Council Tax band decrease, no change to the Council Tax band, a new entry to the Council Tax list, a deleted entry from the list, or a property on the list being either split or merged.
Figure 13: Outcomes of resolved appeals in England, 1 April 2008 to 31 March 2022
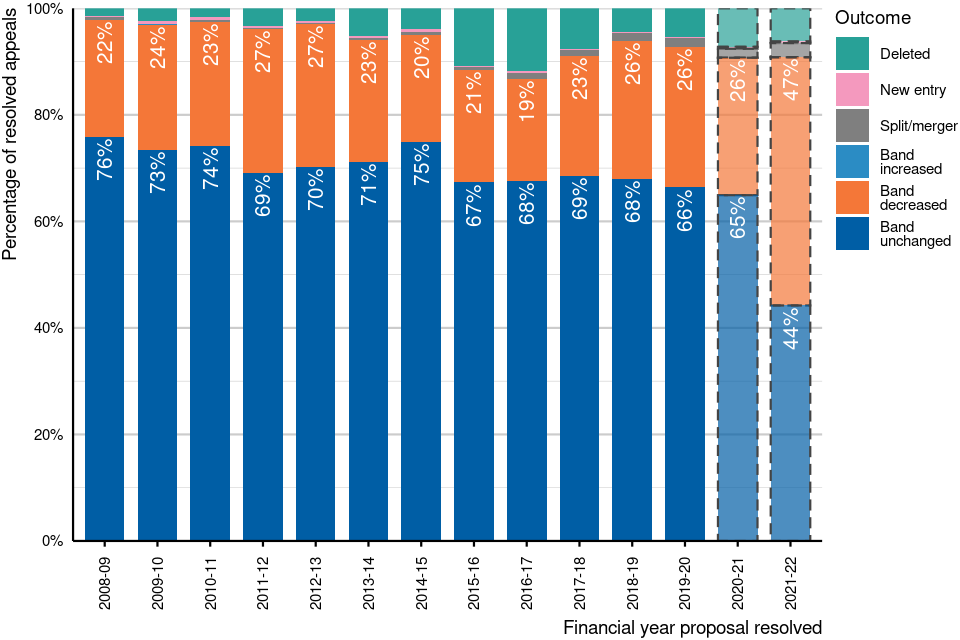
Figure 13
Source: Table CTCAC5.2
Figure notes:
The bars outlined with a dashed line represent the interim position that will be revised in next year’s release as appealed cases proceed to Tribunal and the VOA are notified of the outcome.
Please note that the percentage labels are displayed for the outcomes of ‘Band decreased’ and ‘Band unchanged’ only. Therefore, the percentages will not sum to 100 per cent for each year.
Figure 13 shows the outcomes of resolved appeals since 1 April 2008, by the year that the associated proposal was resolved. Of the resolved appeals where the associated proposal was resolved in 2021 to 2022, 47% of proposals resulted in a band decrease, 44% resulted in no change to the band and 6% resulted in a deletion. These figures will be revised in next year’s release. In 2020 to 2021, these figures were 26%, 65% and 7% respectively.
6.2 Outstanding appeals
Table 3: Number of appeals outstanding in England by the financial year that the associated proposal was resolved, 1 April 2008 to 31 March 2022
| Financial year proposal resolved | Outstanding appeals |
| 2008-09 | 0 |
| 2009-10 | 0 |
| 2010-11 | 0 |
| 2011-12 | 0 |
| 2012-13 | – |
| 2013-14 | 0 |
| 2014-15 | – |
| 2015-16 | – |
| 2016-17 | – |
| 2017-18 | 10 |
| 2018-19 | 10 |
| 2019-20 | 120 |
| 2020-21 | 260 |
| 2021-22 | 1,690 |
| Total | 2,100 |
Source: Table CTCAC5.2
Table notes:
Counts are rounded to the nearest 10 with counts of 0 being reported as 0 and counts fewer than 5 reported as negligible and denoted by ‘–’.
Table 3 shows the number of appeals outstanding at 31 March 2022, by the financial year that the associated proposal was resolved. Currently, the appeal process at the Valuation Tribunal Service takes about 9 months, from submission of an appeal form to final decision, resulting in a high number of outstanding appeals as at 31 March 2022, where 2,100 were outstanding in England. Of these, 1,690 (80.6%) were from proposals resolved in 2021 to 2022 and 260 (12.6%) were from proposals resolved in 2020 to 2021. A small number of complex cases remain outstanding from earlier years.
7. Appeals in Wales
The proposal system in Wales differs from the system in England that was introduced on 1 April 2008. All proposals received in Wales, if unresolved, are automatically transmitted as appeals to Valuation Tribunal Service (VTS) within thirty days of receiving them.
Figure 14: Number of appeals received and resolved in Wales, 1 April 1993 to 31 March 2022
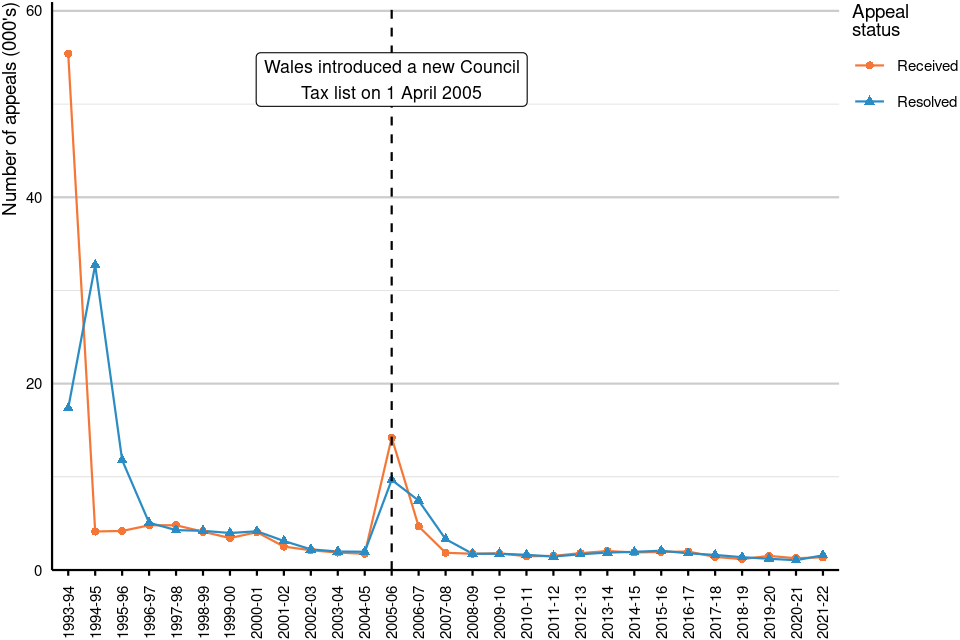
Figure 14
Source: Table CTCAC6.2
Figure 14 shows the spike of appeals that were submitted in 2005 to 2006. This was due to the new Council Tax list that was introduced in Wales on 1 April 2005.
Figure 15: Number of appeals received and resolved in Wales, 1 April 2017 to 31 March 2022
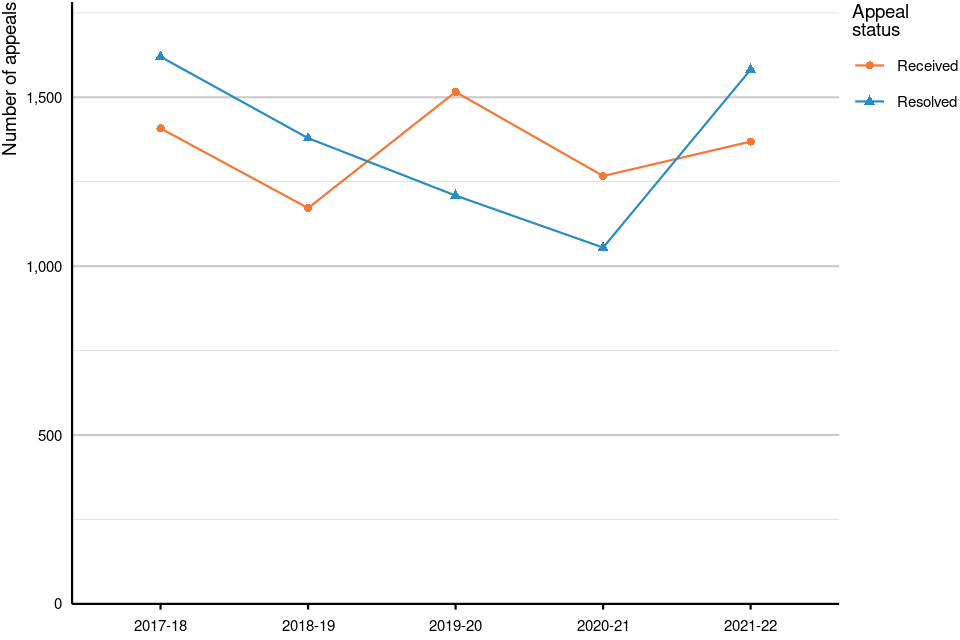
Figure 15
Source: Table CTCAC6.2
Figure 15 shows the number of appeals received and resolved between 1 April 2017 and 31 March 2022. These numbers have been decreasing over the years, however, there was an uptick in the number of appeals received in 2019 to 2020. This could be attributable to the implementation of Council Tax changes in Wales where empty or second homes may be charged a Council Tax premium of up to 100%.
7.1 Outcomes of appeals in Wales
Figure 16: Percentage of appeals resolved without a tribunal and resolved at tribunal in Wales, 1 April 2005 to 31 March 2022
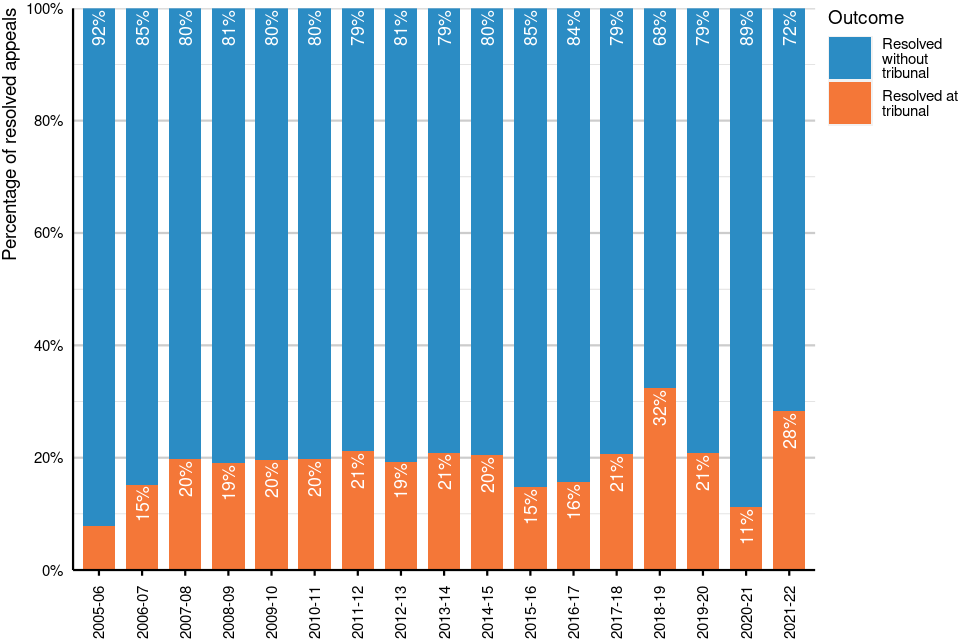
Figure 16
Source: Table CTCAC6.2
Figure notes:
Please note that in years where the outcome of ‘Resolved at tribunal’ accounts for less than 10 per cent of the total, the percentage labels are displayed for the outcome of ‘No tribunal required’ only. Therefore, the percentages will not sum to 100 per cent for these years.
Figure 16 shows the percentage of appeals resolved without a tribunal and resolved at tribunal in Wales from 1 April 2005 to 31 March 2022. In each year, the percentage of appeals resolved without a tribunal is significantly higher than the percentage resolved at tribunal, ranging from 68% to 92%. The year with the highest percentage of appeals that were resolved at tribunal was 2018 to 2019, with 32%. In 2020 to 2021 only 120 (11%) appeals were resolved at tribunal. This is likely due to the tribunal courts being closed for much of the financial year due to the Covid-19 pandemic. Of the 1,580 appeals resolved in 2021 to 2022 in Wales, 72% were resolved without a tribunal and 28% required a tribunal.
Of the appeals resolved in Wales between 1 April 2021 and 31 March 2022:
-
57% resulted in no change to the Council Tax Band
-
20% resulted in a reduction to the band
-
less than 1% resulted in an increase to the band
-
13% resulted in a property being deleted from the Council Tax list
-
3% resulted in a new entry to the list
-
6% resulted in either a property being split or multiple properties being merged.
Figure 17: Outcomes of appeals resolved in Wales, 1 April 2005 to 31 March 2022
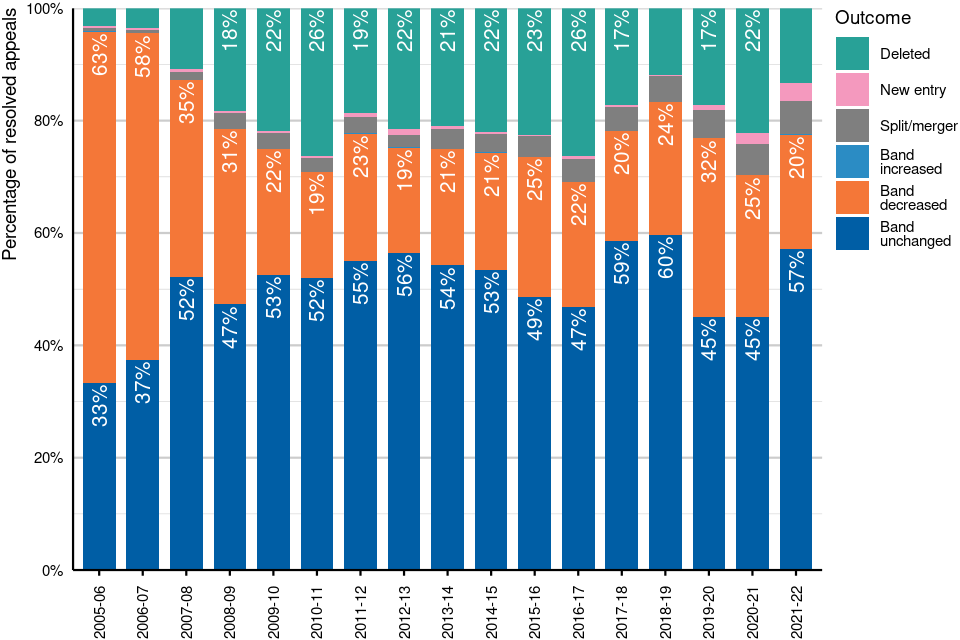
Figure 17
Source: Table CTCAC6.2
Figure notes:
Please note that the percentage labels are only displayed for the outcomes of ‘Band decreased’ and ‘Band unchanged’, as well as for any other outcome that accounts for at least 15 per cent of the total in the year. Therefore, the percentages will not sum to 100 per cent for each year.
Table 4: Outcomes of appeals resolved in Wales, 1 April 2005 to 31 March 2022
| Financial year | Band increased | Band decreased | Band unchanged | Deleted | Split/merger | New entry | Total |
| 2005-06 | 10 | 6,050 | 3,210 | 300 | 60 | 40 | 9,670 |
| 2006-07 | 10 | 4,330 | 2,790 | 260 | 40 | 30 | 7,450 |
| 2007-08 | 0 | 1,160 | 1,730 | 360 | 50 | 20 | 3,320 |
| 2008-09 | 0 | 550 | 830 | 320 | 50 | 10 | 1,750 |
| 2009-10 | 0 | 390 | 920 | 380 | 50 | 10 | 1,750 |
| 2010-11 | 0 | 310 | 850 | 430 | 40 | 10 | 1,630 |
| 2011-12 | – | 330 | 800 | 270 | 40 | 10 | 1,450 |
| 2012-13 | – | 320 | 950 | 360 | 40 | 20 | 1,690 |
| 2013-14 | 0 | 390 | 1,020 | 390 | 70 | 10 | 1,870 |
| 2014-15 | – | 410 | 1,040 | 430 | 60 | 10 | 1,950 |
| 2015-16 | 0 | 520 | 1,010 | 470 | 80 | – | 2,070 |
| 2016-17 | 0 | 400 | 840 | 470 | 80 | 10 | 1,790 |
| 2017-18 | – | 320 | 950 | 280 | 70 | 10 | 1,620 |
| 2018-19 | 0 | 330 | 820 | 160 | 60 | – | 1,380 |
| 2019-20 | 0 | 390 | 540 | 210 | 60 | 10 | 1,210 |
| 2020-21 | 0 | 270 | 480 | 240 | 60 | 20 | 1,060 |
| 2021-22 | – | 320 | 910 | 210 | 90 | 50 | 1,580 |
Source: Table CTCAC6.2
Table notes:
Counts are rounded to the nearest 10 with counts of 0 being reported as 0 and counts fewer than 5 reported as negligible and denoted by ‘–’. Totals may not sum due to rounding.
Figure 17 and table 4 show the outcomes of resolved appeals in Wales from 1 April 2005 to 31 March 2022. Due to the relatively small number of appeals resolved each year (table 4), the percentages of appeals resulting in each outcome vary significantly over the years.
7.2 Appeals outstanding in Wales
Figure 18: Number of appeals outstanding in Wales, 31 March 1994 to 31 March 2022
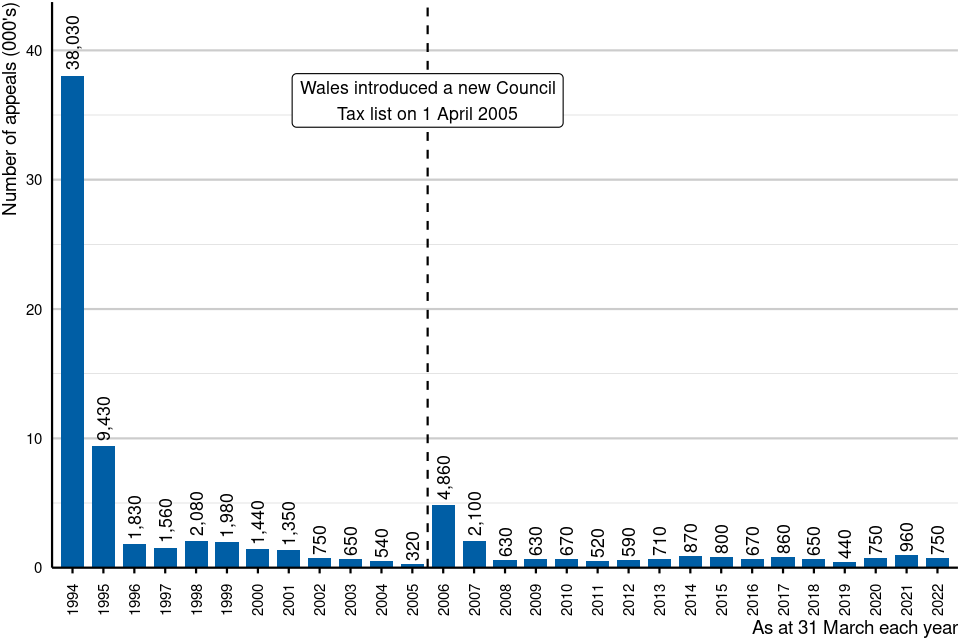
Figure 18
Source: Table CTCAC6.2
Figure notes:
Counts are rounded to the nearest 10.
Figure 18 shows the brief spike in outstanding appeals after the introduction of the new Council Tax list on 1 April 2005.
Figure 19: Number of appeals outstanding in Wales, 31 March 2018 to 31 March 2022
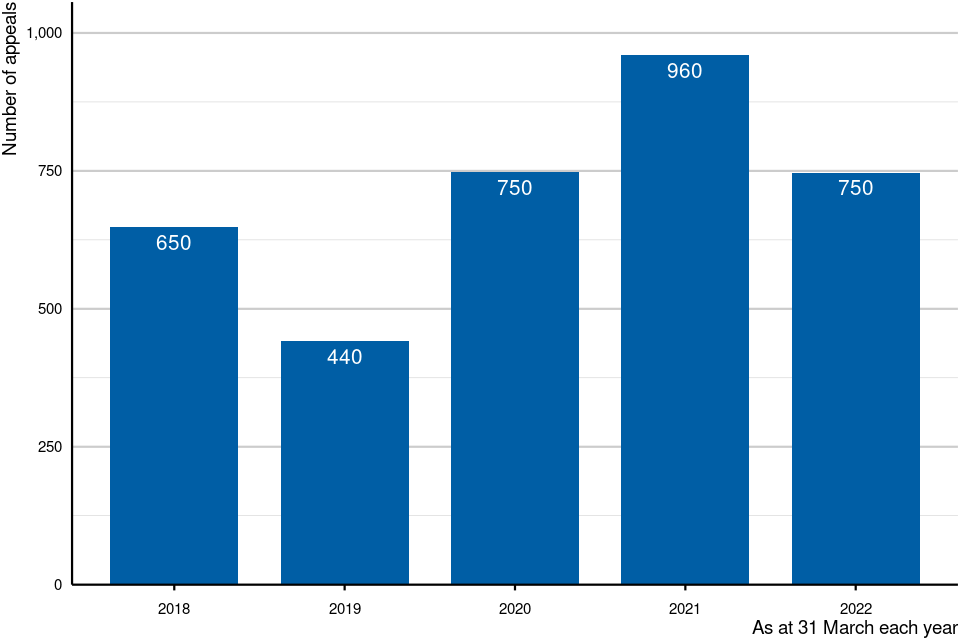
Figure 19
Source: Table CTCAC6.2
Figure notes:
Counts are rounded to the nearest 10.
Figure 19 shows the number of appeals outstanding in Wales from 31 March 2018 to 31 March 2022. The number of appeals outstanding has fluctuated over these years; there were 750 appeals outstanding at 31 March 2022, which is 22% lower than the 960 outstanding at 31 March 2021.
8. Amendments to the Council Tax Valuation Lists for England (1993) and Wales (2005)
Amendments are changes that have been made as a result of either a challenge or a report. A report happens when the VOA has been made aware of a change to the property that warrants a change in the valuation list entry (for example, when a house is extended and subsequently sold). This may result in a band increase, band decrease or no change to the Council Tax band; even when the band is unchanged, property attribute details (e.g. number of bedrooms) may have been updated on the VOA’s administrative system.
In this publication, amendments do not include properties that have been deleted from the CT Valuation Lists, inserted to the CT Valuation Lists or properties amended on the CT Valuation Lists as a result of being split or merged. These are reported in our Council Tax Stock of Properties release, published on 26 May 2022.
Figure 20: Number of amendments to Council Tax Valuation Lists in England and Wales, 1 April 2021 to 31 March 2022
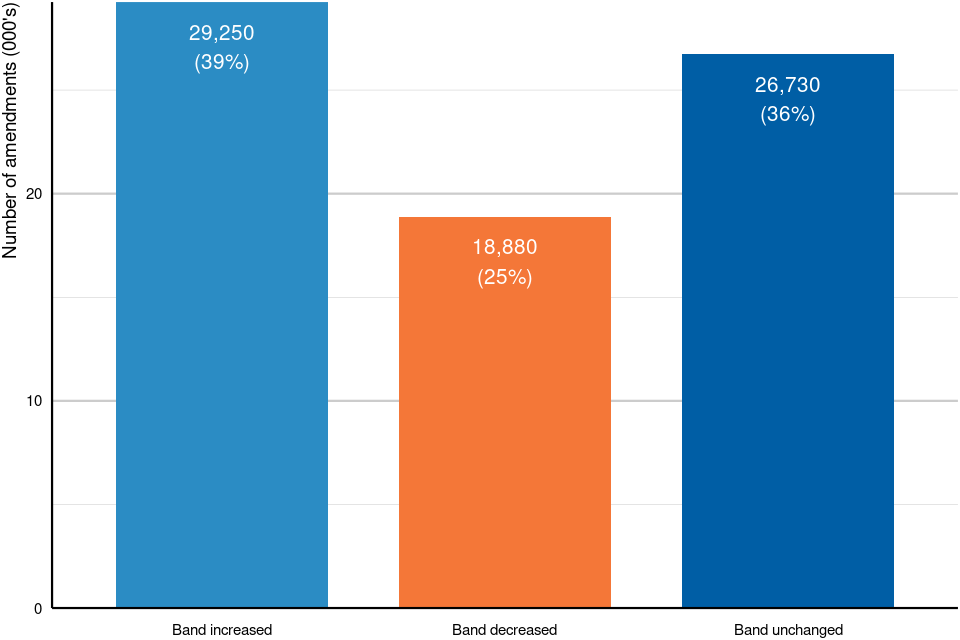
Figure 20
Source: Table CTCAC2.1
Figure 20 shows the amendments made to the Council Tax Valuation Lists between 1 April 2021 and 31 March 2022 as a result of both challenges and reports. Of the 74,860 amendments, 39% resulted in an increased council tax band, 25% resulted in a reduction to the council tax band and 36% resulted in no change to the council tax band.
Between 1 April 2020 and 31 March 2021, there were 60,590 amendments made to the Council Tax Valuation Lists as a result of both challenges and reports. Following the sale of a property with an improvement indicator, the VOA will review the Council Tax band of the property. There was an increase in the number of properties sold during 2021 to 2022, attributable in part to the temporary reduced rates of Stamp Duty Land Tax during part of this period. As a consequence, VOA received an increase in the number of properties to review their Council Tax band resulting in an increase in the number of amendments between 1 April 2021 and 31 March 2022.
9. Further Information
Further information about the data and methodology presented in this summary can be found in the Background Information.
GOV.UK has more information on:
Timings of future releases are regularly placed on the VOA research and statistics calendar.