Statistical bulletin - Civil Service Ethnicity Pay Gap Statistics: 2025
Updated 29 October 2025

© Crown copyright 2025
This publication is licensed under the terms of the Open Government Licence v3.0 except where otherwise stated. To view this licence, visit nationalarchives.gov.uk/doc/open-government-licence/version/3 or write to the Information Policy Team, The National Archives, Kew, London TW9 4DU, or email: psi@nationalarchives.gov.uk.
Where we have identified any third party copyright information you will need to obtain permission from the copyright holders concerned.
This publication is available at https://www.gov.uk/government/statistics/civil-service-statistics-2025/statistical-bulletin-civil-service-ethnicity-pay-gap-statistics-2025
Statistical Enquiries: Toni Clarke
Press Enquiries: Alex Hunt
Next Publication: October 2026
Download Table G - Ethnicity Pay Gap Statistics 2025
View the 2025 Civil Service ethnicity pay gap dashboard
1. Overview
This bulletin presents ethnicity pay gap statistics on the UK Civil Service workforce, as at 31 March 2025.
This is the first year that comprehensive ethnicity pay gap statistics have been published on the Civil Service and will provide a robust benchmark against which future statistics can be compared.
The main sections of this bulletin headline with the median measure of the ethnicity pay gaps with all equivalent mean gaps provided separately at Annex C. All measures can be downloaded here. Please see the notes section for more details on median and mean measures.
Key Findings for 2025:
-
The statistics show that White civil servants have higher hourly earnings and bonuses than both Black and Asian civil servants (for both median and mean).
-
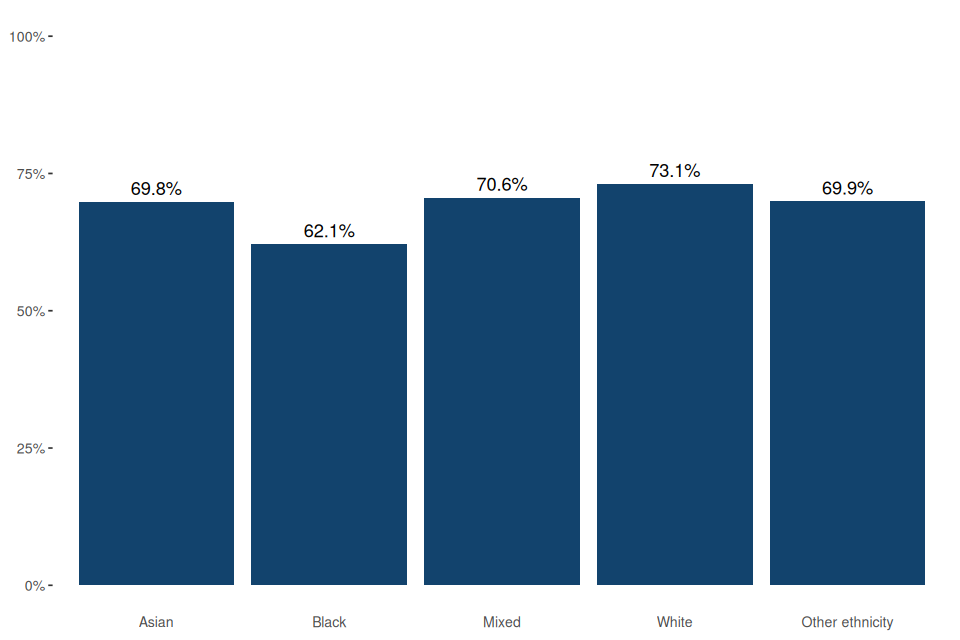
White civil servants are more likely to receive a bonus (73.1%) compared to all other ethnic groups, with Black civil servants the least likely (62.1%).
-
White civil servants are overrepresented in both of the highest earnings pay quartiles whilst Asian civil servants are overrepresented in both of the lowest earnings pay quartiles.
-
In London and outside London, White civil servants’ earnings and bonuses are higher than each of the four other ethnic groups.
-
Earnings pay gap statistics vary widely by department. All departmental statistics are provided at Table G - Ethnicity Pay Gap Statistics 2025 as well as the 2025 Civil Service ethnicity pay gap dashboard.
2. Median ethnicity earnings pay gaps for the Civil Service
This section provides the headline median earnings pay gaps for the Civil Service in 2025.
Statistical note: Interpreting the pay gap grids
There are five different ethnic groups presented in these statistics (see notes section for more details). The median pay gaps for each pair of ethnic groups are presented in a pay gap grid, where a ‘focal group’ is compared to a ‘comparator group’. This results in two different pay gaps for each pair as the gap is dependent upon which of the two groups is selected as the ‘focal group’ and which as the ‘comparator group’.
For example, when comparing the median hourly earnings of Asian civil servants and White civil servants:
- If Asian is the ‘focal group’ and White is the ‘comparator group’ the median earnings pay gap measure is how much lower (if % gap is positive) or higher (if % gap is negative) Asian median earnings are compared to White median earnings as a percentage of White median earnings.
Conversely, where White is the ‘focal group’ and Asian is the ‘comparator’ group there will be a different pay gap. For more details see the technical note for disability and ethnicity pay gap reporting.
Civil Service median ethnicity earnings pay gaps where White is the comparator ethnic group:
-
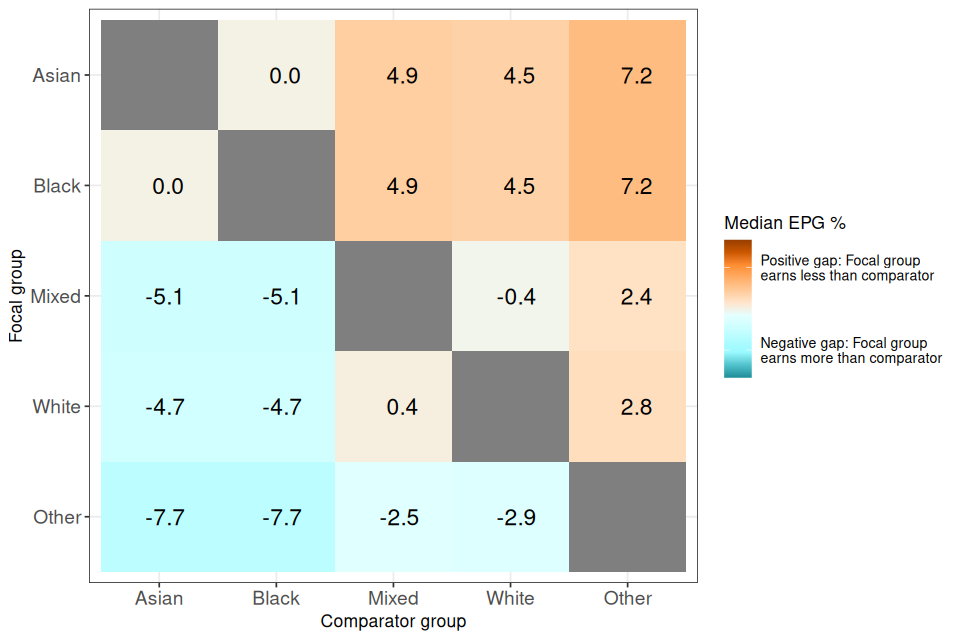
Asian: The median ethnicity earnings pay gap for Asian civil servants compared to White civil servants is 4.5%. This means the median hourly earnings of Asian civil servants is 4.5% lower than that of White civil servants.
-
Black: The median ethnicity earnings pay gap for Black civil servants compared to White civil servants is 4.5%. This means the median hourly earnings of Black civil servants is 4.5% lower than that of White civil servants.
-
Mixed or Multiple: The median ethnicity earnings pay gap for civil servants from the Mixed or Multiple ethnic group compared to White civil servants is -0.4%. This means the median hourly earnings of civil servants from the Mixed or Multiple ethnic group is 0.4% higher than that of White civil servants.
-
Other: The median ethnicity earnings pay gap for civil servants from the Other ethnic group compared to White civil servants is -2.9%. This means the median hourly earnings of civil servants from the Other ethnic group is 2.9% higher than that of White civil servants.
Across all median ethnicity earnings pay gaps for the Civil Service in 2025:
-
The largest median earnings pay gap for the Civil Service is -7.7% between civil servants from the Other ethnic group and both Black and Asian civil servants. This means the median hourly earnings of civil servants from the Other ethnic group is 7.7% higher than that of Black and Asian civil servants.
-
Median hourly earnings of both Asian civil servants and Black civil servants are the same, but are lower than White, Mixed or Multiple Ethnic group and Other Ethnic group median hourly earnings.
The grid at figure 2 below compares the median hourly earnings of the focal group (left y axis) with the comparator group (bottom x axis).
A positive pay gap (% more than zero) indicates that the ‘focal group’ earnings are lower than the ‘comparator group’.
A negative pay gap (% less than zero) indicates that the ‘focal group’ earnings are higher than the ‘comparator group’.
Figure 2: Median ethnicity earnings pay gaps for the Civil Service, 2025 (see table G)
3. Civil Service median ethnicity bonus pay gaps
This section provides the headline median bonus pay gaps for the Civil Service in 2025.
Civil Service median ethnicity bonus pay gaps where White is the comparator ethnic group:
-
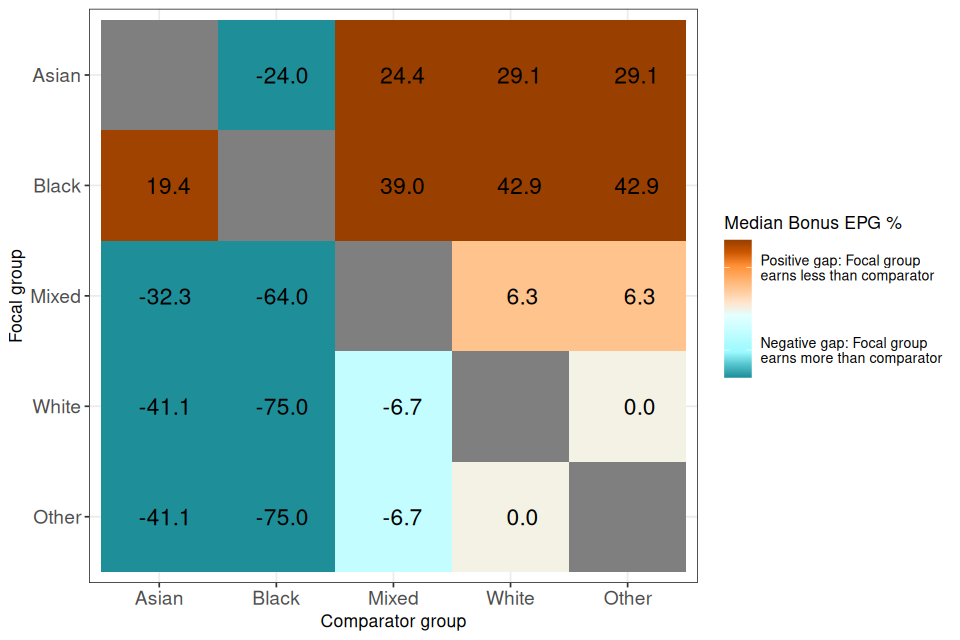
Asian: The median ethnicity bonus pay gap for Asian civil servants compared to White civil servants is 29.1%. This means the median bonus of Asian civil servants is 29.1% lower than that of White civil servants.
-
Black: The median ethnicity bonus pay gap for Black civil servants compared to White civil servants is 42.9%. This means the median bonus of Black civil servants is 42.9% lower than that of White civil servants.
-
Mixed or Multiple: The median ethnicity bonus gap for civil servants from the Mixed or Multiple ethnic group compared to White civil servants is 6.3%. This means the median bonus of civil servants from the Mixed or Multiple ethnic group is 6.3% lower than that of White civil servants.
-
Other: The median ethnicity bonus pay gap for civil servants from the Other ethnic group compared to White civil servants is 0%. This means the median bonus of civil servants from the Other ethnic group and White civil servants is the same.
Across all median ethnicity bonus pay gaps for the Civil Service in 2025:
-
The largest median bonus pay gap is -75.0% between both White civil servants and civil servants from the Other ethnic group, and Black civil servants. This means the median bonus of White civil servants and civil servants from the Other ethnic group is 75.0% higher than that of Black civil servants.
-
The median bonus of Black civil servants is lower than each of the other four ethnic groups.
The grid at figure 3 below compares the median bonus of the focal group (left y axis) with the comparator group (bottom x axis).
A positive pay gap (more than zero) indicates that the ‘focal group’ bonus is lower than the ‘comparator group’.
A negative pay gap (less than zero) indicates that the ‘focal group’ bonus is higher than the ‘comparator group’.
Figure 3: Median ethnicity bonus pay gaps for the Civil Service, 2025 (see table G)
4. Proportion of civil servants receiving a bonus by ethnicity
In 2025, 73.1% of White civil servants received a bonus, compared to 62.1% of Black civil servants. The proportion of Asian, Mixed or Multiple ethnic group and Other ethnic group civil servants that received a bonus is 69.8%, 70.6% and 69.9% respectively.
Figure 4: Percentage of civil servants by ethnic group receiving a bonus in 2025 (see table G)
5. Ethnicity pay quartiles for the Civil Service
Statistical note on ethnic group representation rates
Please note that the overall ethnic group percentages presented in this section do not represent the overall headline representation rates for the Civil Service. This is because these pay gap statistics are aligned with pay gap reporting guidelines and include some civil servants that are not counted as ‘in post’ on the reference date in Civil Service Statistics. Additionally, Civil Service pay gap reporting does not include civil servants employed at Scottish Government and Welsh Government whereas these organisations’ civil servants are counted in Civil Service Statistics. Furthermore, the headline representation rates for ethnic groups in Civil Service Statistics exclude unknown and undeclared civil servants from the denominator in the calculation. Please refer to Civil Service Statistics 2025 for the latest headline information on representation rates for the overall Civil Service.
This section provides a breakdown of the Civil Service by ethnicity and pay quartile.
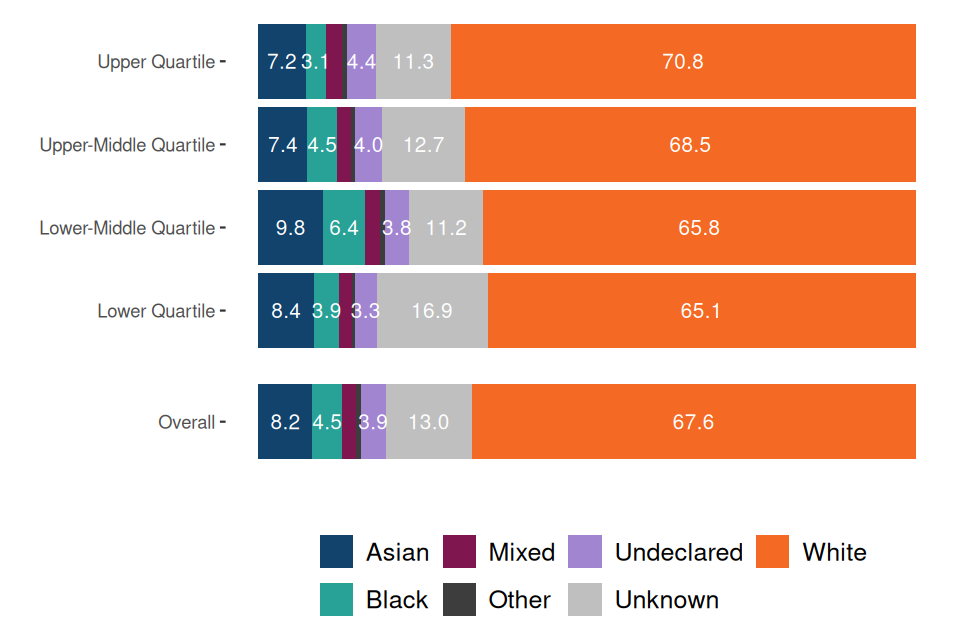
In 2025, White civil servants account for just over two-thirds (67.6%) of civil servants included in these pay gap statistics. This is followed by Asian civil servants (8.2%), Black civil servants (4.5%), civil servants from the Mixed or Multiple ethnic group (2.2%) and civil servants from the Other ethnic group (0.7%). The percentage of civil servants who actively chose not to declare their ethnic group (undeclared) is 3.9%, and 13% are from an unknown ethnic group.
Headline findings from pay gap quartiles show that:
-
Asian: Asian civil servants are overrepresented in both the lower pay quartiles (8.4% Lower and 9.8% Lower-Middle) and underrepresented in both the upper pay quartiles (Upper 7.2% and Upper-Middle 7.4%).
-
Black: Black civil servants are underrepresented in the lower pay quartile (3.9%) and the Upper pay quartile (3.1%) and overrepresented in the Lower-Middle pay quartile (6.4%).
-
Mixed or Multiple: Civil servants from the Mixed or Multiple ethnic group are overrepresented in the Upper pay quartile (2.4%) and underrepresented in the Lower pay quartile (1.8%) and Upper-Middle pay quartile (2.1%).
-
White: White civil servants are overrepresented in the Upper (70.8%) and Upper-Middle (68.5%) pay quartiles and underrepresented in the two lower pay quartiles (Lower-Middle 65.8% and Lower 65.1%).
-
Other: Civil servants from the Other ethnic group are over-represented in the Upper pay quartile (0.8%) and underrepresented in the Lower pay quartile (0.5%).
-
Undeclared: Civil servants who actively chose not to declare their ethnic group are overrepresented in both the upper pay quartiles (Upper 4.4%, Upper-Middle 4.0%) and underrepresented in both the lower pay quartiles (Lower 3.3%, Lower-Middle 3.8%).
-
Unknown: Civil servants whose ethnic group is unknown are overrepresented in the Lower pay quartile (16.9%) and underrepresented in all other pay quartiles (Upper 11.3%, Upper-Middle 12.7%, Lower-Middle 11.2%).
Figure 5: Percentage of civil servants in each pay quartile by ethnic group, 2025 (see table G)
6. Annex A : Median ethnicity pay gaps in London
This annex provides the median earnings pay gaps and median bonus pay gaps for civil servants working in London.
Statistical note on London and Outside London pay gaps statistics
This annex presents statistics on pay gap measures specifically for civil servants based in London. This is because 42% of all ethnic minority civil servants are based in London compared to 14% of White civil servants (as at 31 March 2025). Civil servants based in London are, on average, paid more than those outside London. In combination this means that the differences in earnings for the overall Civil Service may not reflect the differences that are seen in London or Outside London when considered separately.
These statistics are aligned with the UK-managed international statistical geography - International Territorial Levels (ITL). They align with international standards, enabling comparability both over time and internationally. London in these statistics refers to the ITL1 region of London. Outside London refers to all civil servants working in all ITL1 regions except for London, including those working overseas but excluding those where location is not known.
6.1 Median ethnicity earnings pay gaps for the Civil Service in London
Median ethnicity earnings pay gaps where White is the comparator ethnic group for the Civil Service in London, 2025:
-
Asian: In London the median ethnicity earnings pay gap for Asian civil servants compared to White civil servants is 20.8%. This means in London the median hourly earnings of Asian civil servants is 20.8% lower than that of White civil servants.
-
Black: In London the median ethnicity earnings pay gap for Black civil servants compared to White civil servants is 27.8%. This means in London the median hourly earnings of Black civil servants is 27.8% lower than that of White civil servants.
-
Mixed or Multiple: In London the median ethnicity earnings pay gap for civil servants from the Mixed or Multiple ethnic group compared to White civil servants is 14.3%. This means in London the median hourly earnings of civil servants from the Mixed or Multiple ethnic group is 14.3% lower than that of White civil servants.
-
Other: In London the median ethnicity earnings pay gap for civil servants from the Other ethnic group compared to White civil servants is 17.3%. This means in London the median hourly earnings of civil servants from the Other ethnic group is 17.3% lower than that of White civil servants.
Across all median ethnicity earnings pay gaps for the Civil Service in London, 2025:
-
The largest median earnings pay gap for the Civil Service in London is -38.5% between White civil servants and Black civil servants. This means in London the median hourly earnings of White civil servants is 38.5% higher than that of Black civil servants.
-
In London the median hourly earnings of White civil servants is higher than each of the other four ethnic groups. At the same time in London the median hourly earnings of Black civil servants is lower than each of the other four ethnic groups.
The grid at figure 6.1 below compares the median hourly earnings of the focal group (left y axis) with the comparator group (bottom x axis).
A positive pay gap (more than zero) indicates where the ‘focal group’ earnings are lower than the ‘comparator group’.
A negative pay gap (less than zero) indicates that the ‘focal group’ earnings are higher than the ‘comparator group’.
Figure 6.1: Median ethnicity earnings pay gaps for the Civil Service in London, 2025 (see table G)

6.2 Median ethnicity bonus pay gaps for the Civil Service in London
Median ethnicity bonus pay gaps where White is the comparator ethnic group for the Civil Service in London, 2025:
-
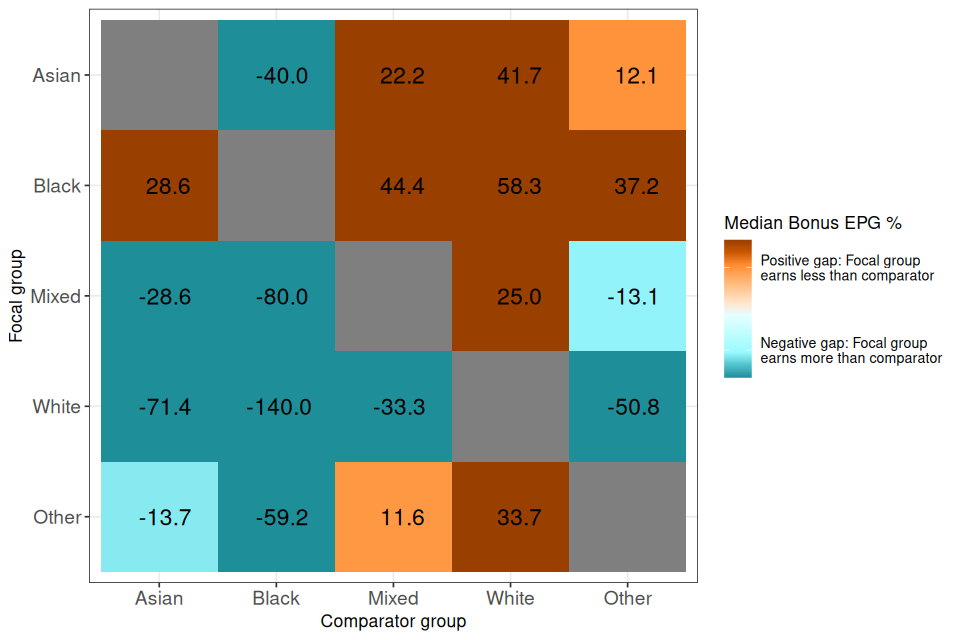
Asian: In London the median ethnicity bonus pay gap for Asian civil servants compared to White civil servants is 41.7%. This means in London the median bonus of Asian civil servants is 41.7% lower than that of White civil servants.
-
Black: In London the median ethnicity bonus pay gap for Black civil servants compared to White civil servants is 58.3%. This means in London the median bonus of Black civil servants is 58.3% lower than that of White civil servants.
-
Mixed or Multiple: In London the median ethnicity bonus gap for civil servants from the Mixed or Multiple ethnic group compared to White civil servants is 25.0%. This means in London the median bonus of civil servants from the Mixed or Multiple ethnic group is 25.0% lower than that of White civil servants.
-
Other: In London the median ethnicity bonus gap for civil servants from the Other ethnic group compared to White civil servants is 33.7%. This means in London the median bonus of civil servants from the Other ethnic group is 33.7% lower than that of White civil servants.
Across all median ethnicity bonus pay gaps for the Civil Service in London, 2025:
-
The largest median bonus pay gap for the Civil Service in London is -140.0% between White and Black civil servants. This means in London the median bonus of White civil servants is 140.0% higher than that of Black civil servants.
-
In London the median bonus of White civil servants is higher than each of the four other ethnic groups. At the same time, the median bonus of Black civil servants is lower than each of the other four ethnic groups in London.
The grid at figure 6.2 below compares the median bonus of the focal group (left y axis) with the comparator group (bottom x axis).
A positive pay gap (more than zero) indicates where the ‘focal group’ bonus is lower than the ‘comparator group’.
A negative pay gap (less than zero) indicates that the ‘focal group’ bonus is higher than the ‘comparator group’.
Figure 6.2: Median ethnicity bonus pay gaps for the Civil Service in London, 2025 (see table G)
7. Annex B : Median ethnicity pay gaps outside London
This annex provides the headline median earnings pay gaps and median bonus pay gaps for civil servants working outside London.
Statistical note on London and Outside London pay gaps statistics
This annex presents statistics on pay gap measures specifically for civil servants based in London. This is because 42% of all ethnic minority civil servants are based in London compared to 14% of White civil servants (as at 31 March 2025). Civil servants based in London are, on average, paid more than those outside London. In combination this means that the differences in earnings for the overall Civil Service may not reflect the differences that are seen in London or Outside London when considered separately.
These statistics are aligned with the UK-managed international statistical geography - International Territorial Levels (ITL). They align with international standards, enabling comparability both over time and internationally. London in these statistics refers to the ITL1 region of London. Outside London refers to all civil servants working in all ITL1 regions except for London, including those working overseas but excluding those where location is not known.
7.1 Median ethnicity earnings pay gaps for the Civil Service outside London
Median ethnicity earnings pay gaps where White is the comparator ethnic group for the Civil Service outside London, 2025:
-
Asian: Outside London the median ethnicity earnings pay gap for Asian civil servants compared to White civil servants is 12.5%. This means outside London the median hourly earnings of Asian civil servants is 12.5% lower than that of White civil servants.
-
Black: Outside London the median ethnicity earnings pay gap for Black civil servants compared to White civil servants is 10.9%. This means outside London the median hourly earnings of Black civil servants is 10.9% lower than that of White civil servants.
-
Mixed or Multiple: Outside London the median ethnicity earnings pay gap for civil servants from the Mixed or Multiple ethnic group compared to White civil servants is 3.0%. This means outside London the median hourly earnings of civil servants from the Mixed or Multiple ethnic group is 3.0% lower than that of White civil servants.
-
Other: Outside London the median ethnicity earnings pay gap for civil servants from the Other ethnic group compared to White civil servants is 3.1%. This means outside London the median hourly earnings of civil servants from the Other ethnic group is 3.1% lower than that of White civil servants.
Across all median ethnicity earnings pay gaps for the Civil Service outside London in 2025:
-
The largest median earnings pay gap for the Civil Service outside London is -14.3% between White civil servants and Asian civil servants. This means outside London the median hourly earnings of White civil servants is 14.3% higher than that of Asian civil servants.
-
Outside London the median hourly earnings of White Civil Servants is more than each of the other four ethnic groups. At the same time, outside London the median hourly earnings of Asian civil servants is lower than each of the other four ethnic groups.
The grid at figure 7.1 below compares the median hourly earnings of the focal group (left y axis) with the comparator group (bottom x axis).
A positive pay gap (more than zero) indicates where the ‘focal group’ earnings are lower than the ‘comparator group’.
A negative pay gap (less than zero) indicates that the ‘focal group’ earnings are higher than the ‘comparator group’.
Figure 7.1: Median ethnicity earnings pay gaps for the Civil Service outside London, 2025 (see table G)

7.2 Median ethnicity bonus pay gaps for the Civil Service outside London
Median ethnicity bonus pay gaps where White is the comparator ethnic group for the Civil Service outside London, 2025:
-
Asian: Outside London the median ethnicity bonus pay gap for Asian civil servants compared to White civil servants is 40.0%. This means outside London the median bonus of Asian civil servants is 40.0% lower than that of White civil servants.
-
Black: Outside London the median ethnicity bonus pay gap for Black civil servants compared to White civil servants is 50.0%. This means outside London the median bonus of Black civil servants is 50.0% lower than that of White civil servants.
-
Mixed or Multiple: Outside London the median ethnicity bonus gap for civil servants from the Mixed or Multiple ethnic group compared to White civil servants is 16.7%. This means outside London the median bonus of civil servants from the Mixed or Multiple ethnic group is 16.7% lower than that of White civil servants.
-
Other: Outside London the median ethnicity bonus gap for civil servants from the Other ethnic group compared to White civil servants is 14.8%. This means outside London the median bonus of civil servants from the Other ethnic group is 14.8% lower than that of White civil servants.
Across all median ethnicity bonus pay gaps for the overall Civil Service outside London in 2025:
-
The largest median bonus pay gap for the Civil Service outside London is -100.0% between White civil servants and Black civil servants. This means outside London the median bonus of White civil servants is 100.0% higher than that of Black civil servants.
-
Outside London the median bonus of White civil servants is higher than each of the four other ethnic groups. At the same time the median bonus of Black civil servants is lower than each of the other four ethnic groups outside London.
The grid at figure 7.2 below compares the median bonus of the focal group (left y axis) with the comparator group (bottom x axis).
A positive pay gap (more than zero) indicates where the ‘focal group’ bonus is lower than the ‘comparator group’.
A negative pay gap (less than zero) in the grid indicates that the ‘focal group’ bonus is higher than the ‘comparator group’.
Figure 7.2: Median ethnicity bonus pay gaps for the Civil Service outside London, 2025 (see table G)

8. Annex C: Mean earnings and bonus pay gaps
This section provides the mean earnings and bonus pay gaps for the Civil Service, Civil Service in London and Civil Service outside London in 2025.
8.1 Mean ethnicity earnings pay gaps for the Civil Service
Civil Service mean ethnicity earnings pay gaps where White is the comparator ethnic group:
-
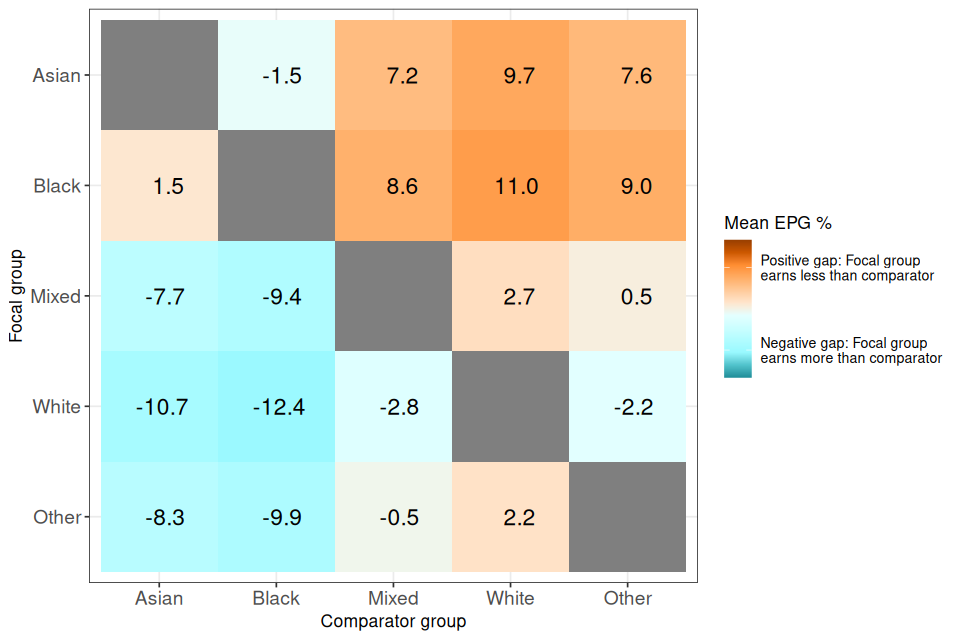
Asian: The mean ethnicity earnings pay gap for Asian civil servants compared to White civil servants is 5.2%. This means the mean hourly earnings of Asian civil servants is 5.2% lower than that of White civil servants.
-
Black: The mean ethnicity earnings pay gap for Black civil servants compared to White civil servants is 7.9%. This means the mean hourly earnings of Black civil servants is 7.9% lower than that of White civil servants.
-
Mixed or Multiple: The mean ethnicity earnings pay gap for civil servants from the Mixed or Multiple ethnic group compared to White civil servants is -1.5%. This means the mean hourly earnings of civil servants from the Mixed or Multiple ethnic group is 1.5% higher than that of White civil servants.
-
Other: The mean ethnicity earnings pay gap for civil servants from the Other ethnic group compared to White civil servants is -4.0%. This means the mean hourly earnings of civil servants from the Other ethnic group is 4.0% higher than that of White civil servants.
Across all mean ethnicity earnings pay gaps for the Civil Service in 2025:
-
The largest mean earnings pay gap for the Civil Service is -12.9% between civil servants from the Other ethnic group and Black civil servants. This means the mean hourly earnings of civil servants from the Other ethnic group is 12.9% higher than that of Black civil servants.
-
Mean hourly earnings of Black civil servants are lower than all other ethnic groups mean earnings.
The grid at figure 8.1 below compares the mean hourly earnings of the focal group (left y axis) with the comparator group (bottom x axis).
A positive pay gap (% more than zero) indicates that the ‘focal group’ earnings are lower than the ‘comparator group’.
A negative pay gap (% less than zero) indicates that the ‘focal group’ earnings are higher than the ‘comparator group’.
Figure 8.1: Mean ethnicity earnings pay gaps for the overall Civil Service, 2025 (see table G)

8.2 Civil Service mean ethnicity bonus pay gaps
Civil Service mean ethnicity bonus pay gaps where White is the comparator ethnic group:
-
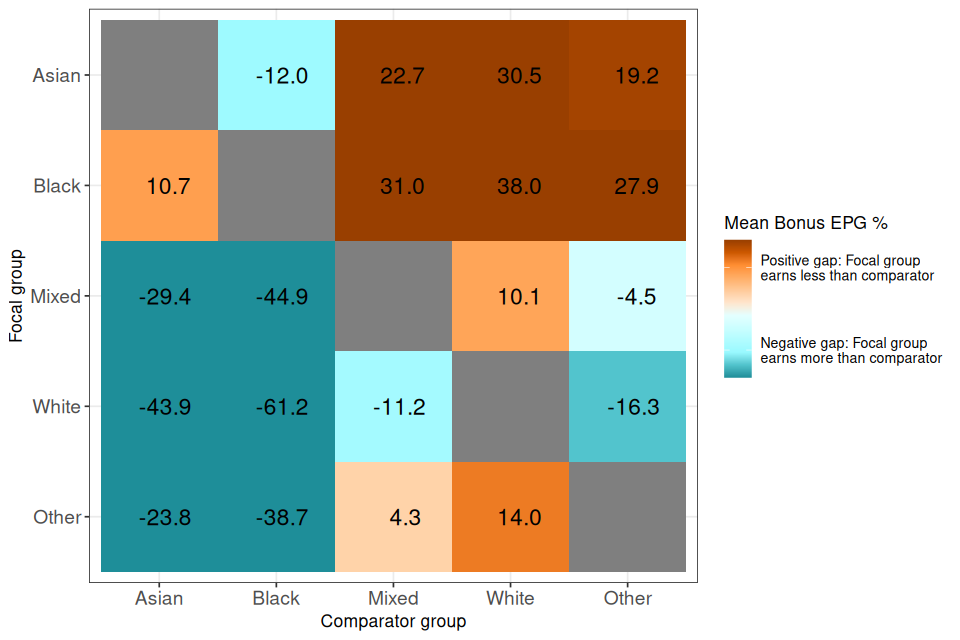
Asian: The mean ethnicity bonus pay gap for Asian civil servants compared to White civil servants is 30.5%. This means the mean bonus of Asian civil servants is 30.5% lower than that of White civil servants.
-
Black: The mean ethnicity bonus pay gap for Black civil servants compared to White civil servants is 38.0%. This means the mean bonus of Black civil servants is 38.0% lower than that of White civil servants.
-
Mixed or Multiple: The mean ethnicity bonus gap for civil servants from the Mixed or Multiple ethnic group compared to White civil servants is 10.1%. This means the mean bonus of civil servants from the Mixed or Multiple ethnic group is 10.1% lower than that of White civil servants.
-
Other: The mean ethnicity bonus pay gap for civil servants from the Other ethnic group compared to White civil servants is 14.0%. This means the mean bonus of civil servants from the Other ethnic group is 14.0% lower than that of White civil servants.
Across all mean ethnicity bonus pay gaps for the Civil Service in 2025:
-
The largest mean bonus pay gap is -61.2% between White civil servants and Black civil servants. This means the mean bonus of White civil servants 61.2% higher than that of Black civil servants.
-
The mean bonus of Black civil servants is lower than each of the other four ethnic groups.
The grid at figure 8.2 below compares the mean bonus of the focal group (left y axis) with the comparator group (bottom x axis).
A positive pay gap (more than zero) indicates that the ‘focal group’ bonus is lower than the ‘comparator group’.
A negative pay gap (less than zero) indicates that the ‘focal group’ bonus is higher than the ‘comparator group’.
Figure 8.2: Mean ethnicity bonus pay gaps for the overall Civil Service, 2025 (see table G)
8.3 Mean ethnicity earnings pay gaps for the Civil Service in London
Mean ethnicity earnings pay gaps where White is the comparator ethnic group for the Civil Service in London, 2025:
-
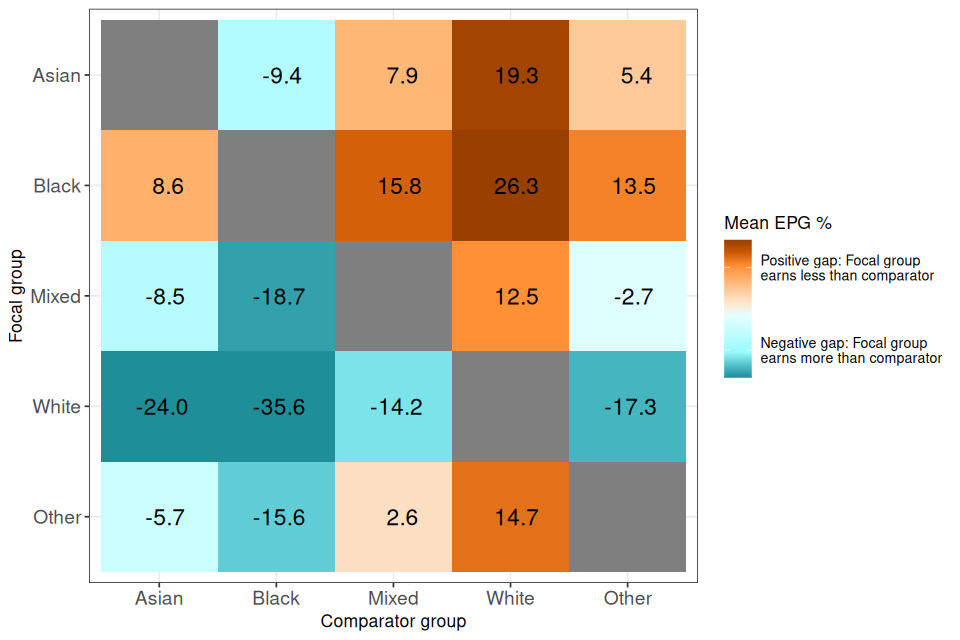
Asian: In London the mean ethnicity earnings pay gap for Asian civil servants compared to White civil servants is 19.3%. This means in London the mean hourly earnings of Asian civil servants is 19.3% lower than that of White civil servants.
-
Black: In London the mean ethnicity earnings pay gap for Black civil servants compared to White civil servants is 26.3%. This means in London the mean hourly earnings of Black civil servants is 26.3% lower than that of White civil servants.
-
Mixed or Multiple: In London the mean ethnicity earnings pay gap for civil servants from the Mixed or Multiple ethnic group compared to White civil servants is 12.5%. This means in London the mean hourly earnings of civil servants from the Mixed or Multiple ethnic group is 12.5% lower than that of White civil servants.
-
Other: In London the mean ethnicity earnings pay gap for civil servants from the Other ethnic group compared to White civil servants is 14.7%. This means in London the mean hourly earnings of civil servants from the Other ethnic group is 14.7% lower than that of White civil servants.
Across all mean ethnicity earnings pay gaps for the Civil Service in London, 2025:
-
The largest mean earnings pay gap for the Civil Service in London is -35.6% between White civil servants and Black civil servants. This means in London the mean hourly earnings of White civil servants is 35.6% higher than that of Black civil servants.
-
In London the mean hourly earnings of White civil servants is higher than each of the other four ethnic groups. At the same time, in London the mean hourly earnings of Black civil servants is lower than each of the other four ethnic groups.
The grid at figure 8.3 below compares the mean hourly earnings of the focal group (left y axis) with the comparator group (bottom x axis).
A positive pay gap (more than zero) indicates where the ‘focal group’ earnings are lower than the ‘comparator group’.
A negative pay gap (less than zero) indicates that the ‘focal group’ earnings are higher than the ‘comparator group’.
Figure 8.3: Mean ethnicity earnings pay gaps for the Civil Service in London, 2025 (see table G)
8.4 Mean ethnicity bonus pay gaps for the Civil Service in London
Mean ethnicity bonus pay gaps where White is the comparator ethnic group for the Civil Service in London, 2025:
-
Asian: In London the mean ethnicity bonus pay gap for Asian civil servants compared to White civil servants is 42.8%. This means in London the mean bonus of Asian civil servants is 42.8% lower than that of White civil servants.
-
Black: In London the mean ethnicity bonus pay gap for Black civil servants compared to White civil servants is 55.4%. This means in London the mean bonus of Black civil servants is 55.4% lower than that of White civil servants.
-
Mixed or Multiple: In London the mean ethnicity bonus gap for civil servants from the Mixed or Multiple ethnic group compared to White civil servants is 27.5%. This means in London the mean bonus of civil servants from the Mixed or Multiple ethnic group is 27.5% lower than that of White civil servants.
-
Other: In London the mean ethnicity bonus gap for civil servants from the Other ethnic group compared to White civil servants is 35.7%. This means in London the mean bonus of civil servants from the Other ethnic group is 35.7% lower than that of White civil servants.
Across all mean ethnicity bonus pay gaps for the Civil Service in London, 2025:
-
The largest mean bonus pay gap for the Civil Service in London is -124.0% between White and Black civil servants. This means in London the mean bonus of White civil servants is 124.0% higher than that of Black civil servants.
-
In London the mean bonus of White civil servants is higher than each of the four other ethnic groups. At the same time, the mean bonus of Black civil servants is lower than each of the other four ethnic groups in London.
The grid at figure 8.4 below compares the mean bonus of the focal group (left y axis) with the comparator group (bottom x axis).
A positive pay gap (more than zero) indicates where the ‘focal group’ bonus is lower than the ‘comparator group’.
A negative pay gap (less than zero) indicates that the ‘focal group’ bonus is higher than the ‘comparator group’.
Figure 8.4: Mean ethnicity bonus pay gaps for the Civil Service in London, 2025 (see table G)

8.5 Mean ethnicity earnings pay gaps for the Civil Service outside London
Mean ethnicity earnings pay gaps where White is the comparator ethnic group for the Civil Service outside London, 2025:
-
Asian: Outside London the mean ethnicity earnings pay gap for Asian civil servants compared to White civil servants is 9.7%. This means outside London the mean hourly earnings of Asian civil servants is 9.7% less than that of White civil servants.
-
Black: Outside London the mean ethnicity earnings pay gap for Black civil servants compared to White civil servants is 11.0%. This means outside London the mean hourly earnings of Black civil servants is 11.0% lower than that of White civil servants.
-
Mixed or Multiple: Outside London the mean ethnicity earnings pay gap for civil servants from the Mixed or Multiple ethnic group compared to White civil servants is 2.7%. This means outside London the mean hourly earnings of civil servants from the Mixed or Multiple ethnic group is 2.7% lower than that of White civil servants.
-
Other: Outside London the mean ethnicity earnings pay gap for civil servants from the Other ethnic group compared to White civil servants is 2.2%. This means outside London the mean hourly earnings of civil servants from the Other ethnic group is 2.2% lower than that of White civil servants.
Across all mean ethnicity earnings pay gaps for the Civil Service outside London in 2025:
-
The largest mean earnings pay gap for the Civil Service outside London is -12.4% between White civil servants and Black civil servants. This means outside London the mean hourly earnings of White civil servants is 12.4% higher than that of Black civil servants.
-
Outside London the mean hourly earnings of White Civil Servants is higher than each of the other four ethnic groups. At the same time, outside London the mean hourly earnings of Black civil servants is lower than each of the other four ethnic groups.
The grid at figure 8.5 below compares the mean hourly earnings of the focal group (left y axis) with the comparator group (bottom x axis).
A positive pay gap (more than zero) indicates where the ‘focal group’ earnings are lower than the ‘comparator group’.
A negative pay gap (less than zero) indicates that the ‘focal group’ earnings are higher than the ‘comparator group’.
Figure 8.5: Mean ethnicity earnings pay gaps for the Civil Service outside London, 2025 (see table G)
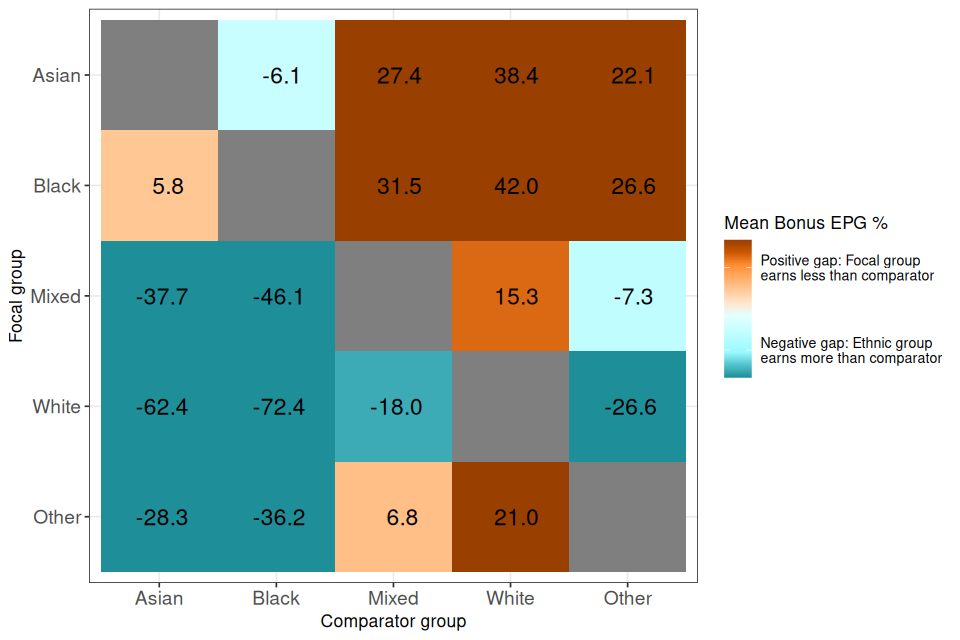
8.6 Mean ethnicity bonus pay gaps for the Civil Service outside London
Mean ethnicity bonus pay gaps where White is the comparator ethnic group for the Civil Service outside London, 2025:
-
Asian: Outside London the mean ethnicity bonus pay gap for Asian civil servants compared to White civil servants is 38.4%. This means outside London the mean bonus of Asian civil servants is 38.4% lower than that of White civil servants.
-
Black: Outside London the mean ethnicity bonus pay gap for Black civil servants compared to White civil servants is 42.0%. This means outside London the mean bonus of Black civil servants is 42.0% lower than that of White civil servants.
-
Mixed or Multiple: Outside London the mean ethnicity bonus gap for civil servants from the Mixed or Multiple ethnic group compared to White civil servants is 15.3%. This means outside London the mean bonus of civil servants from the Mixed or Multiple ethnic group is 15.3% lower than that of White civil servants.
-
Other: Outside London the mean ethnicity bonus gap for civil servants from the Other ethnic group compared to White civil servants is 21.0%. This means outside London the mean bonus of civil servants from the Other ethnic group is 21.0% lower than that of White civil servants.
Across all mean ethnicity bonus pay gaps for the overall Civil Service outside London in 2025:
-
The largest mean bonus pay gap for the Civil Service outside London is -72.4% between White civil servants and Black civil servants. This means outside London the mean bonus of White civil servants is 72.4% higher than that of Black civil servants.
-
Outside London the mean bonus of White civil servants is higher than each of the four other ethnic groups. At the same time, the mean bonus of Black civil servants is lower than each of the other four ethnic groups outside London.
The grid at figure 8.6 below compares the mean bonus of the focal group (left y axis) with the comparator group (bottom x axis).
A positive pay gap (more than zero) indicates where the ‘focal group’ bonus is lower than the ‘comparator group’.
A negative pay gap (less than zero) in the grid indicates that the ‘focal group’ bonus is higher than the ‘comparator group’.
Figure 8.6: Mean ethnicity bonus pay gaps for the Civil Service outside London, 2025 (see table G)
9. Notes
How the output is created
The statistics in this release are derived from returns completed as part of the Annual Civil Service Employment Survey (ACSES) and covers all Civil Service organisations, including all major Departments. ACSES requests from organisations an individual-level record of all their Civil Service employees ‘in post’ as at the reference date, along with records for leavers and entrants from/to the Civil Service in the preceding 12 months. ACSES collects information via a standard MS Excel template that includes data fields on pay, contractual hours, grade and location. It also includes personal characteristics, such as age, sex, religion, and sexual orientation. The data collected are anonymous in that no employee names are requested. The data, however, is considered and handled as ‘personal data’ because in certain circumstances individuals may be identifiable. Where departmental figures are quoted these will include the main department and their executive agencies and crown non-departmental public bodies. For pay gap analysis, however, different aggregations may apply. Additionally, the Scottish Government and Welsh Government are not included in any of the pay gap statistics published from ACSES.
Pay gaps and equal pay
By law, employers must not pay an employee less, or give them terms and conditions that put them at a disadvantage, because of disability, race, religion or belief, sexual orientation or another ‘protected characteristic’
An ethnicity pay gap is a measure of the difference between ethnic groups’ average earnings across an organisation or the labour market as a whole over a period of time, regardless of role or seniority. It is not a comparison of employees of different ethnicities in like-for-like roles. Even if an employer has a fair pay and reward policy, and has equal pay, it could still have a pay gap.
Equal pay is covered by the Equality Act 2010. Read more about equal pay and the law on the Acas website.
The statistics presented in this bulletin describe the ethnicity pay gaps for the Civil Service overall and for each organisation. It is, however, important to recognise that there are a number of reasons why an organisation may have a ethnicity pay gap. For example, an employer may have a number of grades with equal numbers of employees in each, and at each grade, employees of all ethnicities doing equal work, or work of equal value, are paid the same. This means the employer has equal pay. However, if there are different proportions of ethnic groups in higher (or lower) grades then average hourly pay will be impacted and the employer will have a pay gap, despite having equal pay.
This bulletin presents London and outside London ethnicity pay gaps. This is because of the disproportionate number of ethnic minority civil servants employed in London, where pay levels are generally higher.
Further information
The Civil Service Statistics data tables, the quality and methodology information document as well as the technical note for disability and ethnicity gap reporting are published on gov.uk.
Median and Mean measures of the ethnicity pay gap
The main sections in this bulletin headline with the median measure of the ethnicity pay gaps. All equivalent mean gap measures are provided separately at Annex C. All measures can be downloaded here.
Ethnicity pay gap reporting is more complex than gender pay gap reporting. Gender pay gap analysis only involves a comparison between two groups, whilst ethnicity pay reporting involves comparisons between multiple ethnic groups. Given that the potential number of ethnicity pay gaps is large, this bulletin focuses on the median as the headline measure. The median is the measure of the “typical” employee (the middle earner). It is not distorted by outliers in the data at the higher or lower ends of the pay distribution. The mean is still an important measure as it uses all values in the dataset.
High level ethnic groups
These pay gap statistics use the five high-level ethnic group categories aligned with the GSS Harmonised Standards for Ethnicity :
Asian / Asian British when describing this group we use the phrase ”Asian civil servants”. This group is made up of the following ethnic groups:
- Indian
- Pakistani
- Bangladeshi
- Chinese
- Any other Asian background, please describe
Black / African / Caribbean / Black British when describing this group we use the phrase “Black civil servants”. This group is made up of the following ethnic groups:
- African
- Caribbean
- Any other Black / African / Caribbean background, please describe
Mixed or Multiple ethnic groups when describing this group we use the phrase “civil servants from the Mixed or Multiple ethnic group”. This group is made up of the following ethnic groups:
- White and Black Caribbean
- White and Black African
- White and Asian
- Any other Mixed / Multiple ethnic background, please describe
White in this bulletin when describing this group we use the phrase ”White civil servants”. This group is made up of the following ethnic groups:
- English / Welsh / Scottish / Northern Irish / British
- Irish
- Gypsy or Irish Traveller
- Any other White background, please describe
Other ethnic group when describing this group we use the phrase “civil servants from the Other ethnic group”. This group is made up of the following ethnic groups:
- Arab
- Any other ethnic group, please describe
When presenting pay quartiles, we also report where the ethnic group is “undeclared” or “unknown”. Undeclared civil servants are where the respondent has chosen to actively not disclose their ethnicity. Unknown civil servants indicate that the information is not known i.e. the respondent has not made a response.
10. About
Civil Service Statistics is an Accredited Official Statistics release describing the UK Civil Service workforce in terms of its size, demographic characteristics, salaries, working pattern, grade, and location. The data is drawn from the Annual Civil Service Employment Survey (ACSES).
The Civil Service helps the government of the day develop and implement its policies as effectively as possible. It provides services directly to the public, including paying benefits and pensions; running employment services; running prisons and issuing driving licences. Civil servants also work on policy development and implementation, including analysts, project managers, lawyers and economists.
Organisations that make up the Civil Service include central government departments, their agencies, and crown non-departmental public bodies.
These statistics count all home Civil Service employees, including those based in Northern Ireland and Overseas. Not included are the Northern Ireland Civil Service, other Crown servants and employees of the wider public sector, for example, employees of non-crown non-departmental public bodies and the National Health Service (NHS).
Scottish Government and Welsh Government are not included in any of the pay gap reporting.
Accredited Official Statistics
These accredited official statistics have been independently reviewed by the Office for Statistics Regulation (OSR). They comply with the standards of trustworthiness, quality and value in the Code of Practice for Statistics. Accredited official statistics are called National Statistics in the Statistics and Registration Service Act 2007.
Accreditation signifies their compliance with the authority’s Code of Practice for Statistics which broadly means these statistics are:
-
managed impartially and objectively in the public interest
-
meet identified user needs
-
produced according to sound methods
-
well explained and readily accessible
Our statistical practice is regulated by the Office for Statistics Regulation (OSR).
OSR sets the standards of trustworthiness, quality and value in the Code of Practice for Statistics that all producers of official statistics should adhere to.
These statistics were independently reviewed by the OSR in February 2022. See Compliance Check of Civil Service Statistics. Since this review by the OSR, we have continued to comply with the Code of Practice for Statistics.
Request for Feedback
If you would like to provide feedback on any aspect of this statistical release, please contact us.