Technical note for disability and ethnicity pay gap reporting
Updated 29 October 2025

© Crown copyright 2025
This publication is licensed under the terms of the Open Government Licence v3.0 except where otherwise stated. To view this licence, visit nationalarchives.gov.uk/doc/open-government-licence/version/3 or write to the Information Policy Team, The National Archives, Kew, London TW9 4DU, or email: psi@nationalarchives.gov.uk.
Where we have identified any third party copyright information you will need to obtain permission from the copyright holders concerned.
This publication is available at https://www.gov.uk/government/statistics/civil-service-statistics-2025/technical-note-for-disability-and-ethnicity-pay-gap-reporting
Statistical Enquiries: Civil Service statistics
1. Overview
This technical note provides further details on the published ethnicity and disability pay gap statistics.
The underlying approach to capturing and calculating these ethnicity and disability pay gap statistics are fully aligned with those used for gender pay gap reporting. Additionally, for ethnicity pay gap reporting our work has further drawn on the government guidance Ethnicity pay reporting: guidance for employers published in April 2023.
2. Interpreting the pay gaps
2.1 Earnings pay gaps
Earnings pay gaps are calculated by taking all full-pay relevant civil servants (employee who was paid full ordinary pay in March of the reference year) and then calculating the mean and median hourly earnings according to ethnicity or disability.
When calculating a pay gap there are always two groups to compare. In these statistics we have used the terms “focal group” and “comparator group” for these two groups. The gap is calculated as the difference in earnings between the focal group and the comparator group as a percentage of the earnings of the comparator group:
- (comparator group earnings - focal group earnings)/ comparator group earnings * 100
The earnings pay gap, therefore, is a measure of how much lower or higher the focal group earnings are compared to the comparator group (as a percentage of the comparator group earnings).
When the % gap is positive (more than zero) the % is how much less the focal group earns compared to the comparator group. Conversely, when the % gap is negative (less than zero) the % is how much higher the focal group earnings are compared to the comparator group.
For all disability pay gaps the focal group is always the “disabled group” and the comparator group the “non disabled” group. This means the pay gap is always how much lower or higher the disabled group earnings are compared to the non-disabled group. The calculation is as follows (using the formula above):
- (non disabled earnings - disabled earnings)/non disabled earnings *100
Ethnicity pay gaps, however, are more complex as there are more than two groups. For the Civil Service there are five high level groups being compared and it is not prescribed which group should be the focal and which the comparator. This means there are many more combinations and, therefore, pay gaps.
If we want to compare the earnings of Black civil servants to White civil servants where White civil servants are the comparator group and Black civil servants are the focal group then using the pay gap formula above the calculation becomes:
- (White earnings - Black earnings)/White earnings * 100
White earnings are the mean or median hourly earnings for White civil servants. Black earnings are the mean or median hourly earnings for Black civil servants.
Pay gaps will differ according to which ethnic group is the focal group and which is the comparator group. In the following hypothetical example where White civil servants have median hourly earnings of £15 per hour, and Black civil servants have median hourly earnings of £14 per hour, then the median earnings pay gap would be either
-
(15 - 14) / 15 *100 = 6.7% where Black civil servants are the focal group and White civil servants are the comparator group, then median hourly earnings of Black civil servants are 6.7% lower than White civil servants median earnings.
-
(14 - 15) / 14 *100 = -7.1% where White civil servants are the focal group and Black civil servants are the comparator group. White civil servants median hourly earnings are 7.1% higher than Black civil servants median earnings.
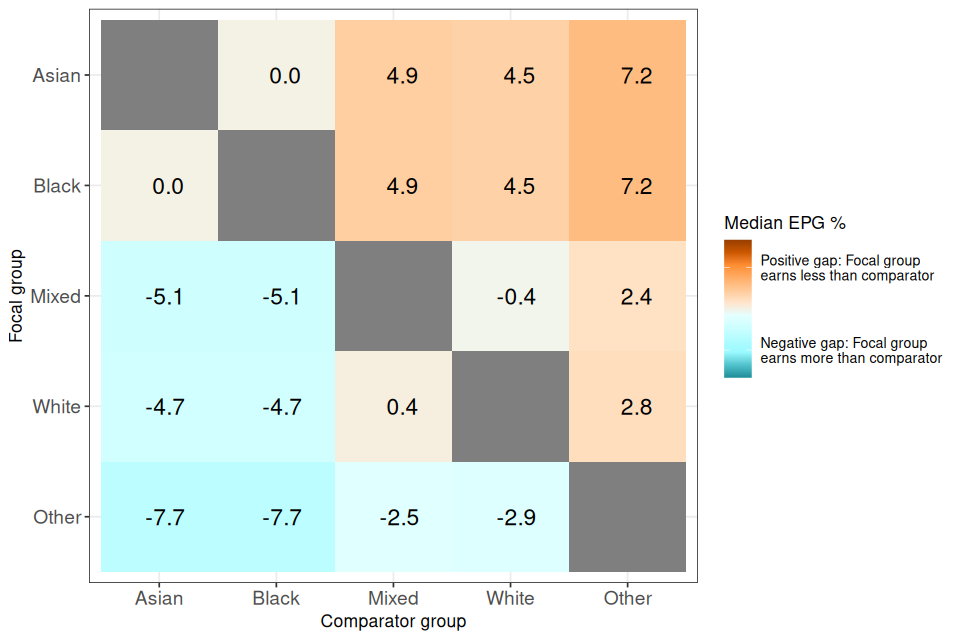
Rather than make assumptions about which group should be the comparator group when making and presenting the calculations we have published both pay gaps in the form of a grid as below.
Interpreting the pay gap grid
The grid below is taken from the 2025 results for median earnings, where Black civil servants are the focal group and White civil servants are the comparator group the median earnings gap is 4.5%. This means that Black civil servants earn 4.5% less than White civil servants.
Conversely, when White civil servants are the focal group and Black civil servants are the comparator group the median earnings gap is -4.7%. This means that White civil servants earnings are 4.7% higher than Black civil servants.
2.2 Bonus pay gaps
Bonus pay gaps are calculated for all full-pay relevant civil servants but also include staff on reduced or unpaid leave during March 2025. All civil servants who received a bonus in the reference month are included and then the mean and median bonuses calculated for different ethnicity and disability groups. The bonus pay gaps are then calculated and presented using the same methodology outlined in 2.1 above.
3. Ethnicity pay gaps in London and Outside London
Additional ethnicity pay gap statistics have been calculated for the Civil Service inside London and the Civil Service outside London. This is because 42% of all ethnic minority civil servants are based in London compared to 14% of White civil servants (as at 31 March 2025). Civil servants based in London are, on average, paid more than those outside London. In combination this means that the differences in earnings for the overall Civil Service may not reflect the differences that are seen in London or outside London when considered separately.
Disability pay gaps are not presented for the Civil Service broken down by London and outside London. This is because the proportion of all staff in London declaring a disability is more comparable to the proportion of all staff outside London declaring a disability.
4. Proportion receiving a bonus
All full pay relevant civil servants and those on unpaid or sick leave are included in the proportion receiving bonus payment calculation. These figures show the proportion of civil servants in an organisation who received a bonus in the reference year (for 2025, 1 April 2024 to 31 March 2025)
5. Pay quartiles
Pay quartiles are calculated using only full pay relevant civil servants. Civil servants are ranked according to salary and then assigned to a pay quartile. We also present the overall breakdown of civil servants according to ethnicity or disability as a reference for the pay quartiles. Note that this overall breakdown is for full pay relevant civil servants only and therefore will not match the ethnicity breakdown published in Civil Service Statistics.
6. Suppression rules
6.1 Declaration rate
For data quality purposes we require the declaration rate for ethnicity and disability to be 60% or above. The following calculation is used to determine the declaration rate for disability:
(Disabled civil servants + Non-disabled civil servants)/(All civil servants)
The same calculation is used for ethnicity pay gap reporting but with ethnic groups in place of Disabled and Non-disabled. The declaration rate is calculated for each pay gap statistic (earnings pay gaps, bonus pay gaps, proportion receiving bonus) and suppressions applied if the declaration rate falls below 60%.
6.2 Organisation size
If the headcount for an organisation is below 250 then only earnings pay gaps will be published. The bonus pay gaps and pay quartiles will be suppressed.
6.3 Headcount
If the headcount for an ethnicity or disability group is less than 30 then all statistics referring to that particular group are suppressed..
For example, for an organisation with 60 White civil servants , 55 Asian civil servants, but only 25 black civil servants, all pay gaps referring to Black civil servants would be suppressed. Pay gaps between White and Asian civil servants would still be presented for this organisation as they have over 30 individuals in each group.
6.4 Quartile suppressions
The following example is given for calculating ethnicity pay quartiles but the same principles are applied when creating disability pay quartiles.
There must be at least 30 individuals for each non-zero ethnicity group in an organisation in order to present pay quartiles. Organisation A has enough civil servants in each group to calculate pay quartiles.
Organisation A
| Asian | Black | Mixed | White | Other ethnicity | |
|---|---|---|---|---|---|
| 68 | 89 | 125 | 1000 | 320 |
Organisation B does not have any Black civil servants and so the 30 headcount rule is not applied to this demographic group. Pay quartiles can be calculated for Organisation B.
Organisation B
| Asian | Black | Mixed | White | Other ethnicity | |
|---|---|---|---|---|---|
| 84 | 0 | 32 | 230 | 84 |
There are fewer than 30 Asian individuals in organisation C and therefore pay quartiles will not be calculated.
Organisation C
| Asian | Black | Mixed | White | Other ethnicity | |
|---|---|---|---|---|---|
| 23 | 59 | 124 | 568 | 64 |
There must also be more than one ethnic group represented amongst the civil servants in an organisation. Suppression of the pay quartiles are not necessary where unknown and undeclared civil servants number less than 30 individuals.
Once pay quartiles are calculated an additional suppression is then made - no pay quartiles are published where there are less than 5 individuals from an ethnic group in any of the four quartiles. Organisation B will not have pay quartiles published as there are less than 5 Asian civil servants in quartile four.
Organisation B
| Ethnic Group | Q1 | Q2 | Q3 | Q4 |
|---|---|---|---|---|
| Asian | 50 | 22 | 8 | 4 |
| Black | 0 | 0 | 0 | 0 |
| Mixed | 9 | 18 | 20 | 5 |
| Other ethnicity | 19 | 20 | 25 | 20 |
In this situation pay halves can be calculated instead of pay quartiles. If after creating pay halves there are still less than 5 individuals from an ethnic group in a pay half then neither quartiles or pay halves can be produced for this organisation.