Main findings: children’s social care in England 2026
Published 30 July 2026
Applies to England

© Crown copyright 2026
This publication is licensed under the terms of the Open Government Licence v3.0 except where otherwise stated. To view this licence, visit nationalarchives.gov.uk/doc/open-government-licence/version/3 or write to the Information Policy Team, The National Archives, Kew, London TW9 4DU, or email: psi@nationalarchives.gov.uk.
Where we have identified any third party copyright information you will need to obtain permission from the copyright holders concerned.
This publication is available at https://www.gov.uk/government/statistics/childrens-social-care-in-england-2026/main-findings-childrens-social-care-in-england-2026
This is the main findings report for the children’s social care in England 2026 release. The following are also available:
- underlying data
- methodology
- pre-release access list
Summary
This release contains:
- the number of providers of children’s social care, and the number of places they are registered for, as at 31 March 2026
- the most recent inspections and outcomes for all regulated and inspected children’s social care provision, as at 31 March 2026, and published by 30 April 2026
- outcomes for all regulated and inspected children’s social care provision inspections carried out between 1 April 2025 and 31 March 2026 and published by 30 April 2026
- the number of providers of supported accommodation registrations, and the number of places they are registered for, as at 31 March 2026
Main findings
During the 2025–26 inspection year:
-
the children’s social care sector continued to grow and now has 6,700 providers, with a 20% increase in the number of children’s homes and a 37% increase in the number of supported accommodation providers
-
an additional 330 supported accommodation providers were registered. There was also considerable diversity in the categories of accommodation offered, as well as in the number of premises operated by each provider
-
we found that the number of new children’s homes (including short-break-only children’s homes) in England continues to rise year on year and has increased by 70% since March 2022
-
we found that newly registered children’s homes continue to be smaller on average: those registered in-year had a mean capacity of 3, compared to 4 in children’s homes registered before the start of the year
-
there was a 6% increase in the number of residential family centres compared to the previous year
-
the proportion of children’s homes rated good or outstanding for ‘help and protection’ and for ‘leadership and management’ at full inspections in 2025–26 remained in line with the previous year
Introduction
Ofsted reports each year on social care inspections and outcomes for regulated providers and other providers of placements for children in England.
Out of the 12.2 million children living in England, around 402,000 (3%) are in the social care system at any one time, including children in need and children with child protection plans. Nearly 82,000 of these children are in care.
We regulate and inspect providers that offer accommodation, care and support for looked-after children and children in other types of settings. More information about the different types of provider can be found in the glossary.
Social care providers and places as at 31 March 2026
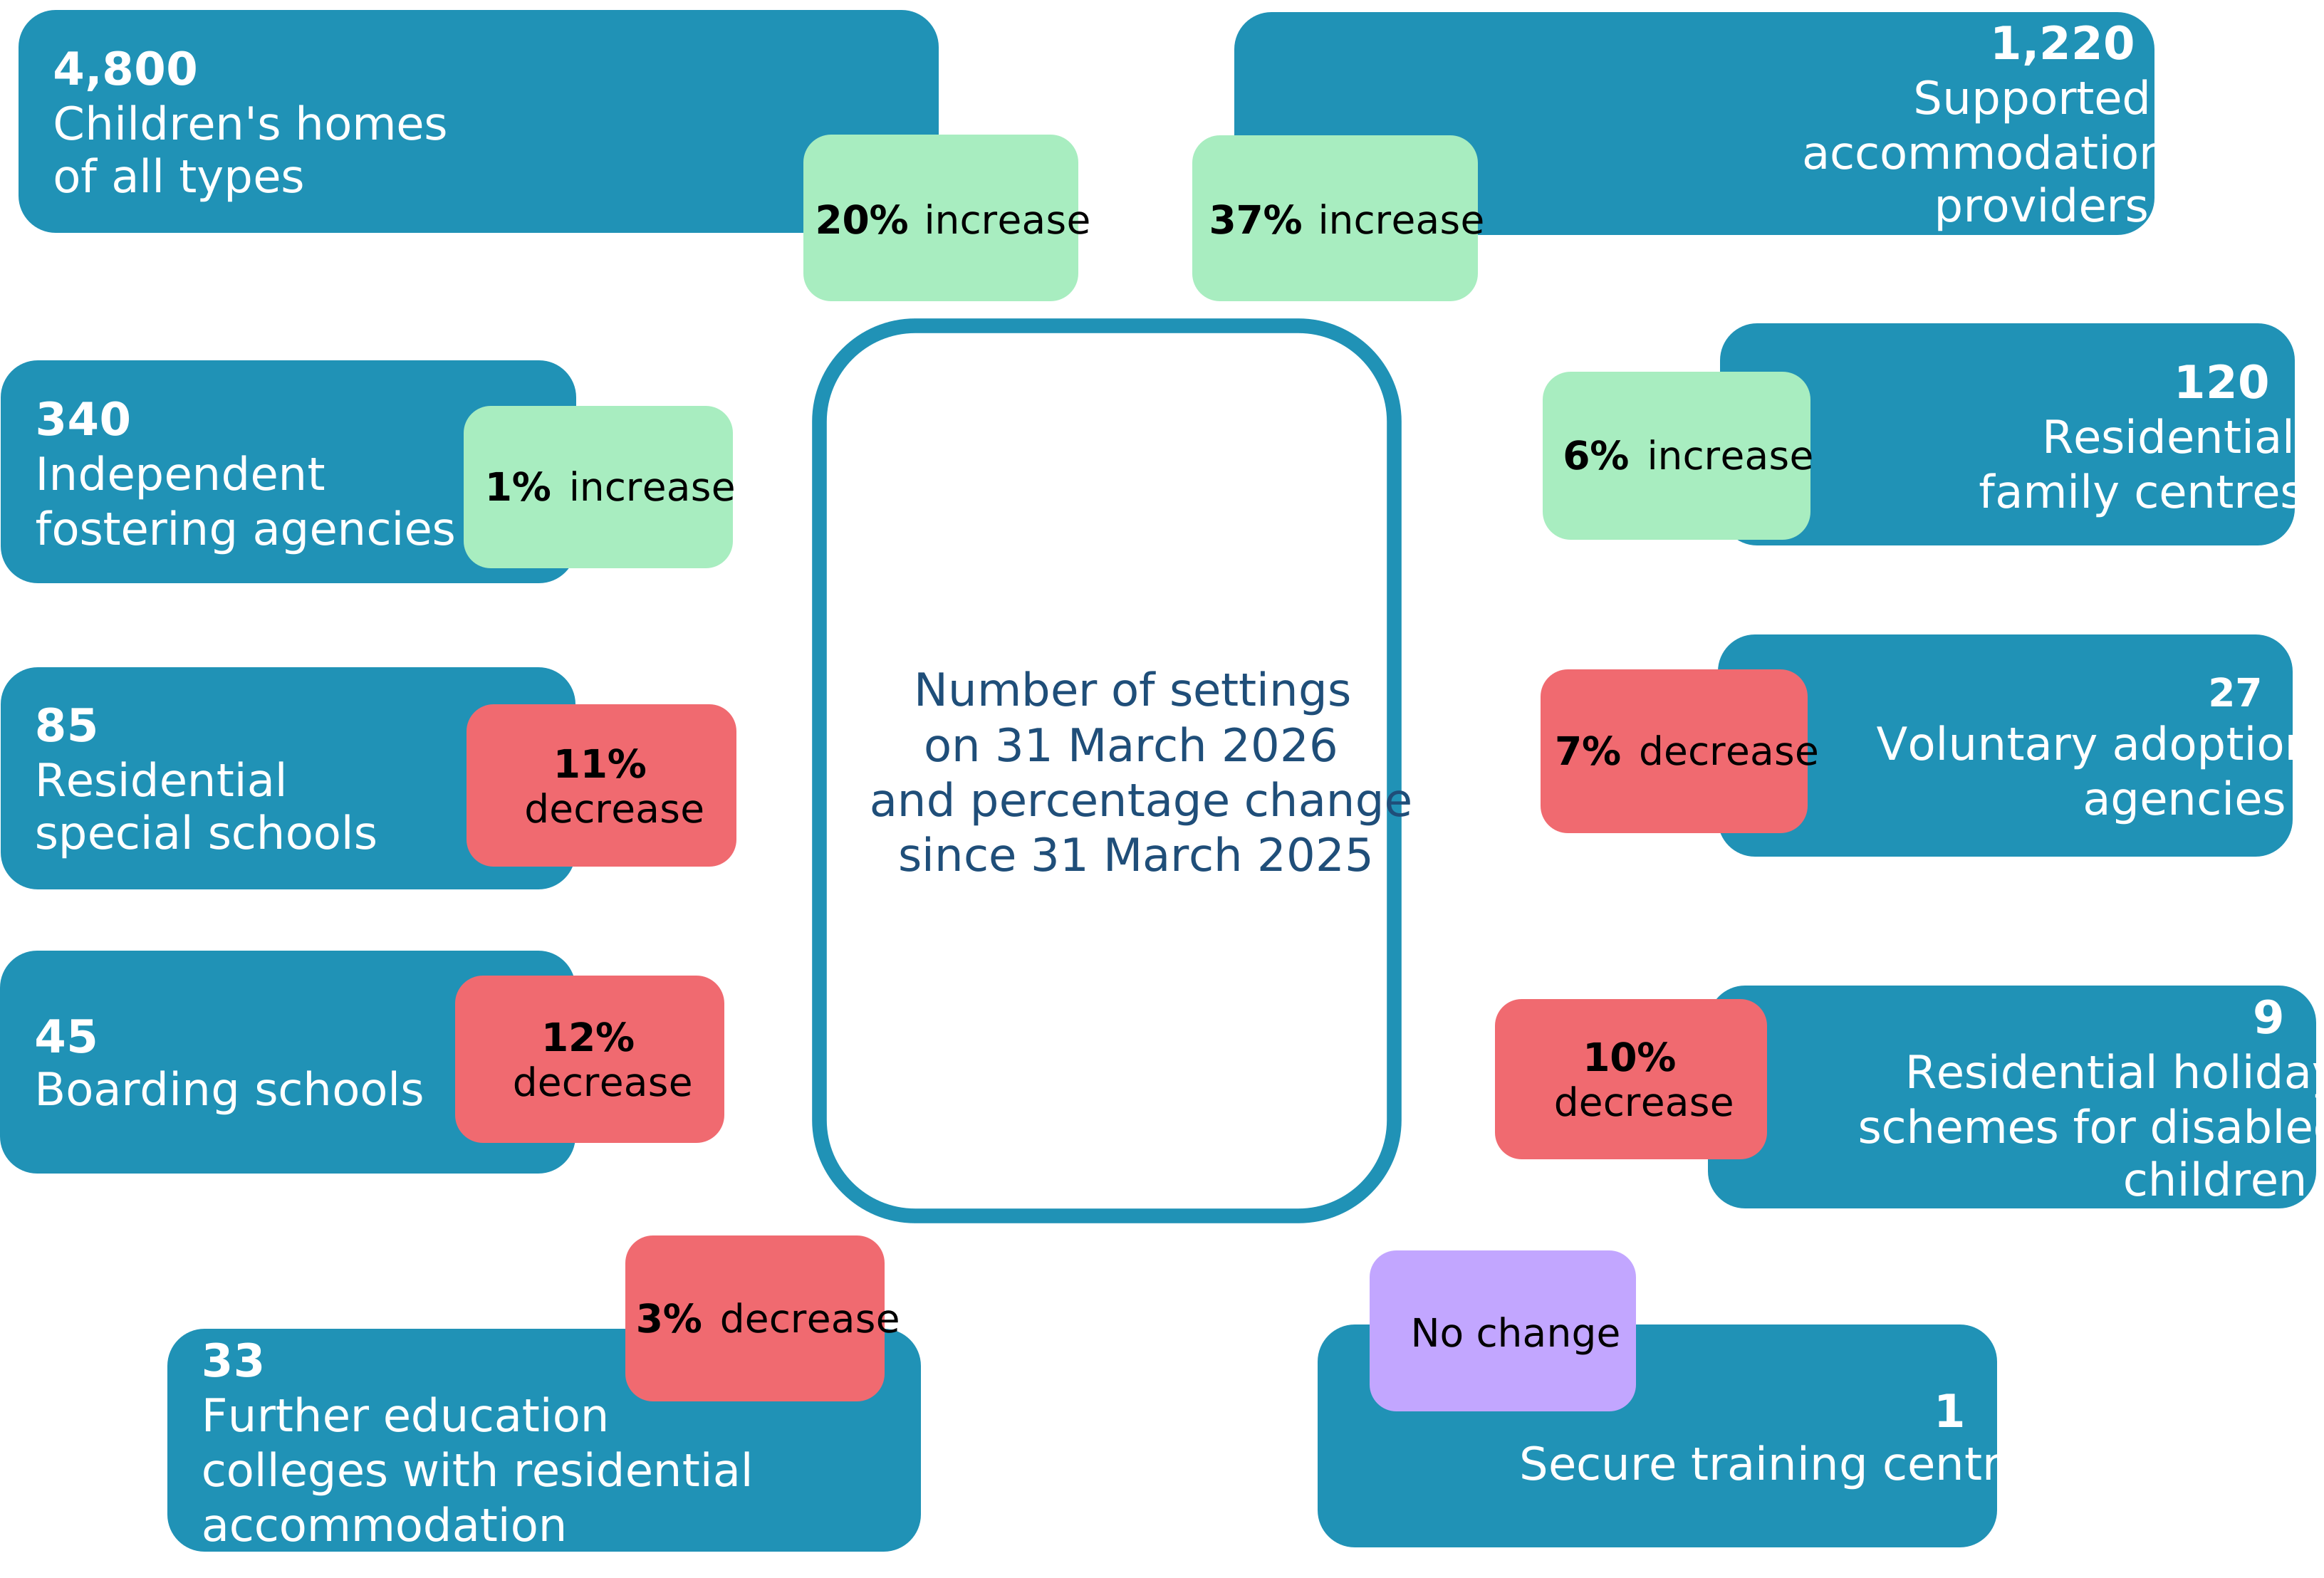
On 31 March 2026, there were 6,700 active or suspended children’s social care providers, excluding local authorities and Cafcass.
This year’s figure represents a 20% increase compared with 31 March 2025, when there were 5,600 providers.
Figure 1: Number of settings on 31 March 2026 and percentage change since 31 March 2025
1. See Notes for rounding guidelines.
2. Due to legislative changes introduced in 2023, not all adoption support agencies are now required to register with Ofsted. As a result, comparisons over time reflect only those agencies that are registered, rather than the total number operating. As at 31 March 2026, 20 adoption support agencies were registered with Ofsted, representing a 31% decrease from the previous year.
View data in an accessible format.
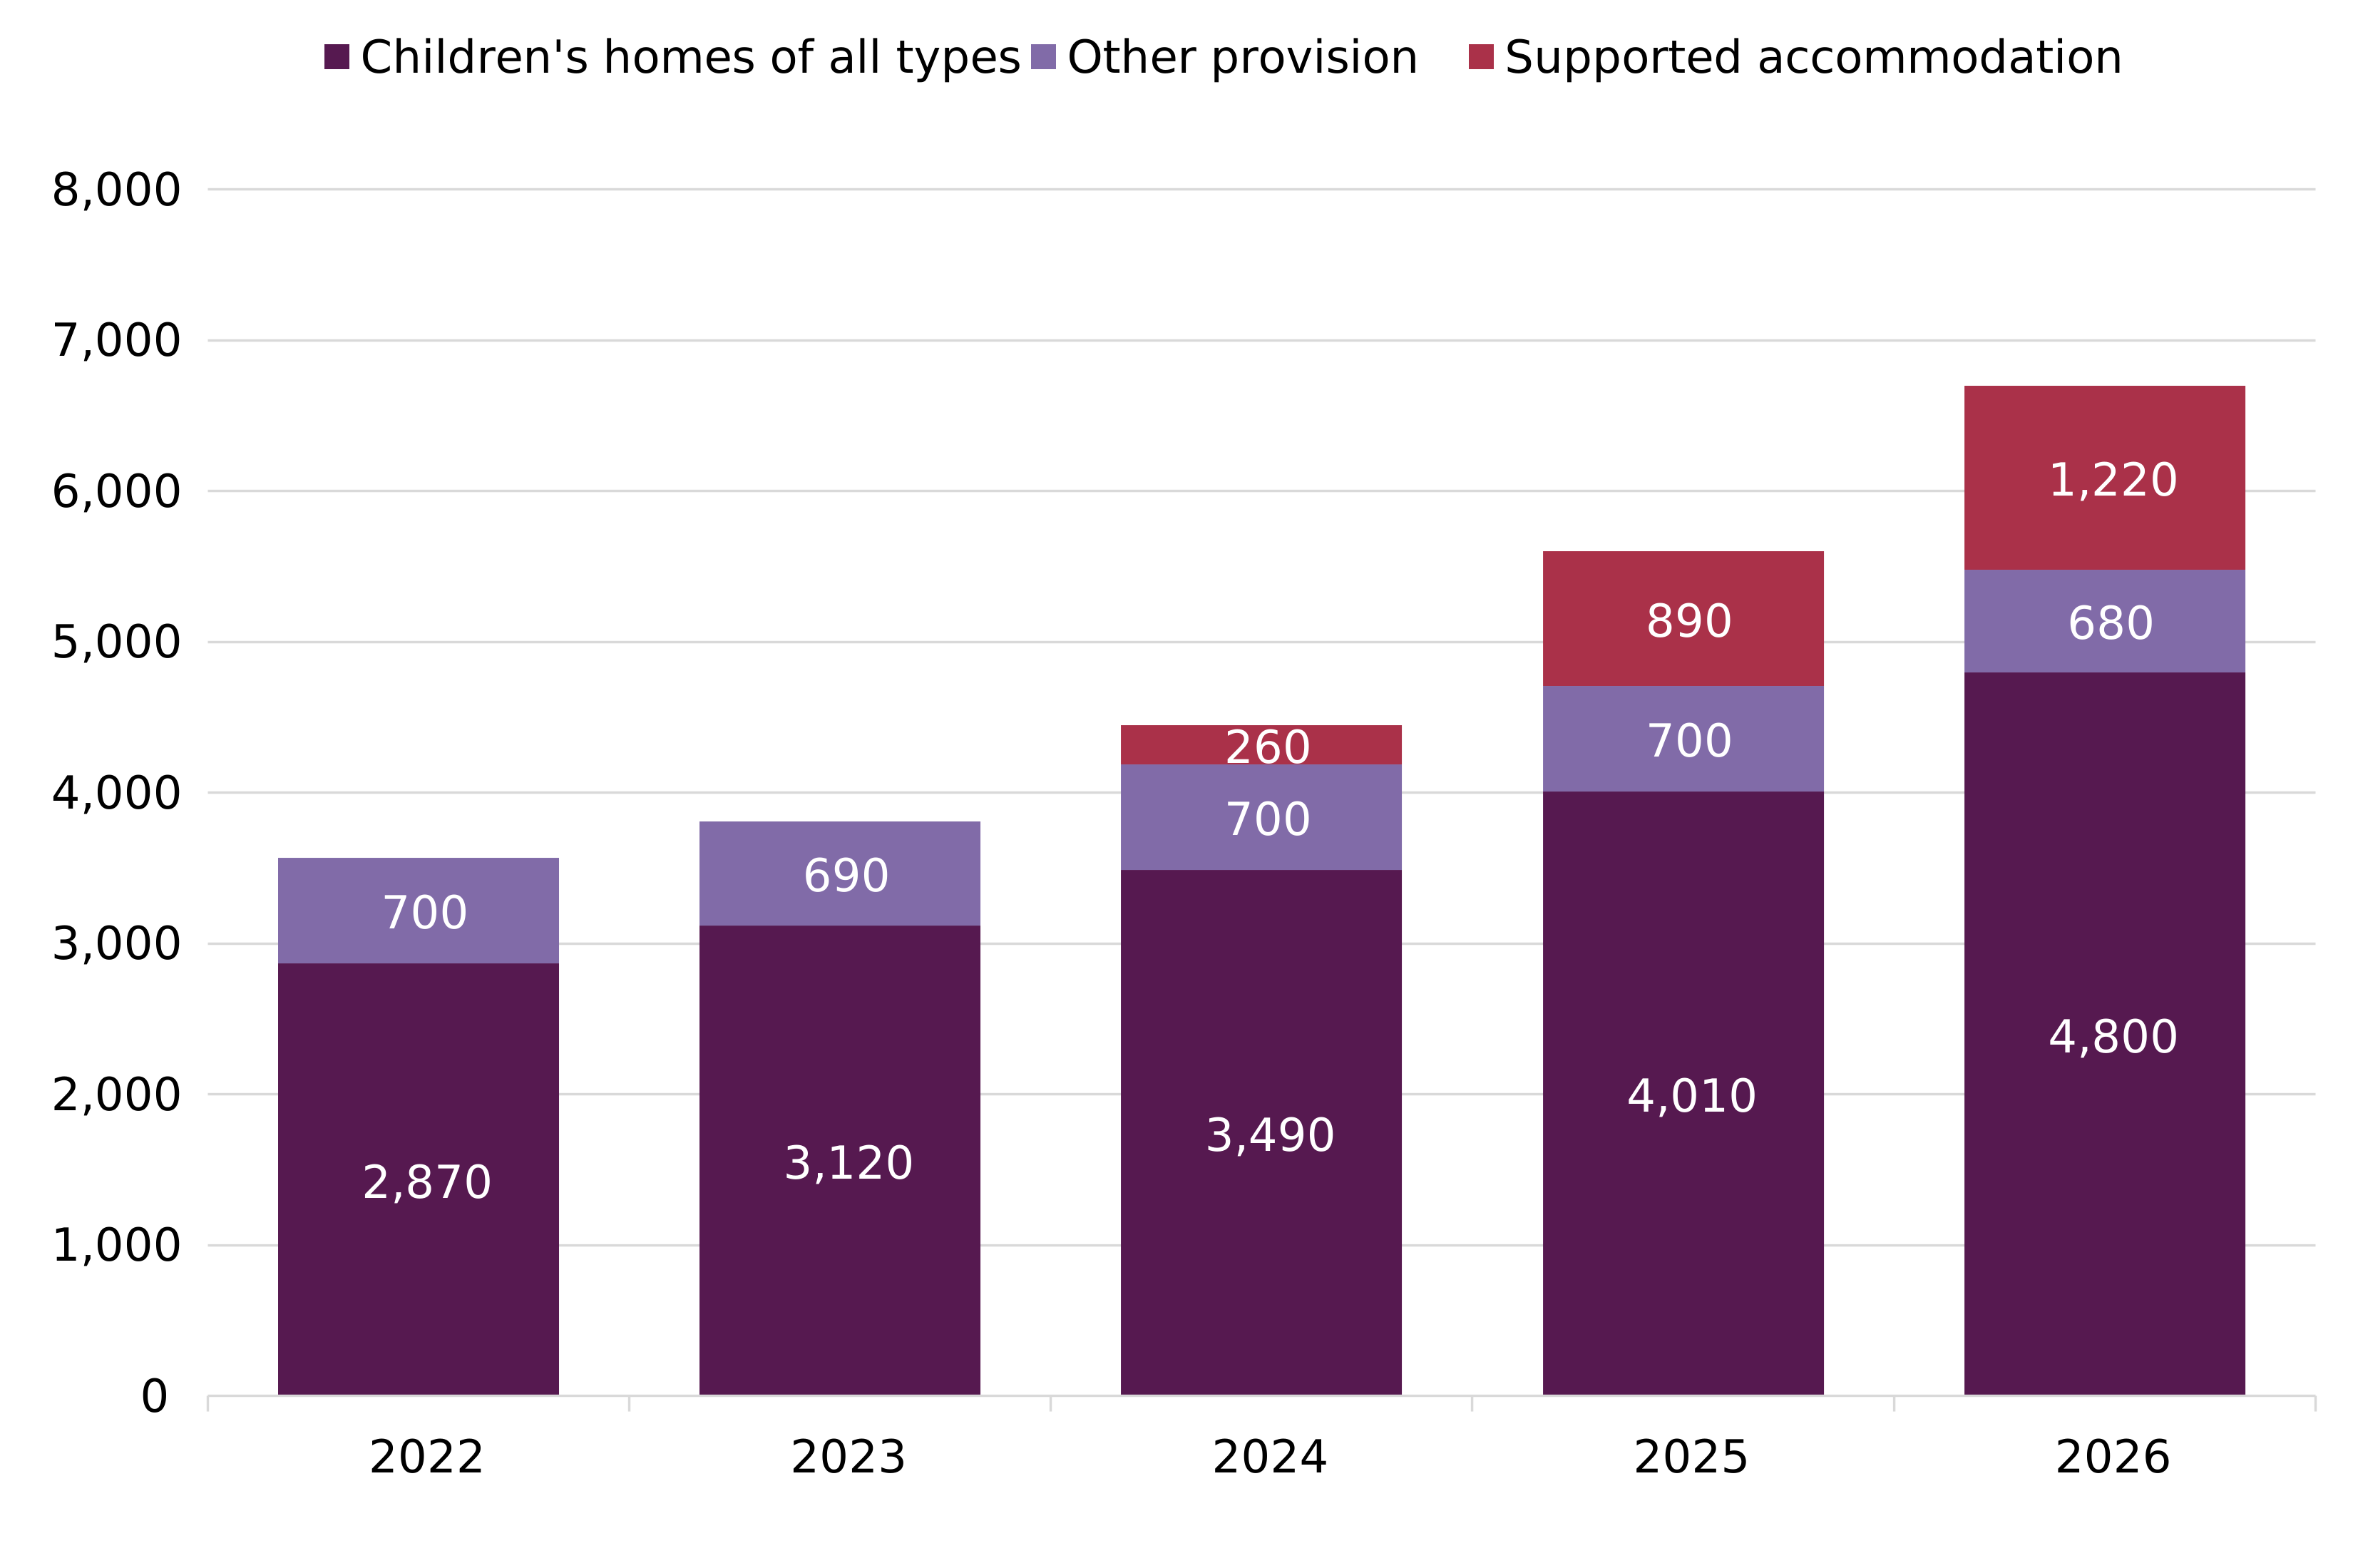
The overall sector growth in 2025–26 was largely driven by the ongoing increase in children’s homes and the continued registration of supported accommodation providers. (Supported accommodation providers were not regulated before April 2023.)
Figure 2: The number of children’s social care providers by type as at 31 March for the years 2022 to 2026
1. See Notes for rounding guidelines.
2. The ‘other provision’ category includes residential special schools, residential family centres, boarding schools, further education colleges with residential accommodation, secure training centres, adoption support agencies, voluntary adoption agency branches, independent fostering agencies and residential holiday schemes for disabled children.
View data in an accessible format.
Children’s homes of all types
In this section, we report on the 3 types of children’s homes:
- secure children’s homes
- residential special schools registered as children’s homes
- children’s homes (including short-break-only children’s homes)
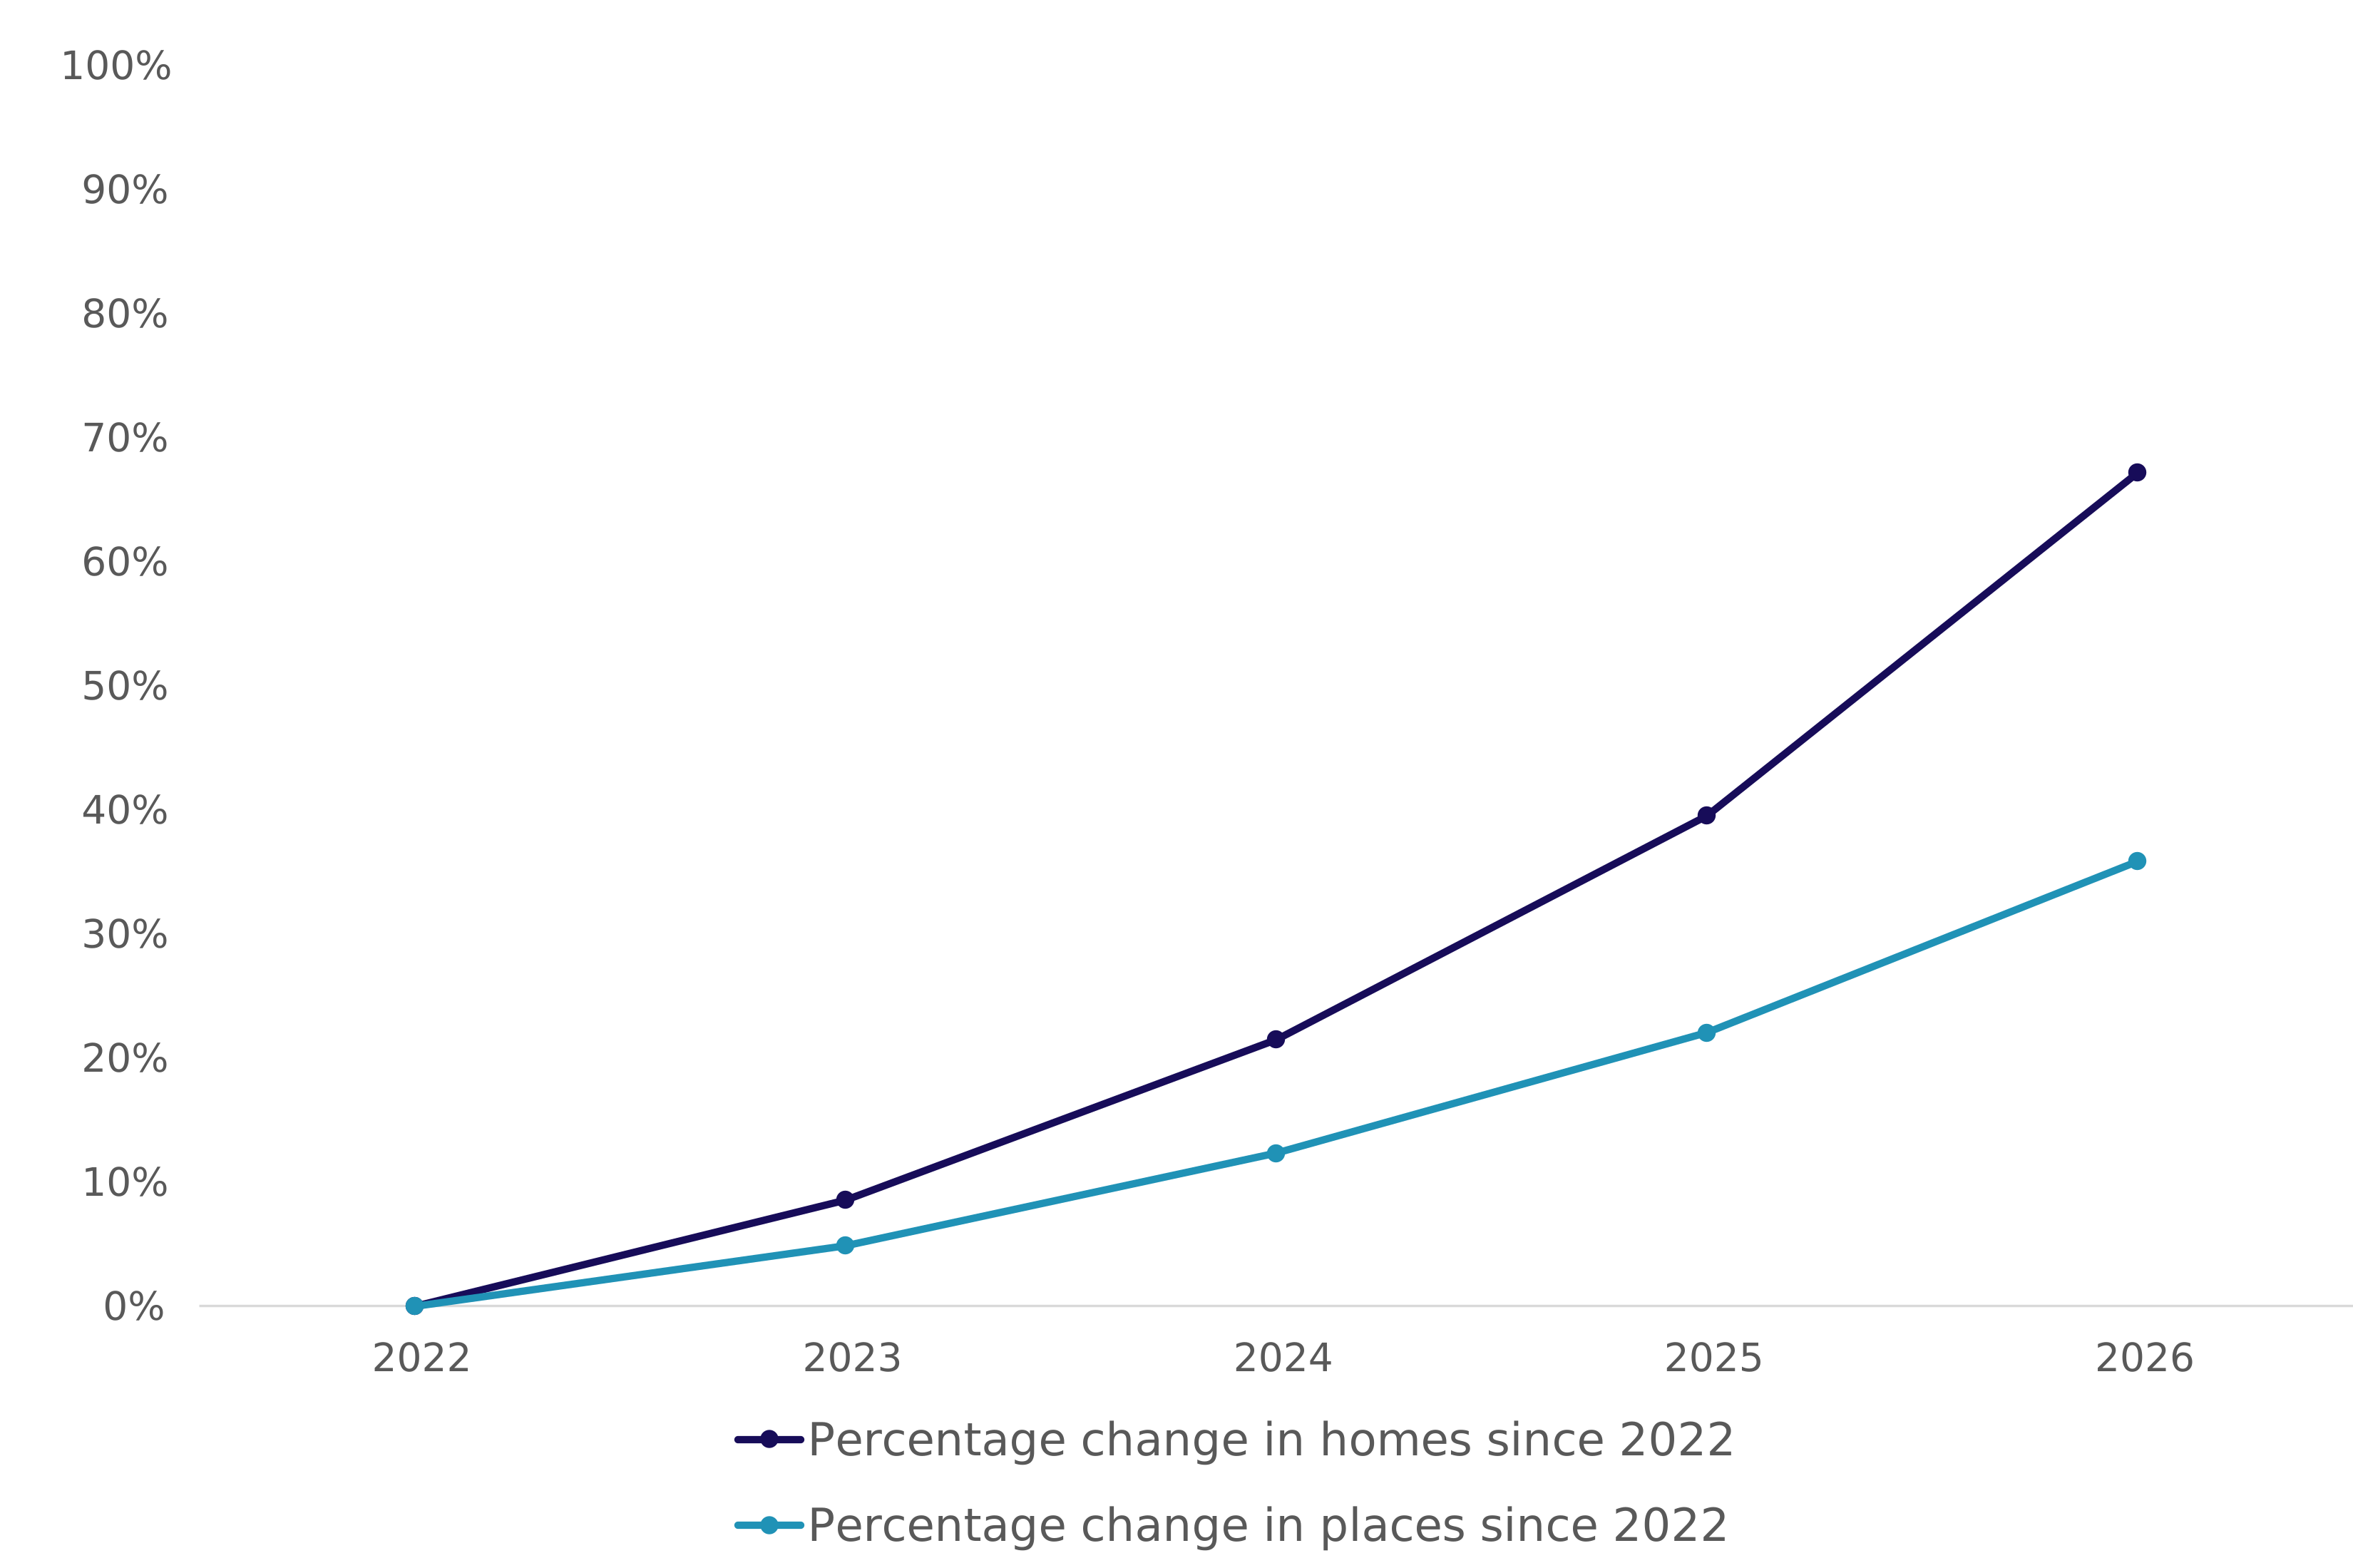
There were 4,800 children’s homes of all types as at 31 March 2026. This was a 20% increase (800 homes) from the previous year (4,010). The longer term trend shows a 67% rise (1,930 homes) since 31 March 2022, almost entirely driven by the continued increase in the number of children’s homes (including short-break-only children’s homes).
In total, children’s homes of all types had 17,500 registered places. This represents an 11% increase in potential capacity since 31 March 2025 and a 36% increase from 31 March 2022, when there were 12,900 registered places in total.
Figure 3: Percentage change in the number of children’s homes of all types and their potential capacity since 2022
1. See Notes for rounding guidelines.
View data in an accessible format.
The majority of children’s homes across all types are privately owned. This trend has continued to grow steadily and reached 85% (4,090) in 2026. Most new registrations this year have also been in the private sector, which reinforces this ongoing shift. Read more about ownership in children’s social care.
However, within this broader category, residential special schools registered as children’s homes have a lower proportion that are privately owned: 74% (32) of them are privately operated, accounting for 68% (740) of available places. None of the secure children’s homes are operated by private organisations – 12 of the 14 settings are run by local authorities and 2 by voluntary organisations.
Children’s homes
In this section we report on children’s home providers (including short-break-only children’s homes) as at 31 March 2026.
Size and structure of homes
For the 4,750 children’s homes, the average number of places was 3, for both those registered during the year and those active or suspended as at 31 March 2026. This is compared to 4 in children’s homes registered before the start of the year.
The number of children’s homes has risen increasingly rapidly over recent years. In 2025–26, the number of homes rose by 20% to 4,750, up from 3,950 at the end of the previous year. Over a 5-year period the number of children’s homes has grown by 70%, up from 2,800 homes as at 31 March 2022.
The number of registered places also grew this year by 13% (reaching 16,200), which is a steeper increase than the previous year’s growth. Over the past 5 years there has been a 46% increase in places.
A small number of children’s homes offer short-break-only care. As at 31 March 2026, there were 120 (3%) providers on record as providing care exclusively for short breaks, offering a potential capacity of 690 (4%) places.
Regional distribution
As in previous years, children’s homes are not distributed evenly across the country. All regions saw an increase in the number of homes and places in them. As at 31 March 2026, the North West had the most children’s homes (1,250) and places (3,580). The South West had the fewest homes (300) and the fewest places (890).
Table 1: The number of children’s homes (including short-break-only homes), providers and places as at 31 March 2026 and the net change in each since 31 March 2025, by region
| Region | Number of children’s homes | Number of children’s home places | Net change in providers since 31 March 2025 | Net change in places since 31 March 2025 |
|---|---|---|---|---|
| North West | 1,250 | 3,580 | +230 | +370 |
| West Midlands | 720 | 2,390 | +91 | + 250 |
| North East, Yorkshire and the Humber | 650 | 2,240 | +71 | +100 |
| East Midlands | 610 | 2,030 | +150 | +400 |
| South East | 490 | 2,170 | +74 | +230 |
| East of England | 390 | 1,490 | +56 | +150 |
| London | 350 | 1,400 | +96 | +300 |
| South West | 300 | 890 | +36 | +99 |
| England | 4,750 | 16,200 | +800 | +1,910 |
1. See Notes for rounding guidelines.
This year, the North West experienced the largest overall increase in number of settings (an increase of 230). This continues a longer-term trend. Over the past few years, the region has consistently recorded the highest year-on-year increase in children’s homes. While 26% of children’s homes are located in the North West, only 18% of looked-after children come from that region.
The East Midlands experienced the largest overall increase in potential capacity (an increase of 400), while London had the largest proportion growth of capacity (27%) from 31 March 2025.
Inspection of all types of children’s homes during 2025 to 2026
Between 1 April 2025 and 31 March 2026, we carried out a total of 5,530 full or monitoring inspections or assurance visits of 4,350 children’s homes of all types.
Under the social care common inspection framework (SCCIF), full inspections of children’s homes result in published judgements on the overall experiences and progress of children, taking into account:
- how well children are helped and protected
- the effectiveness of leaders and managers
Full inspections of secure children’s homes also take into account:
- children’s education and learning
- children’s health
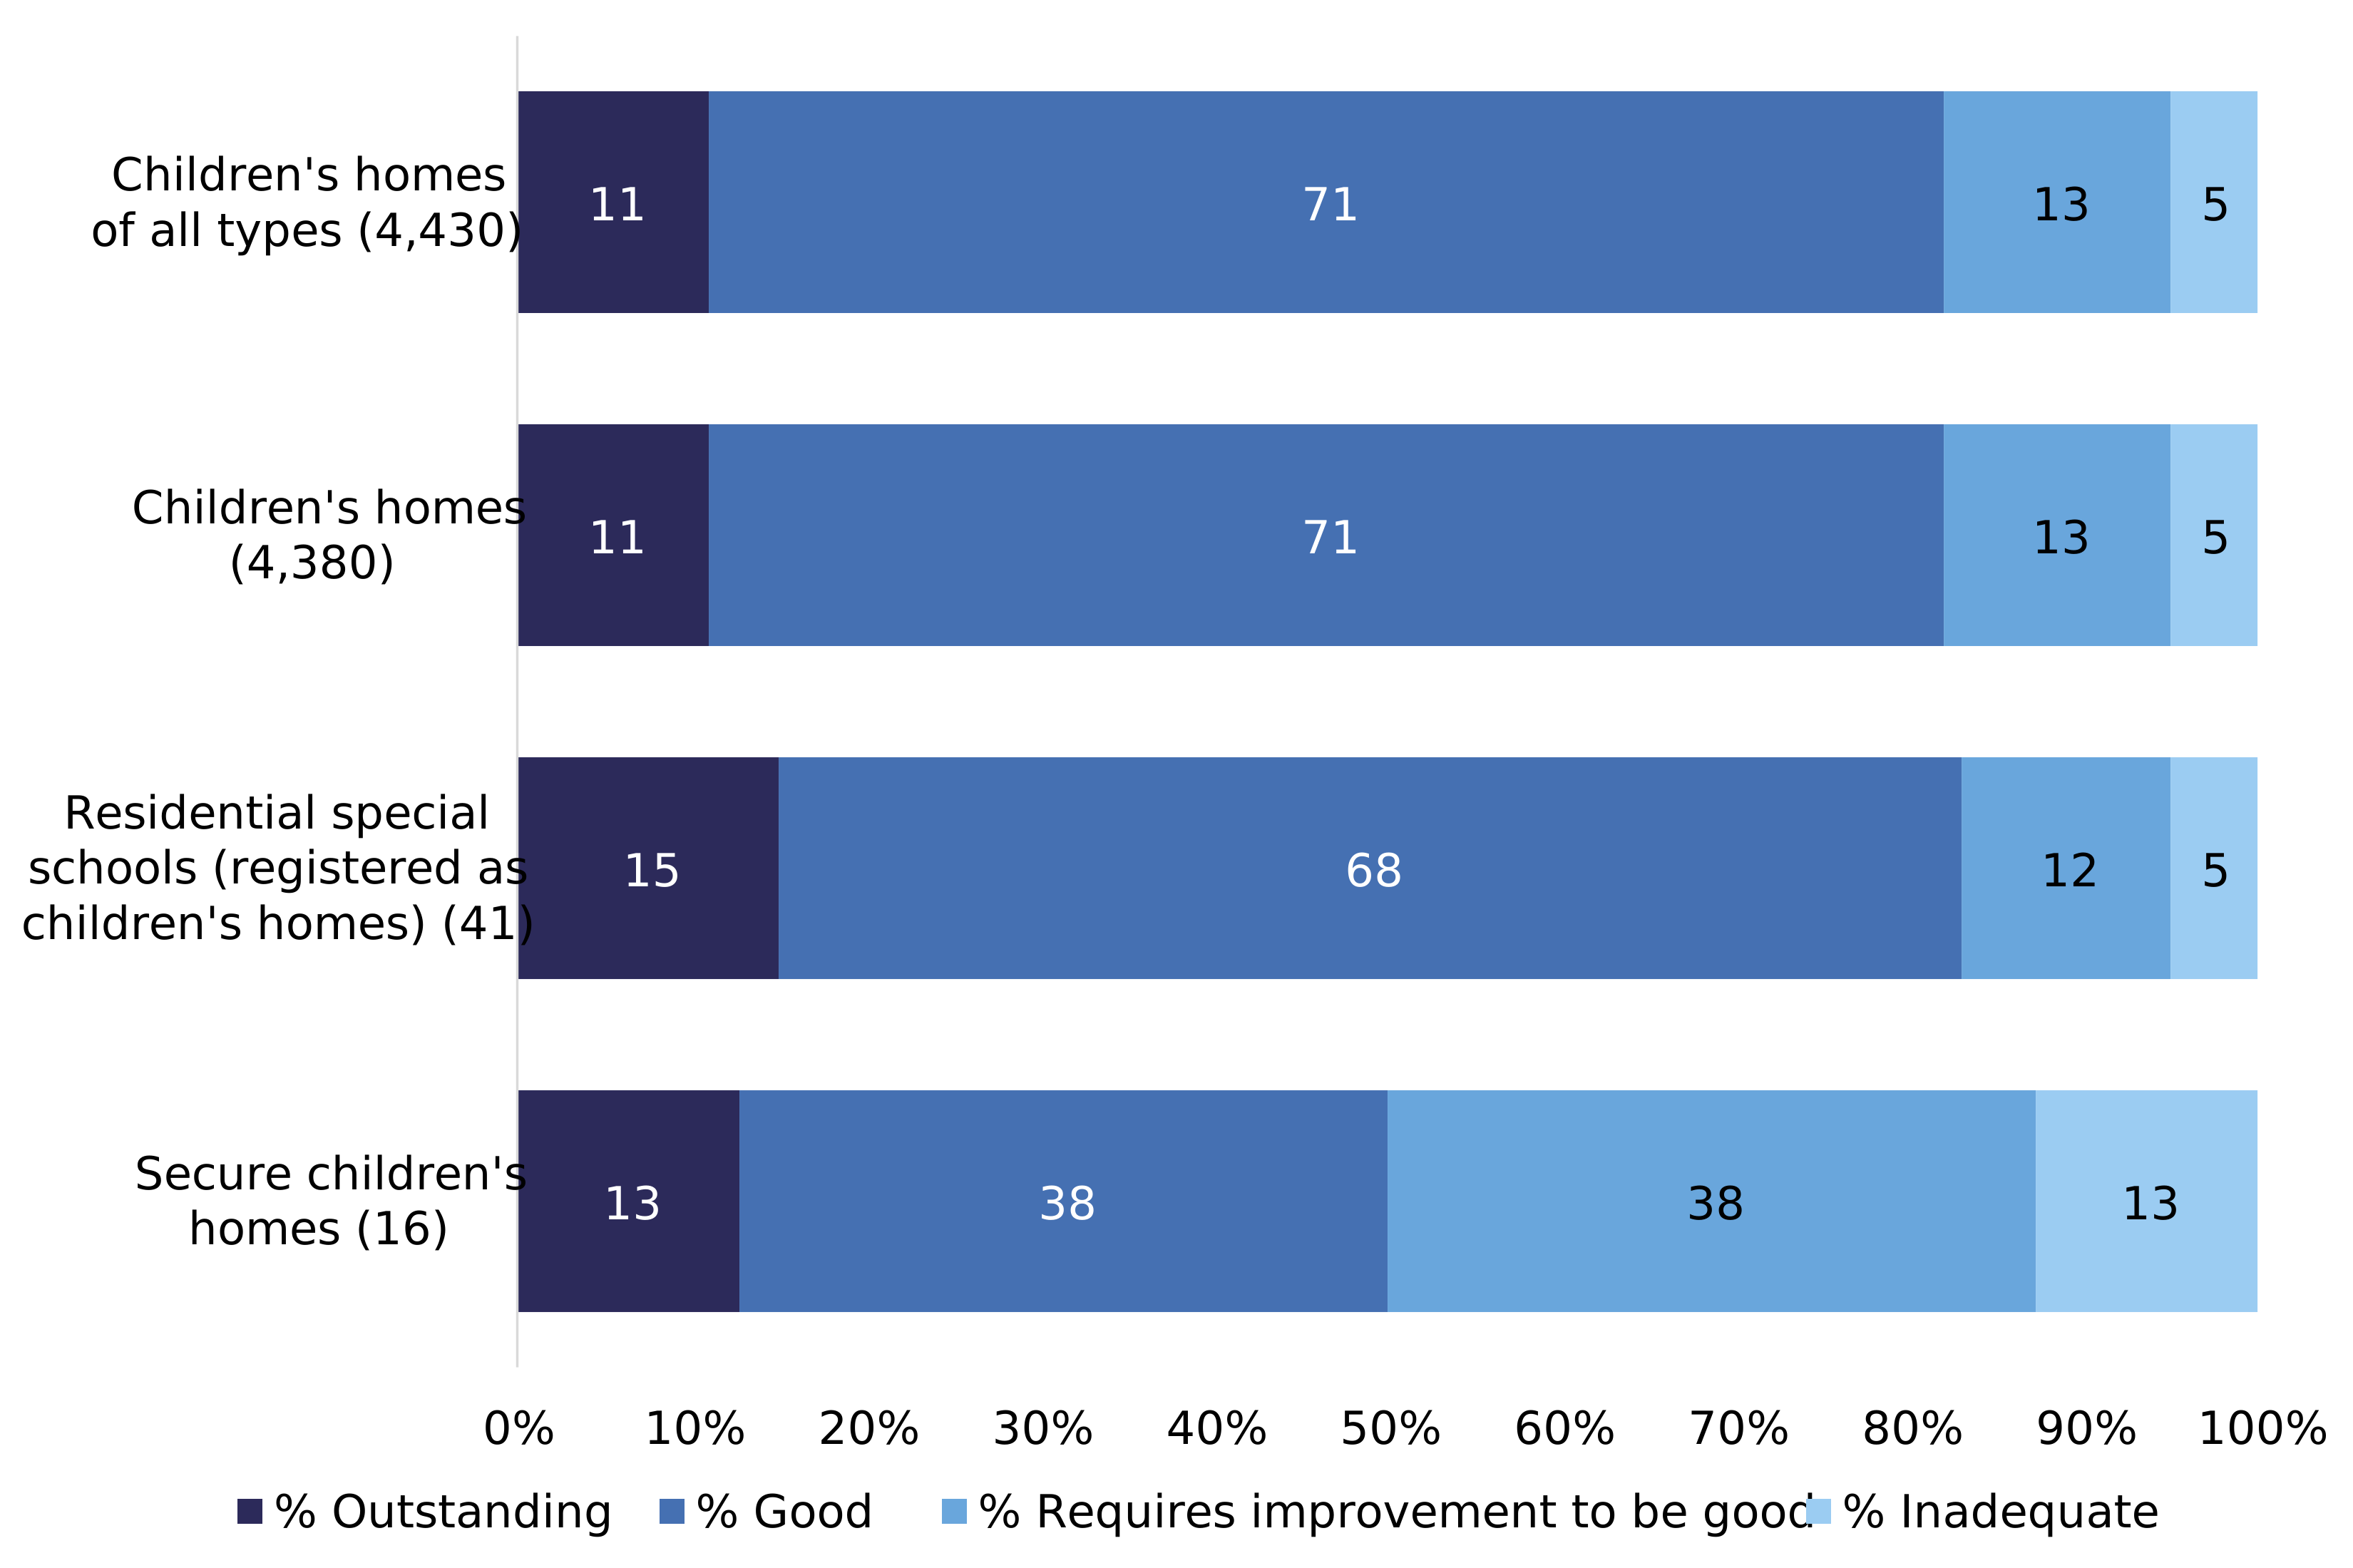
Figure 4: Overall effectiveness judgements from all full inspections of children’s homes of all types carried out between 1 April 2025 and 31 March 2026 by subtype
1. See Notes for rounding guidelines.
2. Totals in brackets represent the number of full inspections of children’s homes of each type carried out between 1 April 2025 and 31 March 2026 and published by 30 April 2026.
3. Percentages are rounded and may not sum to 100.
View data in an accessible format.
Of all full inspections of children’s homes of all types carried out in 2025–26:
- 81% received a good or outstanding judgement for how well children and young people are helped and protected
- 74% received a good or outstanding judgement for the effectiveness of leaders and managers
As at 31 March 2026, 91% of all active or suspended children’s homes of all types had an inspection judgement (4,360 out of 4,800). The proportion of outstanding and good outcomes is broadly in line across the different ownership types. As at 31 March 2026, short-break-only children’s homes and residential special schools (registered as children’s homes) both had a higher proportion of settings with an outstanding grade at their most recent graded inspection, at 26% and 19% respectively, compared with 12% across all types of children’s homes.
Supported accommodation
As at 31 March 2026, there were 1,220 active or suspended supported accommodation providers.
Supported accommodation became a regulated form of provision in April 2023. Every supported accommodation service provider must be registered separately with Ofsted. In this publication, we refer to service providers as ‘providers’. A provider may operate multiple ‘premises’ providing support and accommodation to 16- and 17-year-old looked-after children and care leavers. A small number of providers are located outside of England but operate premises in England or are based in England with premises located outside of England. These providers and premises are counted in the totals in this report and are included in the accompanying dataset, but we do not provide in-depth discussion of out-of-England provision in this release.
This dataset only includes supported accommodation providers that held an active or suspended status as at 31 March 2026.
At the close of the 2025–26 inspection year, there were 1,220 active or suspended providers operating 9,350 open or pending premises, offering 24,700 places. London had the highest proportion of providers (21%, 260). The highest proportions of premises (2,180, 23%) were located in the North West, however the highest proportion of places (4,400, 18%) were located in London.
As at 31 March 2026, the majority of providers were private (1,070, 88%), with voluntary and local authority providers making up 8% (92) and 5% (60) respectively.
Premises and places
Supported accommodation premises can fall into 1 of 4 different categories:
- category 1: supported accommodation in a self-contained unit, where the accommodation is for the sole use of the child or for the child and other individuals living with the child [footnote 1]
- category 2: supported accommodation in a shared- or group-living situation in premises used to accommodate only looked-after children and care leavers
- category 3: supported accommodation in a shared- or group-living situation in premises that are not limited to accommodating looked-after children and care leavers
- category 4: supported accommodation provided by an individual or individuals in a private residence
More information about the different categories can be found in the guidance on providing supported accommodation for children and young people.
Table 2: The number of open or pending supported accommodation premises as at 31 March 2026 by category and region
| Region | Total number of premises | Category 1 | Category 2 | Category 3 | Category 4 |
|---|---|---|---|---|---|
| North West | 2,180 | 1,280 | 280 | 450 | 180 |
| North East, Yorkshire and the Humber | 1,570 | 790 | 370 | 280 | 130 |
| East Midlands | 1,190 | 500 | 340 | 300 | 54 |
| South East | 1,120 | 170 | 380 | 250 | 310 |
| West Midlands | 940 | 270 | 350 | 260 | 55 |
| London | 910 | 120 | 440 | 310 | 43 |
| South West | 730 | 230 | 300 | 120 | 83 |
| East of England | 720 | 100 | 460 | 100 | 56 |
| England | 9,350 | 3,460 | 2,920 | 2,070 | 900 |
1. See Notes for rounding guidelines.
2. A small number of premises located outside of England are not included in the above table.
As at 31 March 2026, category 1 was the most common type of supported accommodation premises (3,460, 37%), while the highest proportion of places was in category 2 premises (10,900, 44%).
Figure 5: Regional distribution of supported accommodation providers, premises and places as at 31 March 2026
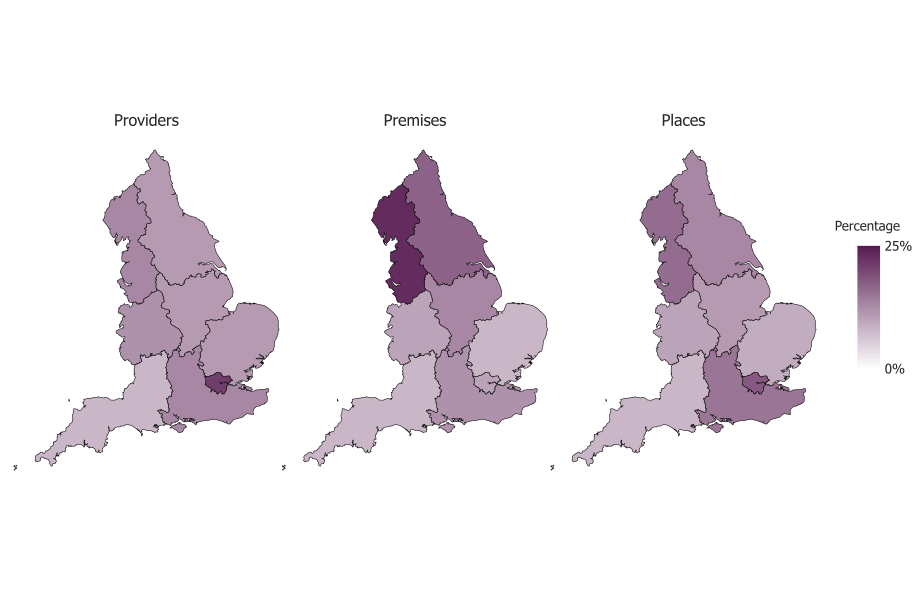
1. A small number of supported accommodation providers (5) and premises (1) are located in Wales or Scotland. We have excluded these from the data in the above visualisation. Places are allocated to a region based on the premises’ location. In all maps, a lighter hue indicates a lower percentage.
View data in an accessible format.
Inspection outcomes of supported accommodation providers
As part of a full or monitoring inspection under the SCCIF, we assess supported accommodation providers on 3 areas of evidence:
- the overall experiences and progress of children
- how well children are helped and protected
- the effectiveness of leaders and managers
Inspection results in a single overall judgement. Unlike other types of social care provision, supported accommodation can receive 1 of 3 outcomes when inspected:
- outcome 1: consistently strong service delivery
- outcome 2: inconsistent quality of service delivery
- outcome 3: serious or widespread weaknesses
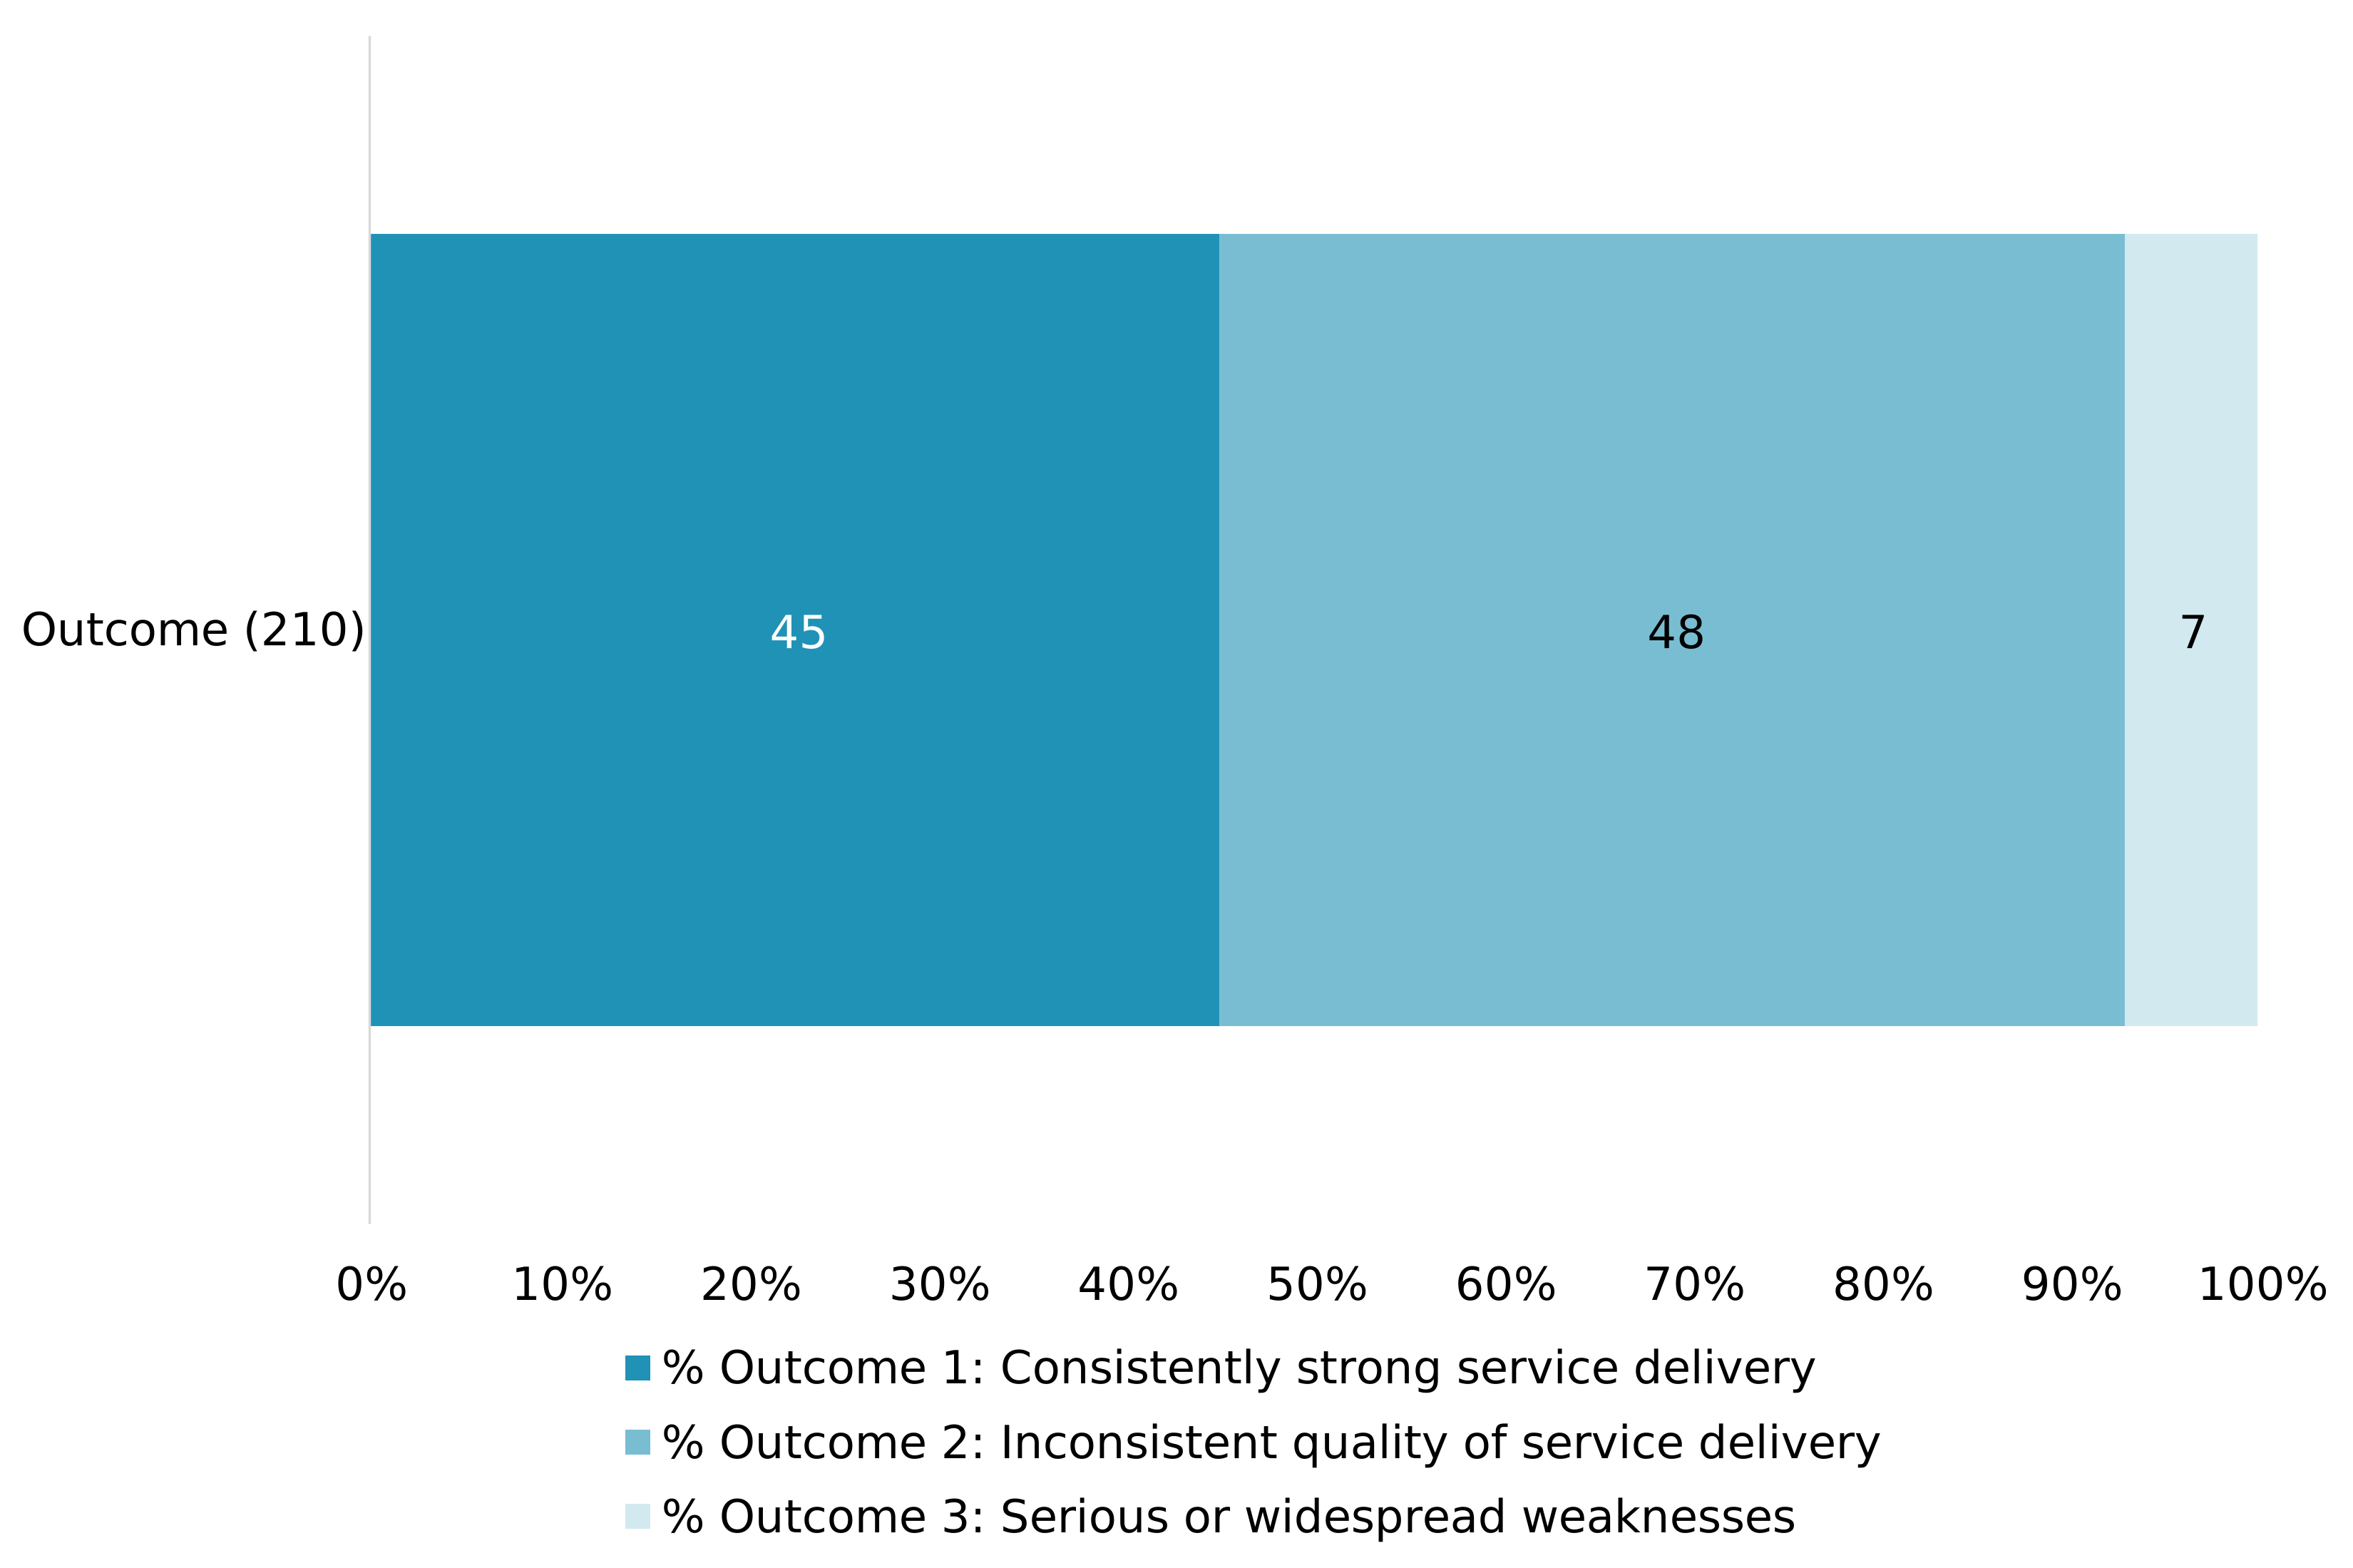
Of the active or suspended supported accommodation providers that had a published full inspection outcome as at 31 March 2026, 45% had received an overall judgment of consistently strong service delivery.
Of the 1,220 supported accommodation providers active or suspended as at 31 March 2026, 210 (17%) had a published full inspection outcome.
Figure 6: Overall judgment outcome of supported accommodation providers as at 31 March 2026
View data in an accessible format.
Other social care providers
As at 31 March 2026, there were 680 social care providers other than children’s homes of all types and supported accommodation providers.
Excluding children’s homes and supported accommodation, the majority of other social care providers were independent fostering agencies, with 340 agencies, and residential family centres, with 120 settings.
The number of residential family centres continues to increase. Residential family centres have seen a 6% increase compared to the previous year. This follows the continued upward trend over the past few years, with the number of residential family centres 72% higher than it was as at 31 March 2022 (68), and 139% higher than it was before the COVID-19 pandemic (49 in 2019).
Inspection outcomes of other social care providers
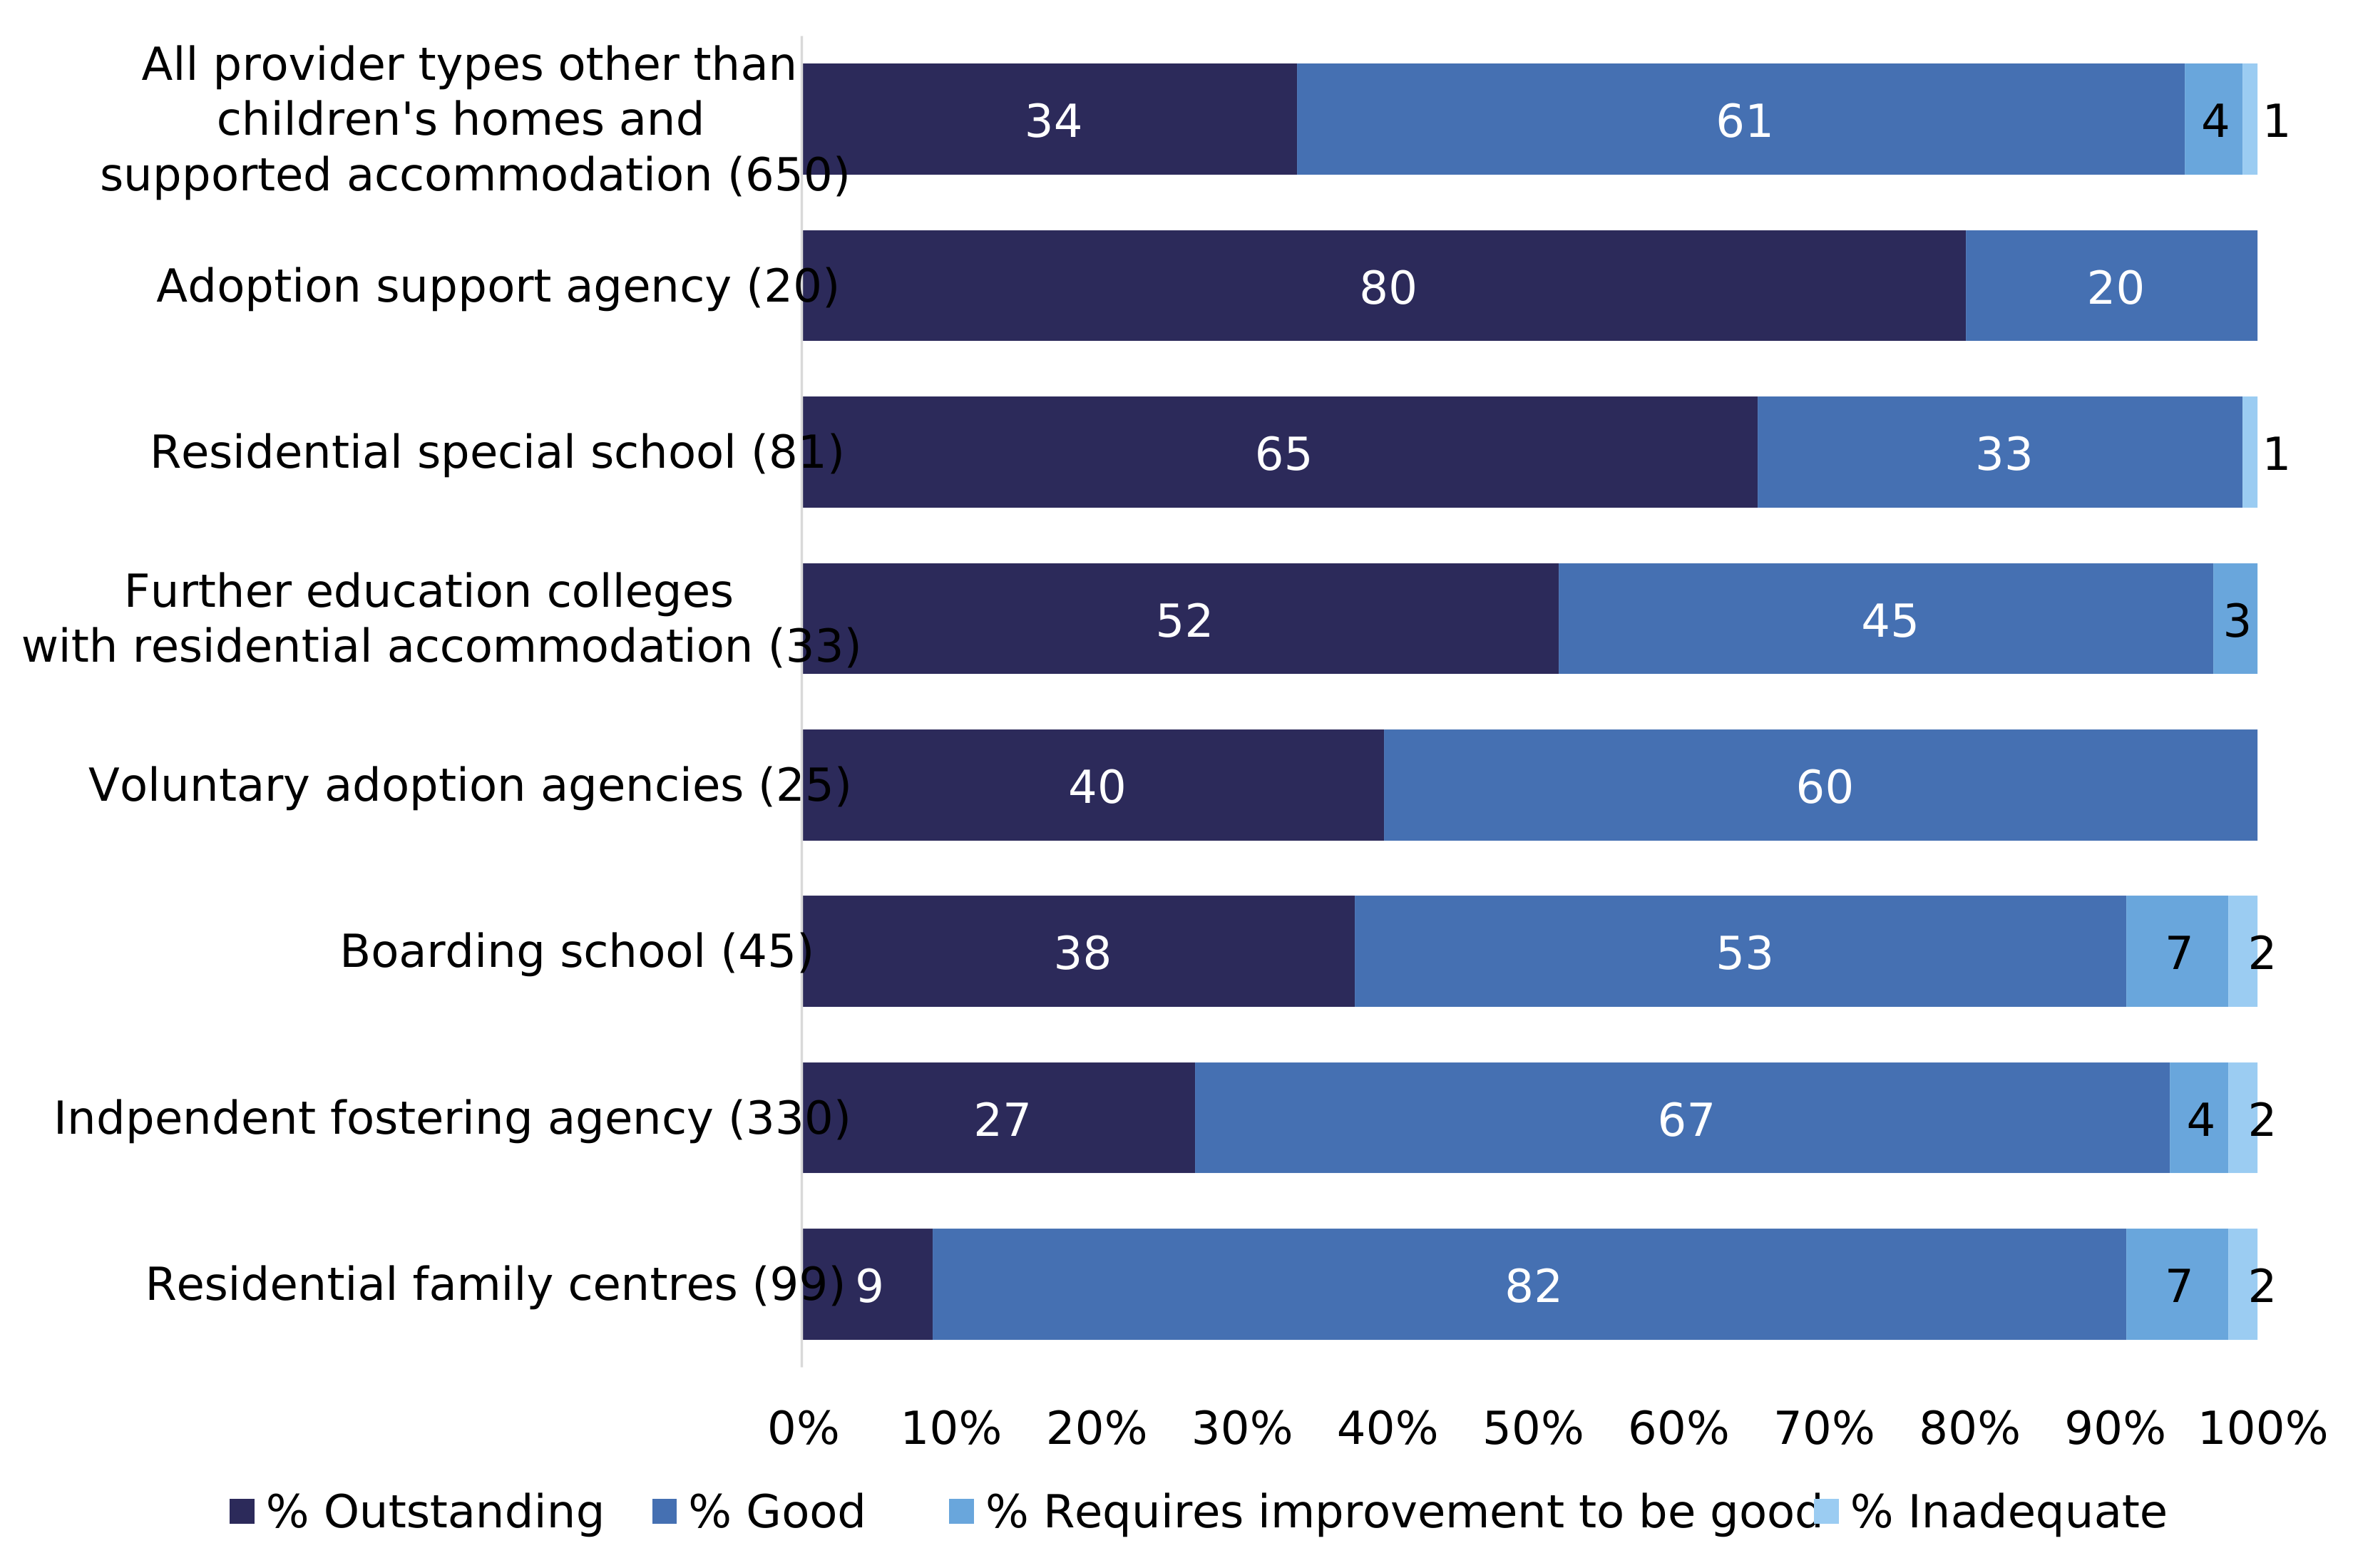
Of the 650 other social care provider settings that had a published full inspection outcome as at 31 March 2026, 95% had received a good or outstanding judgement.
Of the 680 other social care provider settings that were active or suspended as at 31 March 2026, the majority (650, 95%) had a published full inspection outcome. Of these, 95% were good (390) or outstanding (220), 4% were judged ‘requires improvement to be good’ (26) and 1% were inadequate (9).
Figure 7: Overall effectiveness profile of other social care providers as at 31 March 2026, by provider type
1. See Notes for rounding guidelines.
2. Totals in brackets represent the number of providers of each type with an inspection outcome as at 31 March 2026, published by 30 April 2026.
3. There were also 8 residential holiday schemes for disabled children and 1 secure training centre that had an inspection outcome as at 31 March 2026. We have not reported on these provider types individually in Figure 7, because the low numbers mean that percentage-based comparisons with other setting types are not meaningful. These providers are included in the top row, which shows grades for all provider types other than children’s homes and supported accommodation.
4. Percentages are rounded and may not sum to 100.
View data in an accessible format.
During 2025–26, we carried out a total of 300 full inspections and 41 monitoring inspections of 320 other social care providers. The majority (90%) of full inspections of other providers this year resulted in an overall judgement of good or outstanding.
Notes
We explain the main uses of this data and the arrangements for quality assurance, and provide further contextual information, in the methodology and quality report accompanying this release.
The methodology and quality report also provides information on the strengths and limitations of the statistics.
This publication is based on Ofsted data as at 31 March 2026.
Revisions to previous release
This is the first release of this data for the period 1 April 2025 to 31 March 2026.
Data source
The data for providers between 1 April 2025 and 31 March 2026 was extracted from Ofsted’s administrative systems on 31 March 2026. For inspections, it was extracted on 30 April 2026. Some information relating to this period is received and processed after this date and, as such, is not reflected in this publication. Our reporting is accurate to the administrative systems that we report from. We make every effort to ensure that the data is produced without any errors.
Rounding
Numbers in this report are rounded as follows:
- numbers under 100 are not rounded
- numbers between 100 and 1,000 are rounded to 2 significant figures
- numbers over 1,000 are rounded to 3 significant figures
Contacts
If you are a member of the public and have any comments or feedback on this publication, you can contact Rebecca Vincent by email.
Glossary
Definitions of terms are in the statistical glossary.
Annex: data tables for figures
This section contains the underlying data in an accessible table format for all figures.
Data for Figure 1: The number of settings as at 31 March 2026 by provider type, and the change from 31 March 2025
| Type of provider | Number of settings as at 31 March 2026 | Percentage change since 31 March 2025 |
|---|---|---|
| Children’s homes of all types | 4,800 | +20% |
| Residential family centres | 120 | +6% |
| Independent fostering agencies | 340 | +1% |
| Supported accommodation | 1,220 | +37% |
| Further education colleges with residential accommodation | 33 | -3% |
| Secure training centre | 1 | No change |
| Voluntary adoption agencies | 27 | -7% |
| Residential special schools | 85 | -11% |
| Boarding schools | 45 | -12% |
| Residential holiday schemes for disabled children | 9 | -10% |
See Figure 1.
Data for Figure 2: The number of children’s social care providers by type as at 31 March for the years 2022 to 2026
| Year | Total children’s homes of all types | Total providers other than children’s homes of all types and supported accommodation | Total supported accommodation providers |
|---|---|---|---|
| 2022 | 2,870 | 700 | 0 |
| 2023 | 3,120 | 690 | 0 |
| 2024 | 3,490 | 700 | 260 |
| 2025 | 4,010 | 700 | 890 |
| 2026 | 4,800 | 680 | 1,220 |
See Figure 2.
Data for Figure 3: Percentage change in the number of children’s homes of all types and their potential capacity since 2022
| Year | Percentage change in the number of homes | Percentage change in the number of places |
|---|---|---|
| 2022 | 0% | 0% |
| 2023 | 9% | 5% |
| 2024 | 22% | 12% |
| 2025 | 40% | 22% |
| 2026 | 67% | 36% |
See Figure 3.
Data for Figure 4: Overall effectiveness judgements for all full inspections of children’s homes of all types carried out between 1 April 2025 and 31 March 2026 by subtype
| Provision type | % Outstanding | % Good | % Requires improvement to be good | % Inadequate |
|---|---|---|---|---|
| Children’s homes of all types (4,430) | 11 | 71 | 13 | 5 |
| Children’s homes (4,380) | 11 | 71 | 13 | 5 |
| Residential special school (registered as children’s homes) (41) | 15 | 68 | 12 | 5 |
| Secure children’s homes (16) | 13 | 38 | 38 | 13 |
See Figure 4.
Data for Figure 5: Regional distribution of supported accommodation providers, premises and places as at 31 March 2026
| Region | % Providers | % Premises | % Places |
|---|---|---|---|
| East Midlands | 11 | 13 | 11 |
| East of England | 11 | 8 | 9 |
| London | 21 | 10 | 18 |
| North East, Yorkshire and the Humber | 11 | 17 | 13 |
| North West | 13 | 23 | 16 |
| South East | 13 | 12 | 15 |
| South West | 8 | 8 | 8 |
| West Midlands | 12 | 10 | 10 |
See Figure 5.
Data for Figure 6: Overall judgment outcome of supported accommodation providers as at 31 March 2026
| Overall judgment outcome | % Providers |
|---|---|
| Outcome 1: consistently strong service delivery | 45 |
| Outcome 2: inconsistent quality of service delivery | 48 |
| Outcome 3: serious or widespread weaknesses | 7 |
See Figure 6.
Data for Figure 7: Overall effectiveness profile of other social care providers as at 31 March 2026, by provider type
| Provider type | % Outstanding | % Good | % Requires improvement to be good | % Inadequate |
|---|---|---|---|---|
| All provider types other than children’s homes and supported accommodation (650) | 34 | 61 | 4 | 1 |
| Adoption support agencies (20) | 80 | 20 | 0 | 0 |
| Residential special schools (81) | 65 | 33 | 0 | 1 |
| Further education colleges with residential accommodation (33) | 52 | 45 | 3 | 0 |
| Voluntary adoption agencies (25) | 40 | 60 | 0 | 0 |
| Boarding schools (45) | 38 | 53 | 7 | 2 |
| Independent fostering agencies (330) | 27 | 67 | 4 | 2 |
| Residential family centres (99) | 9 | 82 | 7 | 2 |
See Figure 7.
-
A key characteristic of single occupancy accommodation is that the child is not routinely reliant on communal areas, such as a kitchen and lounge area, that may be used by others, including support staff. ↩