Children in low income families: local area statistics, financial year ending 2022
Updated 23 March 2023

© Crown copyright 2023
This publication is licensed under the terms of the Open Government Licence v3.0 except where otherwise stated. To view this licence, visit nationalarchives.gov.uk/doc/open-government-licence/version/3 or write to the Information Policy Team, The National Archives, Kew, London TW9 4DU, or email: psi@nationalarchives.gov.uk.
Where we have identified any third party copyright information you will need to obtain permission from the copyright holders concerned.
This publication is available at https://www.gov.uk/government/statistics/children-in-low-income-families-local-area-statistics-2014-to-2022/children-in-low-income-families-local-area-statistics-financial-year-ending-2022
The latest release of these statistics can be found in the Children in low income families: local area statistics collection.
This bulletin contains Official Statistics on the number and proportion of children living in low income families, Before Housing Costs (BHC), across the United Kingdom by local area for the financial year ending (FYE) 2022. This is an annual release and the next release will be in Spring 2024.
Feedback and queries about the statistics are welcome and can be sent to stats.consultation-2018@dwp.gov.uk.
Impact of the coronavirus (COVID-19) pandemic on statistics for financial year ending (FYE) 2022
The statistics are calibrated to the regional Households Below Average Income (HBAI) statistics. A full assessment of the impact of the coronavirus (COVID-19) pandemic on these statistics is available in the technical reports which should be considered alongside interpretation of these statistics.
While the data for FYE 2022 has undergone extensive quality assurance prior to publication, we recommend that users exercise additional caution when using the data for FYE 2021 and 2022, particularly when making comparisons with previous years and when comparing local areas across countries.
1. Main stories
The headline statistics for this release are:
- in financial year ending (FYE) 2022, there were 2.47 million children (aged 0 to 15) in families in Relative low income and 1.89 million children (aged 0 to 15) in Absolute low income families across the United Kingdom
- in the United Kingdom, the proportion of children aged under 16 in low income families was 20% for Relative and 15% for Absolute
- at a local level, the proportion of children of children aged under 16 living in low income families varies greatly, ranging from 5% to 42% across local authorities for Relative low income and from 4% to 39% for Absolute low income
- within England, Leicester had the highest proportion of children aged under 16 in Relative low income families (42%) and City of London had the highest proportion in Absolute low income families (39%)
- Richmond upon Thames had the lowest proportion of children aged under 16 in low income families, with a rate of 5% for Relative and 4% for Absolute measures
2. What you need to know
Whilst the full range of statistics continue to be available on Stat-Xplore, this year’s bulletin is limited because of the need to exercise additional caution when interpreting the statistics for financial years ending (FYE) 2021 and (FYE) 2022.
What you can use these statistics for
- the statistics in this bulletin relate to the number and proportion of children living in low income families by local area across the United Kingdom
- within year variations across local areas provide reliable estimates on the number and proportion of children living in low income families
- built from individual level administrative data on family composition and income, the statistics provide local insights on where children in low income families live (across ward and local authority for example), and how the proportions of children in low income families vary locally
- statistics provide additional information on age and gender of the child, and on the work status and composition of the family
What you cannot use these statistics for
- the statistics relate to the number and proportion of children living in low income families by local area across the United Kingdom; these statistics are a measure of children and cannot be used to obtain the number of low income families
- the statistics are calibrated to the regional Households Below Average Income (HBAI) statistics; a full assessment of the impact of the COVID-19 pandemic on these statistics is available in the technical reports which should be considered alongside interpretation of these statistics
- we recommend that users exercise additional caution when using the data for FYE 2021 and FYE 2022, particularly when making comparisons with previous years and when comparing local areas across countries
Read the background information note for further information, including detail on uses and limitations of the series.
DWP has a statutory obligation to publish measures of Absolute and Relative low income, and low income and material deprivation for children under section 4 of the Welfare Reform and Work Act 2016 and this is provided through the annual HBAI and Income Dynamics publications. HBAI provides estimates of children in low income at a national level, however there is significant demand for local area estimates (local authority, Westminster Parliamentary constituency, ward for example) met through this release.
Measures of the statistics
Statistics are calibrated to the HBAI regional and work status aggregates, thus the national and region totals in these statistics align to equivalent statistics in the published HBAI statistics. In previous years, the statistics are calibrated to the 3-year average, however due to the impact of the coronavirus (COVID-19) pandemic on FYE 2021 data, FYE 2022 figure is formed using the HBAI average of the FYE 2020 and FYE 2022 (excluding FYE 2021).
A family must have claimed Child Benefit and at least one other household benefit (Universal Credit, tax credits or Housing Benefit) at any point in the year to be classed as low income in these statistics. Relative low income measures families in low income in the reference year, whereas Absolute low income measures families in low income based on what low income looked like in FYE 2011. Income is Before Housing Costs (BHC) and is equivalised to adjust for family size and composition. See definitions for more information about the terminology used throughout this release.
The statistics relate to activity throughout the financial year. The count of children refers to the age of the child at 31 March of each year.
Figures in this bulletin are rounded in accordance with the rounding policy. Perturbed figures from the underlying data are available on Stat-Xplore.
Calculation of rates
Proportions (also referred to as rates) are calculated by dividing the unrounded number of children aged under 16 in a geographical area (for example, a local authority), by the population aged under 16 in that geographical area. Populations have been taken from mid-year population estimates which are an estimate of the usual resident population as at 30 June of the reference year (or latest available at the time of release).
Figures on the proportion of children are presented for children aged under 16 due to difficulty in identifying child dependents aged 16 to 19 in the mid-year population estimates. Statistics on the proportion of children in low income families at local authority, Westminster Parliamentary constituency, and ward level can be found in supporting data tables.
Stat-Xplore
More detailed breakdowns on the number of children in Relative and Absolute low income families, including those aged 16 to 19, can be found via DWP’s online tabulation tool Stat-Xplore. The statistics released on Stat-Xplore can be broken down by age and gender of child, family type, work status, and a range of geographies (including Westminster Parliamentary constituency, ward and lower super output area). Stat-Xplore allows users to analyse the number (and proportion) of children in low income families within and across small areas since FYE 2015.
The background information and methodology gives more information on the construction of these statistics and their interpretation in light of the impact of the coronavirus (COVID-19) pandemic on the HBAI statistics.
3. Proportion of children living in low income families
Figures in this section are presented for children aged under 16, unless stated otherwise. Numbers for all children in low income families, including those aged 16 to 19, can be found on Stat-Xplore.
In financial year ending (FYE) 2022, there were 2.47 million children (aged 0 to 15) in families in Relative low income and 1.89 million children (aged 0 to 15) in Absolute low income families across the United Kingdom.
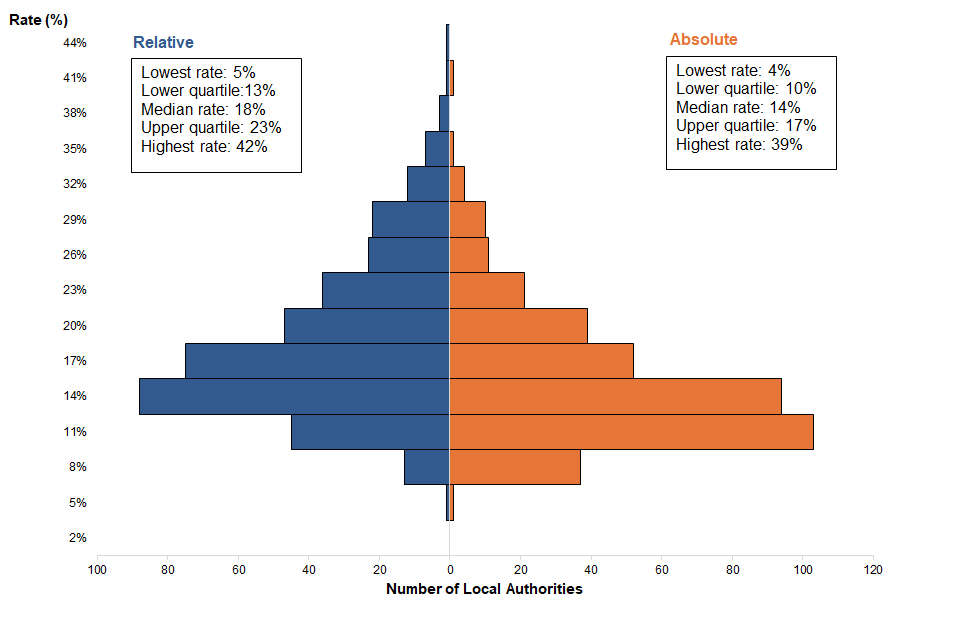
At a local level, the proportion of children aged under 16 living in low income families varies greatly, ranging from 5% to 42% across local authorities for Relative low income families and from 4% to 39% for Absolute low income families in FYE 2022. The majority of local authorities had a rate of children aged under 16 in low income families that falls between 10% and 20%..
Proportion of children aged under 16 in Relative and Absolute low income families by number of local authorities, United Kingdom, financial year ending 2022
Over half of local authorities had a proportion of children in low income families between 10% and 20%.
Source: DWP Stat-Xplore, Children in Low Income Families, local authority by age and ONS Nomis, Population Estimates, local authority by age
The United Kingdom as a whole, had an overall rate of 20% for children aged under 16 in Relative low income families in FYE 2022. Of the 374 local authorities across the United Kingdom, 53% had a rate between 10% and 20%. Only 6% of local authorities had a rate over 30%.
The rate of children aged under 16 in Absolute low income families in the United Kingdom was 15% in FYE 2022. 63% of local authorities had a rate of children aged under 16 in Absolute low income families between 10% and 20%. Only 1% of local authorities had a rate over 30%.
4. England
Comparisons across countries or years is not advised for FYE 2022 or FYE 2021. Consequently, statistics below show local area variations within each country for FYE 2022 only. See what you need to know for more information.
The local authorities with the highest proportions of children aged under 16 in Relative and Absolute low income families, England, financial year ending 2022
Local authorities with the highest proportions are primarily spread across Northern England and the Midlands.
| Local Authority | Relative - proportion of children (%) | Absolute - proportion of children (%) |
|---|---|---|
| Leicester | 41.7 | 35.3 |
| Nottingham | 40.9 | 33.9 |
| City of London | 40.8 | 38.9 |
| Birmingham | 38.6 | 31.5 |
| Pendle | 38.5 | 28.7 |
| Oldham | 38.5 | 28.9 |
| Middlesbrough | 37.4 | 31.8 |
| Blackburn with Darwen | 36.5 | 25.8 |
| Stoke-on-Trent | 36.1 | 29.0 |
| Bradford | 35.6 | 28.9 |
Source: DWP Stat-Xplore, Children in Low Income Families, local authority by age and ONS Nomis, Population Estimates, local authority by age
In financial year ending (FYE) 2022, there were 2.09 million children aged under 16 in low income families in England in Relative low income and 1.60 million in Absolute.
Leicester was the local authority in England with the highest proportion of children aged under 16 in low income families in Relative low income (42%) and City of London had the highest proportion in Absolute low income (39%).
The local authorities with the lowest proportions of children aged under 16 in Relative and Absolute low income families, England, financial year ending 2022
Local authorities with the lowest proportions are spread across London, the South East and East of England.
| Local Authority | Relative - proportion of children (%) | Absolute - proportion of children (%) |
|---|---|---|
| Richmond upon Thames | 5.4 | 4.2 |
| Elmbridge | 6.7 | 4.8 |
| St Albans | 7.1 | 5.4 |
| East Hertfordshire | 7.2 | 5.3 |
| Hart | 7.4 | 5.3 |
| Wokingham | 7.6 | 5.5 |
| South Cambridgeshire | 7.7 | 5.5 |
| Harrogate | 7.8 | 6.0 |
| Waverley | 7.8 | 5.8 |
| Epsom and Ewell | 7.8 | 5.7 |
Source: DWP Stat-Xplore, Children in Low Income Families, local authority by age and ONS Nomis, Population Estimates, local authority by age
In FYE 2022, Richmond upon Thames had the lowest proportion of children aged under 16 in low income families across England, with a rate of 5% for Relative low income and 4% for Absolute.
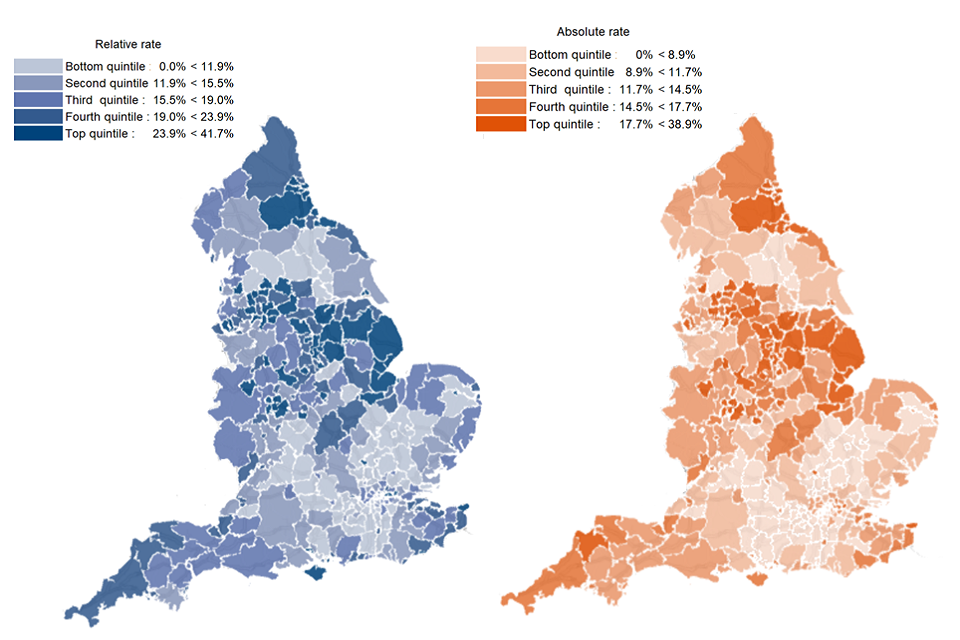
Proportion of children aged under 16 in Relative and Absolute low income families by local authority (quintiles), England, financial year ending 2022
There are clusters of local authorities across the South and East of England with lower proportions of children in low income families.
Source: DWP Stat-Xplore, Children in Low Income Families, local authority by age and ONS Nomis, Population Estimates, local authority by age
The proportion of children in low income families across local authorities is classified using quintiles where the top quintile is shown in the darkest shade, and the bottom quintile in the lightest. Group ranges are calculated to split local authorities evenly into 5 bands, so approximately 20% of local authorities fit into each group.
The top quintile (darkest shade) contains the group of local authorities which have the highest rates of children aged under 16 in low income families. Local authorities within the East Midlands, North East and North West regions are within the top quintile.
In contrast, the bottom quintile (lightest shade) contains the group of local authorities which have the lowest rates of children in low income families. There are clusters of local authorities across the South and Esat of England which fall within the bottom quintile
5. Wales
Comparisons across countries or years is not advised for FYE 2022 or FYE 2021. Consequently, statistics below show local area variations within each country for FYE 2022 only. See what you need to know for more information.
The local authorities with the highest proportions of children aged under 16 in Relative and Absolute low income families, Wales, financial year ending 2022
Within Wales, Blaenau Gwent had the highest proportion of children in Relative low income families.
| Local Authority | Relative - proportion of children (%) | Absolute - proportion of children (%) |
|---|---|---|
| Blaenau Gwent | 27.4 | 16.8 |
| Ceredigion | 25.9 | 18.8 |
| Merthyr Tydfil | 25.1 | 16.2 |
| Pembrokeshire | 24.7 | 17.2 |
| Isle of Anglesey | 24.4 | 16.6 |
Source: DWP Stat-Xplore, Children in Low Income Families, local authority by age and ONS Nomis, Population Estimates, local authority by age
In financial year ending (FYE) 2022, there were 121,000 (22%) children aged under 16 in low income families in Wales in Relative low income and 81,000 (15%) in Absolute.
Blaenau Gwent was the local authority in Wales with the highest proportion of children aged under 16 in low income families for Relative low income at 27% and Ceredigion has the highest Absolute measures at 19%.
Monmouthshire was the local authority in Wales with the lowest proportion of children aged under 16 in Relative low income families at 16% and Vale of Glamorgan for Absolute low income measure at 11%.
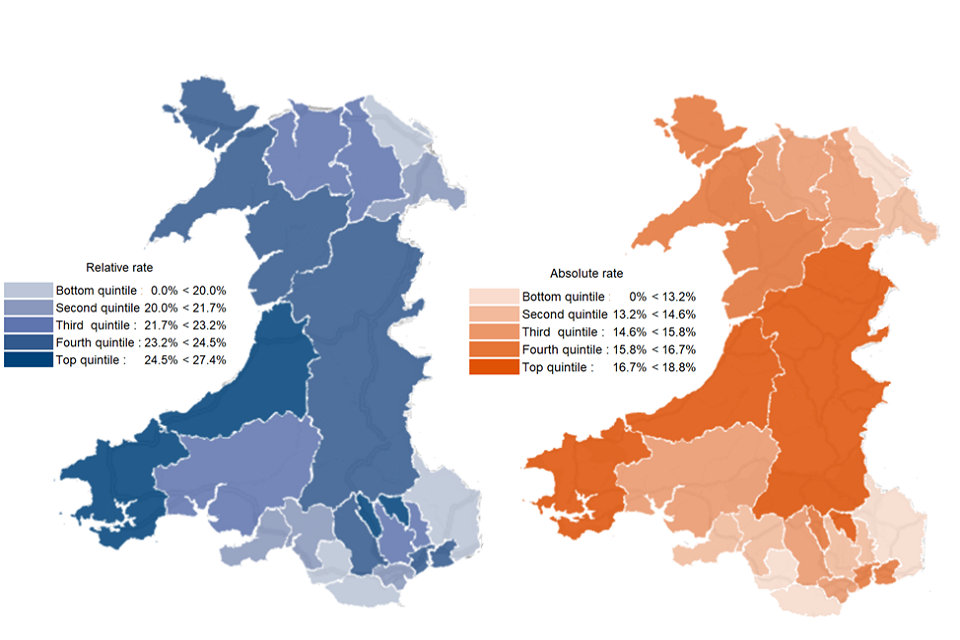
Proportion of children aged under 16 in Relative and Absolute low income families by local authority (quintiles), Wales, financial year ending 2022
Cardiff falls within the second quintile of children in Relative low income families across Wales.
Source: DWP Stat-Xplore, Children in Low Income Families, local authority by age and ONS Nomis, Population Estimates, local authority by age
The proportion of children in low income families across local authorities is classified using quintiles where the top quintile is shown in the darkest shade, and the bottom quintile in the lightest. Group ranges are calculated to split local authorities evenly into 5 bands, so approximately 20% of local authorities fit into each group.
Across Wales, the proportion of children aged under 16 in low income families varies from 16% to 27% for Relative low income families and from 11% to 19% for Absolute in FYE 2022.
6. Scotland
Comparisons across countries or years is not advised for FYE 2022 or FYE 2021. Consequently, statistics below show local area variations within each country for FYE 2022 only. See what you need to know for more information.
The local authorities with the highest proportions of children aged under 16 in Relative and Absolute low income families, Scotland, financial year ending 2022
Within Scotland, Glasgow City had the highest proportion of children in low income families.
| Local Authority | Relative - proportion of children (%) | Absolute - proportion of children (%) |
|---|---|---|
| Glasgow City | 31.8 | 25.7 |
| North Ayrshire | 28.6 | 22.4 |
| Clackmannanshire | 25.9 | 20.4 |
| East Ayrshire | 25.5 | 20.1 |
| West Dunbartonshire | 25.5 | 19.7 |
Source: DWP Stat-Xplore, Children in Low Income Families, local authority by age and ONS Nomis, Population Estimates, local authority by age
In financial year ending (FYE) 2022, there were 189,000 children aged under 16 in low income families in Scotland in Relative low income and 150,000 in Absolute.
Glasgow City was the local authority in Scotland with the highest proportion of children aged under 16 in low income families for both Relative and Absolute measures at 32% and 26% respectively.
East Renfrewshire was the local authority in Scotland with the lowest proportion of children aged under 16 Relative low income families at 11% and East Dunbartonshire for Absolute low income at 9%.
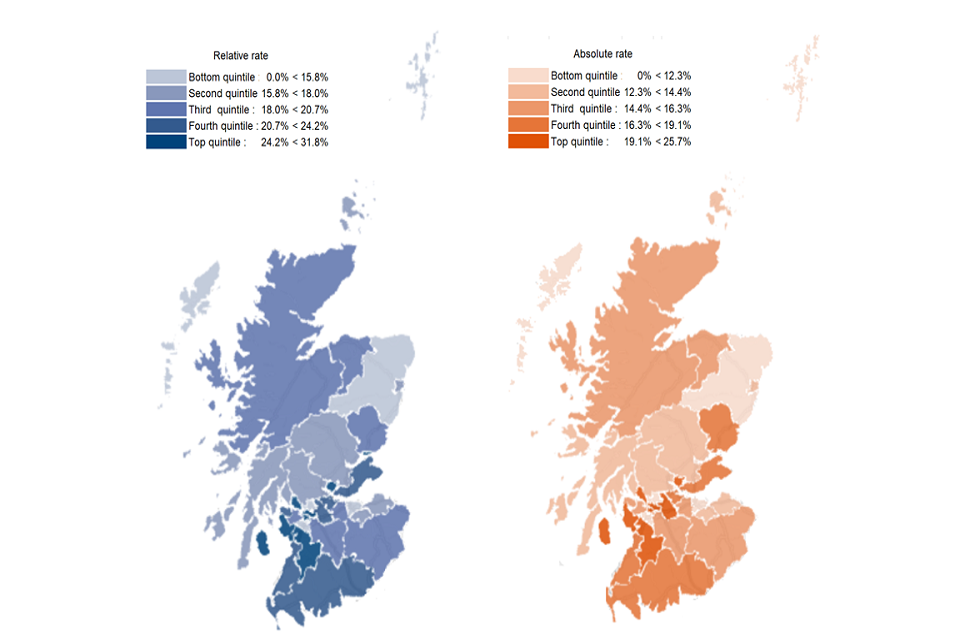
Proportion of children aged under 16 in Relative and Absolute low income families by local authority (quintiles), Scotland, financial year ending 2022
East and North Ayrshire fall within the top quintile of children in low income families across Scotland.
Source: DWP Stat-Xplore, Children in Low Income Families, local authority by age and ONS Nomis, Population Estimates, local authority by age
The proportion of children in low income families across local authorities is classified using quintiles where the top quintile is shown in the darkest shade, and the bottom quintile in the lightest. Group ranges are calculated to split local authorities evenly into 5 bands, so approximately 20% of local authorities fit into each group.
Across Scotland, the proportion of children aged under 16 in low income families varies from 11% to 32% for Relative low income families and from 9% to 26% for Absolute in FYE 2022.
7. Northern Ireland
Comparisons across countries or years is not advised for FYE 2022 or FYE 2021. Consequently, statistics below show local area variations within each country for FYE 2022 only. See what you need to know for more information.
The local authorities with the highest proportions of children aged under 16 in Relative and Absolute low income families, Northern Ireland, financial year ending 2022
Newry, Mourne and Down had the highest proportion of children in low income families within Northern Ireland.
| Local Authority | Relative - proportion of children (%) | Absolute - proportion of children (%) |
|---|---|---|
| Newry, Mourne and Down | 22.0 | 17.6 |
| Belfast | 21.6 | 16.1 |
| Derry City and Strabane | 21.2 | 16.2 |
| Causeway Coast and Glens | 20.1 | 15.7 |
| Fermanagh and Omagh | 19.8 | 15.7 |
Source: DWP Stat-Xplore, Children in Low Income Families, local authority by age and ONS Nomis, Population Estimates, local authority by age
In financial year ending (FYE) 2022, there were 73,000 children aged under 16 in low income families in Northern Ireland in Relative low income and 57,000 in Absolute.
Newry, Mourne and Down was the local authority in Northern Ireland with the highest proportion of children aged under 16 in low income families for both Relative and Absolute measures at 22% and 18% respectively.
Lisburn and Castlereagh was the local authority in Northern Ireland with the lowest proportion of children aged under 16 in low income families for both Relative and Absolute measures at 12% and 9% respectively.
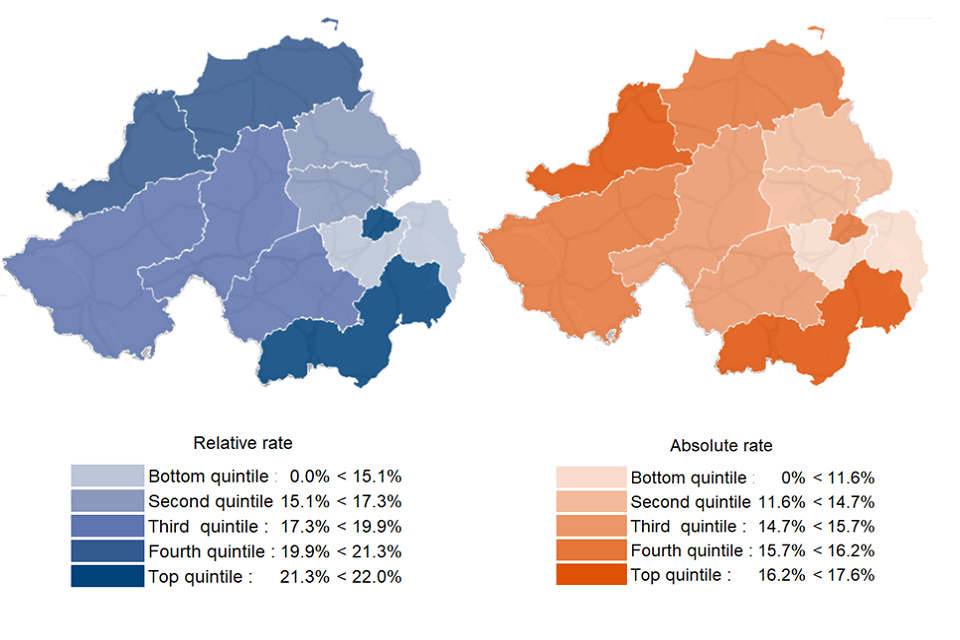
Proportion of children aged under 16 in Relative and Absolute low income families by local authority (quintiles), Northern Ireland, financial year ending 2022
Belfast falls within the highest quintile of children in Relative low income families across Northern Ireland.
Source: DWP Stat-Xplore, Children in Low Income Families, local authority by age and ONS Nomis, Population Estimates, local authority by age
The proportion of children in low income families across local authorities is classified using quintiles where the top quintile is shown in the darkest shade, and the bottom quintile in the lightest. Group ranges are calculated to split local authorities evenly into 5 bands, so approximately 20% of local authorities fit into each group.
Across Northern Ireland, the proportion of children aged under 16 in low income families varies from 12% to 22% for Relative low income families and from 9% to 18% for Absolute in FYE 2022.
Figures on rates for children under 16 by local authority, Westminster Parliamentary constituency, and ward can be found as a timeseries going back to FYE 2015 via supporting data tables.
More detailed statistics are available on Stat-Xplore which allows users to produce bespoke tabulations showing local area analyses by a range of breakdowns over time.
8. About these statistics
Figures for the latest financial year are provisional and subject to revision in subsequent releases. The statistics in this release are not directly comparable to the former DWP (children in out-of-work benefit households) or HMRC (children in low income families local measure) releases. Whilst they complement the statistics released in the Households Below Average Income (HBAI) publication, please note that they are produced from an entirely different data source with some differences in methodology, for example HBAI considers household incomes whereas these statistics cover family incomes (multiple families may live in the same household).
Definitions
| Term | Definition |
|---|---|
| Children | Dependent individuals aged under 16; or aged 16 to 19 in full-time non-advanced education or in unwaged government training. Child age is derived as the duration from date of birth to 31 March in each year. |
| Family | A single adult; or a married or cohabitating couple; or a Civil Partnership; and any dependent children. |
| Equivalised income | Income is gross income Before Housing Costs (BHC) and includes contributions from earnings, state support and pensions. Equivalisation adjusts incomes for family size and composition; taking an adult couple with no children as the reference point. |
| Relative low income | A family in low income Before Housing Costs (BHC) in the reference year. A family must have claimed Child Benefit and at least one other household benefit (Universal Credit, tax credits or Housing Benefit) at any point in the year to be classed as low income in these statistics. |
| Absolute low income | A family in low income Before Housing Costs (BHC) in the reference year in comparison with incomes in financial year ending (FYE) 2011. A family must have claimed Child Benefit and at least one other household benefit (Universal Credit, tax credits or Housing Benefit) at any point in the year to be classed as low income in these statistics. |
| Work status | A family is defined as ‘in-work’ if they have an accumulated period of at least 26 weeks paid employment or self-employment within the 52-week tax year. Employment activity is accumulated from either (or both) the adult claimant of Child Benefit and any partner(s) in the tax year. |
| Family type | Family type accounts for changes in family composition throughout the year (for example, re-partnering, multiple partners). A lone parent family type means the parent/guardian has had no partnerships at any point in the year. |
Rounding policy
Numbers over 1 million are rounded to the nearest 10,000. Numbers less than 1 million are rounded to the nearest 1,000. Percentages are rounded to the nearest whole number, with the exception of the tables and maps which are shown to 1 decimal place. Unrounded figures, with statistical disclosure control applied, can be obtained from Stat-Xplore. Perturbed figures from the underlying data available on Stat-Xplore or in accompanying tables may not sum exactly to the rounded totals accordingly.
Where to find out more
This statistical bulletin gives an overview of the important points and trends. More detailed breakdowns can be found via the supporting data tables or DWP’s online tabulation tool Stat-Xplore.
The statistics within this release have been primarily sourced from the DWP RAPID (Registration and Population Interaction Database) longitudinal data set which provides a single coherent view of citizen interactions with DWP and HMRC within the tax year. The background information and methodology provides a fuller explanation on the purpose, coverage, construction, sources and limitations of the statistics.
Contact information and feedback
DWP would like to hear your views on these statistics. We would be interested in hearing what you use them for and how well they meet your requirements. Feedback and queries about the statistics can be sent to stats.consultation-2018@dwp.gov.uk.
Press enquiries should be directed to the DWP Press Office: 0115 965 8781
Lead Statisticians: Steve Watkins and Russ Bentley
9. Related statistics
Estimates of numbers in low income in a single year from Households Below Average Income (HBAI). Other related DWP statistics include Family Resources Survey and Income Dynamics.
The following ONS publications provide useful information and guidance on alternative sources of data on earnings and income:
- Income and earnings statistics guide
- Income and earnings coherence workplan
- Income and earnings statistics interactive database
Indices of multiple deprivation by country are available:
- English Indices of Deprivation
- Welsh Index of Multiple Deprivation
- Scottish Index of Multiple Deprivation
Details of other National and Official Statistics produced by the Department for Work and Pensions can be found on the statistics at DWP page with a schedule of statistical releases over the next 12 months and a list of the most recent releases. This also includes the statistical work programme which outlines developments to DWP official statistics and any changes to statistical methodology. In accordance with the Code of Practice for Statistics, all DWP statistics are also announced on the research and statistics page.
ISBN: 978-1-78659-497-6