Index of cancer survival for Clinical Commissioning Groups in England: adults diagnosed 2002 to 2017 and followed up to 2018
Published 29 November 2019
Applies to England

© Crown copyright 2019
This publication is licensed under the terms of the Open Government Licence v3.0 except where otherwise stated. To view this licence, visit nationalarchives.gov.uk/doc/open-government-licence/version/3 or write to the Information Policy Team, The National Archives, Kew, London TW9 4DU, or email: psi@nationalarchives.gov.uk.
Where we have identified any third party copyright information you will need to obtain permission from the copyright holders concerned.
This publication is available at https://www.gov.uk/government/statistics/cancer-survival-index-for-clinical-commissioning-groups/index-of-cancer-survival-for-clinical-commissioning-groups-in-england-adults-diagnosed-2002-to-2017-and-followed-up-to-2018
1. Main points
The one-year index of cancer survival for England has increased from 62.6% in 2002 to 73.3% in 2017.
The difference in the index of cancer survival between the Clinical Commissioning Groups (CCGs) narrowed with the range in survival estimates reducing from 15.4 percentage points in 2002 to 10.2 percentage points in 2017, indicating less geographic inequality across CCGs.
Trends in the estimates for Cancer Alliances and Sustainability and Transformation Partnerships followed the same patterns as the CCGs.
2. Things you need to know about this release
This publication focuses on trends in the index of cancer survival for adults (aged 15 to 99 years), for each of the 191 CCGs, the 42 Sustainability and Transformation Partnerships (STPs), 20 Cancer Alliances (CAs) and for England as a whole.
All the survival results are available in our index of cancer survival data tables. There is also an interactive tool to accompany this publication in which you can view trends in the index of cancer survival for areas of your choice and download selected survival results or the complete data tables.
The index of cancer survival provides a convenient, single number that summarises the overall pattern of net cancer survival. It combines net survival estimates for breast cancer (women only), colorectal (bowel) cancer, lung cancer and all other invasive cancers (excluding non-melanoma skin cancer and prostate cancer).
Separate net survival estimates for breast (women only), colorectal (bowel) and lung cancers are also presented in this publication. These estimates are age-standardised (breast cancer) or age-sex-standardised (colorectal and lung cancers).
Net survival is the survival of cancer patients compared with the expected survival of the general population.
In this publication, net survival is estimated using regression models based on adults who were diagnosed with cancer between 2002 and 2017, followed up to 31 December 2018. These statistics can be used to observe the overall pattern of cancer survival over the 16-year period for each area. It may not be statistically appropriate to compare survival estimates across geographical areas.
The cancer survival in England publication provides national estimates of adult cancer survival for 29 cancer sites, including survival by stage at diagnosis where possible, and cancer survival for children. The geographic patterns of cancer survival in England publication provides estimates of cancer survival for 14 cancer sites for CAs and STPs. Information on the contents and uses of all the cancer publications can be found in the article cancer statistics explained: different data sources and when they should be used.
More information on methodology can be found in Section 5 (Interpretation of these statistics) of this bulletin or in the quality and methodology information report.
These cancer survival estimates are designated as National Statistics. National Statistics are a subset of official statistics, which have been certified by the UK Statistics Authority as compliant with its Code of Practice for Statistics.
3. Between 2002 and 2017, cancer survival increased and geographic inequality between CCGs narrowed
Figure 1 shows the CCG variation in the index of cancer survival across time. The chart shows that the index of cancer survival has increased throughout the period for all CCGs while the difference in survival between CCGs has decreased. Overall the England cancer survival has increased by 10.7 percentage points, from 62.6% to 73.3%, in the 16 years reported.
The range in one-year index of cancer survival estimates (the gap between the highest and lowest CCGs) has narrowed from 15.4 percentage points in 2002 to 10.2 percentage points in 2017, which means there is now less geographic inequality in cancer survival by CCG in England.
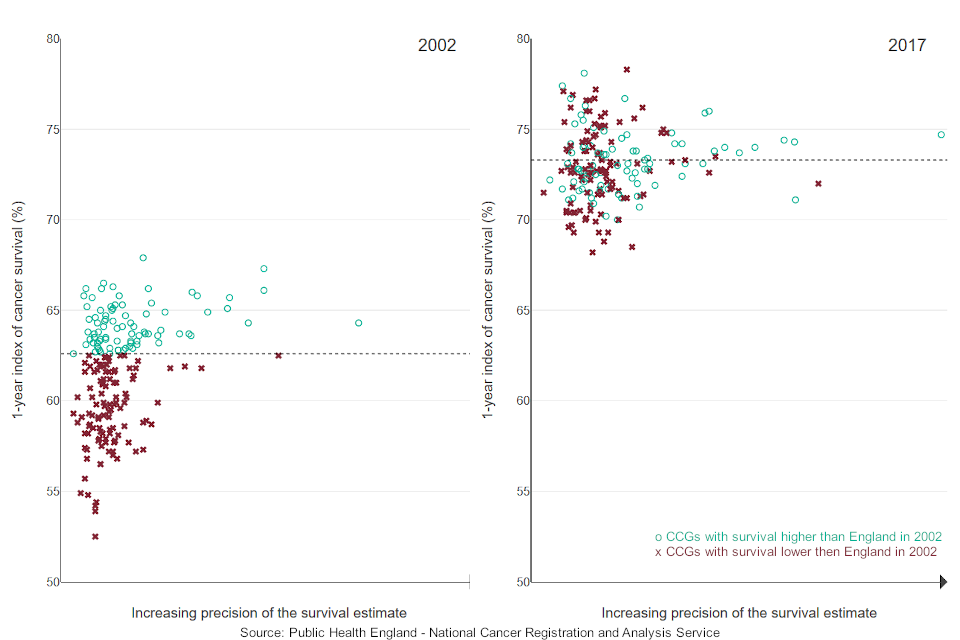
Figure 1: Index of cancer survival for Clinical Commissioning Groups in England, 2002 and 2017
Although the index of cancer survival has increased in England and for all CAs, STPs and CCGs, the rate of improvement has varied across individual CCGs. Table 1 shows the 5 most and 5 least improved CCGs, that is those with the largest or smallest percentage point increases in the index of cancer survival between 2002 and 2017.
Even though a CCG may be in the most or least improved categories, it does not follow that these CCGs have the highest or lowest survival in 2017. The index has been designed to compare levels of survival over time for individual CCGs; direct comparisons of survival between CCGs may not be completely reliable.
| Area name | 2002 index of cancer survival (%) | 2017 index of cancer survival (%) | Improvement |
|---|---|---|---|
| England | 62.6 | 73.3 | 10.7 |
| Most improved CCGs | |||
| NHS South Cheshire CCG | 54.4 | 75.3 | 20.9 |
| NHS Vale Royal CCG | 54.9 | 75.4 | 20.6 |
| NHS Waltham Forest CCG | 52.5 | 72.8 | 20.3 |
| NHS Southport and Formby CCG | 57.3 | 76.6 | 19.3 |
| NHS Hounslow CCG | 58.5 | 76.6 | 18.1 |
| Least improved CCGs | |||
| NHS Dudley CCG | 63.7 | 70.0 | 6.3 |
| NHS Wyre Forest CCG | 65.8 | 71.7 | 5.9 |
| NHS Lincolnshire West CCG | 65.3 | 70.9 | 5.6 |
| NHS Birmingham and Solihull CCG | 66.1 | 71.1 | 4.9 |
| NHS Vale of York CCG | 67.9 | 72.0 | 4.1 |
Table 1: Most and least improved CCGs for index of cancer survival in England, 2002 to 2017
Figures 2 and 3 show a map of the one-year index of cancer survival by CCG for 2002 and 2017 in England. In 2002, CCGs with the lowest index of cancer survival, particularly below 58%, were generally from north west England or London and south east England. By 2017, there was less geographical variation in the index of cancer survival, with the index above 70% for most CCGs.
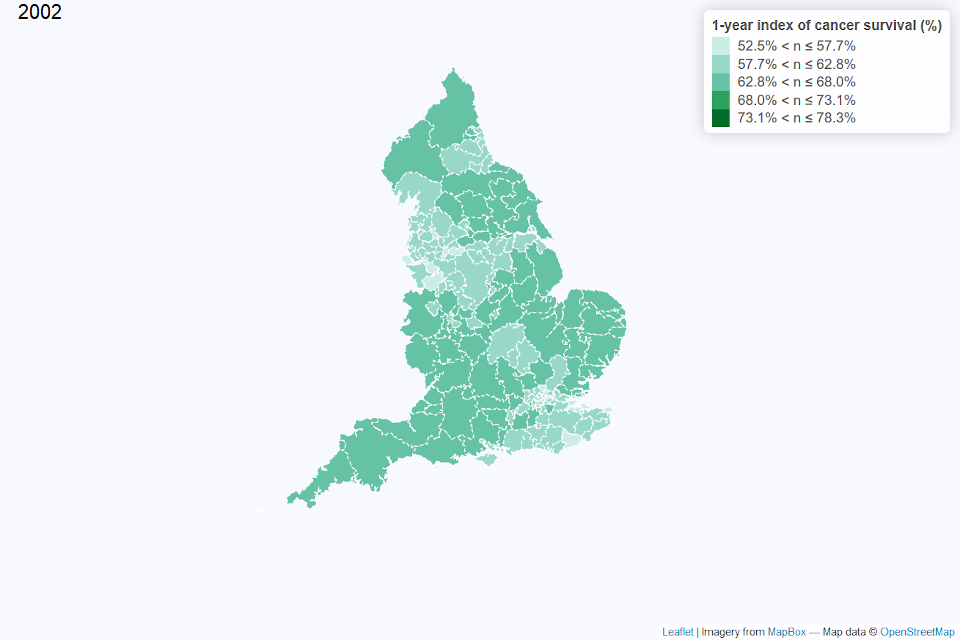
Figure 2: Map of the one-year index of cancer survival for Clinical Commissioning Groups (CCG) in England 2002
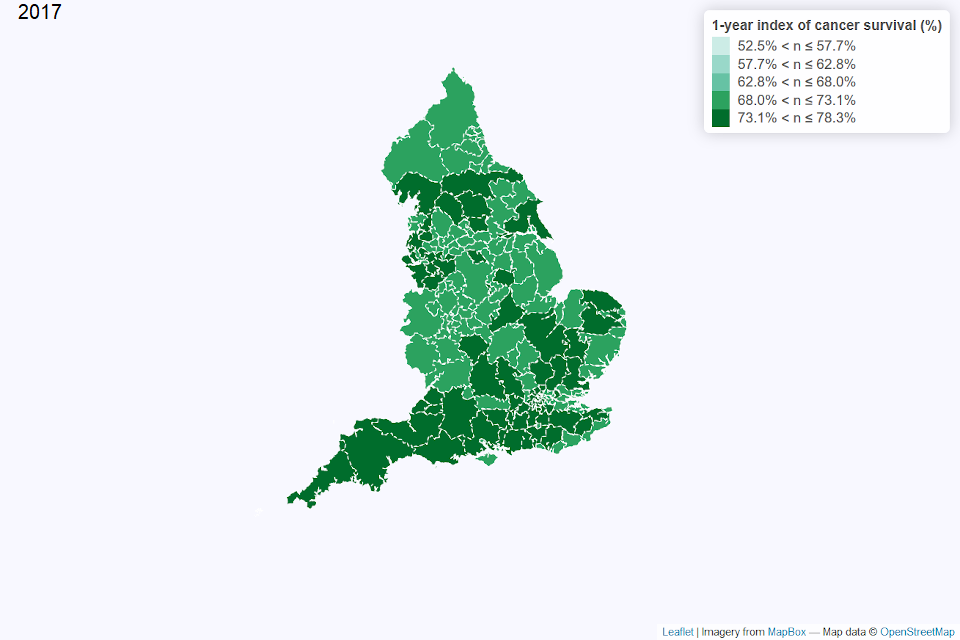
Figure 3: Map of the one-year index of cancer survival for Clinical Commissioning Groups (CCG) in England 2017
Since 2002, the one-year index of cancer survival increased for all CAs. Between 2002 and 2017, the range of the one-year index of cancer survival for CAs narrowed from 6.9 percentage points to 4.0 percentage points.
For CAs that fell below the median of the one-year index of cancer survival in 2002, there was a quicker rate of improvement and reduction in inequality. This was reflected in a shift over time in the relative position of the CA median estimate. In 2002, the median estimate (63.1%) was closer to the maximum (65.3%) than the minimum (58.4%). In 2017 the median (73.2%) was closer to the minimum (71.6%) than the maximum (75.6%).
For patients diagnosed in 2017, the one-year index of cancer survival for STPs ranged from 70.1% to 76.4%, compared with 56.7% to 67.3% in 2002.
To see how the index of cancer survival has changed over time for a selected area or for all CCGs within a selected CA or STP, please visit our interactive tool. Or, for further data, including 5- and 10-year net survival estimates for CAs and STPs please refer to our data tables.
4. Geographic inequalities for breast, colorectal and lung cancers: 2002 and 2017
Estimates of one-year age-standardised net survival for breast cancer (women) and age-sex-standardised net survival for colorectal and lung cancers are presented in this section.
Lung cancer net survival in England showed the most improvement from 2002 to 2017, with net survival estimates increasing by 16.4 percentage points. There was a 6.9 percentage point increase for colorectal cancer and a 3.4 percentage point increase for breast cancer net survival estimates in this time frame.
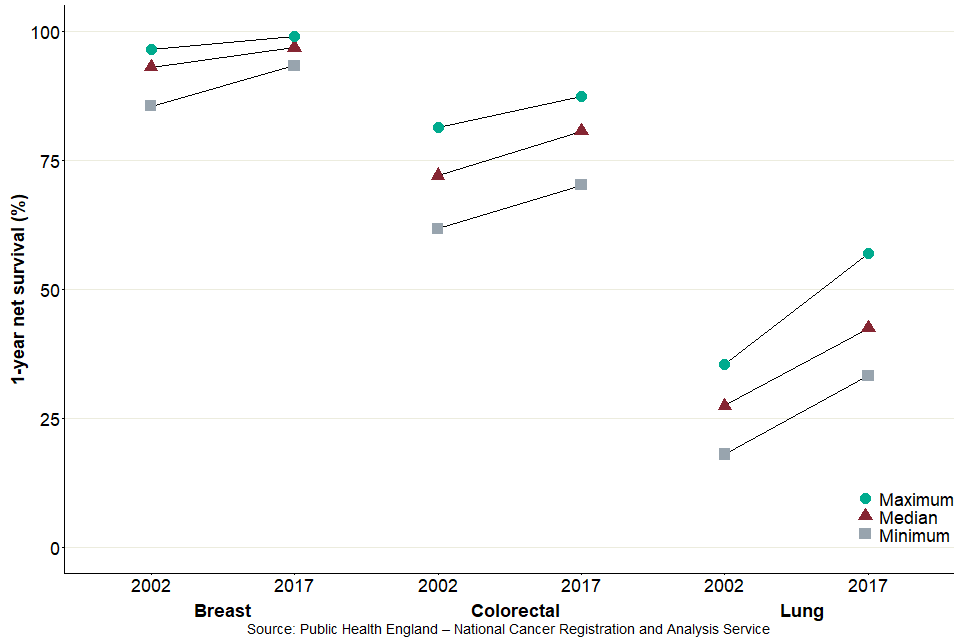
Figure 4: Range in 1-year net survival estimates (%) for breast, colorectal and lung cancers, for Clinical Commissioning Groups in England, 2002 and 2017
Figure 4 displays the median, minimum and maximum net survival estimates for CCGs in 2002 and 2017.
For 2017, there was less between-CCG variation in breast cancer net survival estimates than in colorectal or lung cancer net survival estimates. Compared with 2002, the CCG range in net survival estimates has decreased for breast cancer (from a range of 11.0 percentage points in 2002 to 5.7 percentage points in 2017) and colorectal cancer (from 19.7 percentage points in 2002 to 17.2 percentage points in 2017) but increased for lung cancer (from 17.5 percentage points in 2002 to 23.8 percentage points in 2017).
Differences in cancer survival between CCGs may be partially related to differences in the proportion of patients diagnosed at a relatively early stage. For breast cancer, most patients are diagnosed at early stages, which tend to have higher survival rates. In comparison, for lung cancer, the majority of patients are diagnosed at later stages, which tend to have lower survival rates (for more information please refer to our cancer survival in England bulletin).
To see how the cancer survival for breast, colorectal and lung cancer has changed over time for a selected area or for all CCGs within a selected CA or STP, please visit our interactive tool. Or, for further data, including 5- and 10-year net survival estimates for CAs and STPs please refer to our data tables.
5. Interpretation of these statistics
5.1 The index of cancer survival: what it is
The index of cancer survival provides a convenient, single number that summarises the overall pattern of cancer survival for each calendar year. It combines the net survival estimates for each sex, age group and:
- breast cancer diagnosed in women
- colorectal cancer
- lung cancer
- all other invasive cancers combined, excluding prostate and non-melanoma skin cancers
Research on population-based cancer survival trends in England and Wales found that for most cancers, survival is either stable or rising steadily from year to year. This trend is reflected in the index of cancer survival. The index is designed to reflect real progress in cancer outcomes by long-term monitoring of progress in overall cancer survival. It provides a summary measure of cancer survival that takes account of shifts in the pattern of cancers in a given geography.
The index of cancer survival can be compared over time, because it is adjusted for any changes in the profile of cancer patients by age, sex or type of cancer. This adjustment is necessary because survival varies widely by all 3 factors meaning that, without standardisation, changes in survival could result from changes in the profile of cancer patients, even if survival at each age, for each cancer and in each sex did not change.
More information on methodology can be found in the quality and methodology information report which also contains important information on:
- the strengths and limitations of the data and how it compares with related data
- uses and users of the data
- how the output was created
- the quality of the output including the accuracy of the data
5.2 Points to consider when interpreting these estimates
For geographic areas with small populations, like most CCGs, some fluctuation in survival estimates between consecutive years can be expected, as reported in cancer survival indicators for Clinical Commissioning Groups in England. Fluctuations in cancer survival by area can occur due to the small numbers of cancer diagnoses and deaths each year within the population.
Interpretation should primarily focus on trends, rather than the survival estimate for a particular year. Areas for which the index of cancer survival is consistently lower than average may warrant further investigation.
The aim of this publication is to present data that can support long-term improvements in cancer control. These estimates can indicate the potential for improvement in the management of cancer, from early detection through to referral, investigation, treatment and care. Survival estimates should not be used as the sole indicator of an area’s performance in cancer outcomes. To gain a more complete picture of the cancer burden in a particular area, these estimates should be used alongside other information available, such as cancer incidence and mortality data.
CCGs in England came into existence on 1 April 2013, replacing NHS Primary Care Trusts. STPs were established in December 2017 and CAs were established in late 2017 (September to December). A CCG, STP or CA is not responsible for trends in cancer survival that pre-date its existence. Data is provided for this 16-year period because the method used requires data over a long period in order to give robust estimates and so that each area has a baseline against which to assess progress over time. Survival is estimated using the most up-to-date boundaries at publication – in 2019, the number of CCGs fell from 195 to 191.
These survival estimates are based on patients’ resident within defined CCG boundaries at the point of diagnosis. However, the structure of CCGs means they are responsible for patients registered at primary care (GP) practices within their boundary. This may result in some differences between the patients included in these survival estimates and the patients for which the CCG is responsible. This potential limitation is discussed in the article: Dismantling the signposts to public health? NHS data under the Health and Social Care Act 2012.
The survival estimates must be interpreted with care. They do not reflect the survival prospects for any individual cancer patient; they represent the net survival for all cancer patients in a given area, in a given period of time, diagnosed with a specified type of cancer.
5.3 Data included in this analysis
The data used in these analyses was extracted from the cancer registration database held by the National Cancer Registration and Analysis Service (NCRAS) on 29 May 2019.
All adults (aged 15 to 99 years) who were diagnosed with a first, primary, invasive malignancy (ICD10 C00-C97) were eligible for inclusion. Patients diagnosed with malignancy of the skin (C44) other than melanoma were excluded. Cancer of the prostate (C61) was also excluded from the index, because the widespread introduction of prostate-specific antigen (PSA) testing since the early 1990s has led to difficulty in the interpretation of survival trends, as explained in excess cases of prostate cancer and estimated over diagnosis associated with PSA testing in East Anglia.
5.4 Data quality
An assessment of the data quality, including details of the number of eligible cases and exclusions, is provided in the index of cancer survival data tables.
It was sometimes impossible to produce robust estimates of survival for one or more of the age groups, most often because of the relatively small number of patients diagnosed in the age group 15 to 44 years. In this situation, the missing value for a CCG is replaced by the corresponding value for their ‘parent’ CA or, if that is also missing, the missing value for both the CCG and CA is replaced by the value for England. Similarly, any missing values for STPs are replaced by the value for England.
For CCGs, there were 30,560 survival estimates produced for each of colorectal, lung and other cancers, one for each combination of age-group, sex, calendar year and CCG; there are 15,280 such estimates for breast cancer. The problem of not being able to produce robust estimates, requiring substitution, affected:
- 7,821 (25.6%) of the separate survival estimates for lung cancer
- 5,495 (18%) for colorectal cancer
- 28 (0.2%) for breast cancer
- 6 (0.0%) for other cancers
For STPs, there were 14,700 survival estimates produced for each of colorectal, lung and other cancers and 7,350 estimates for breast cancer. The problem of not being able to produce robust estimates, requiring substitution, affected:
- 1,460 (9.9%) of the separate survival estimates for lung cancer
- 311 (2.1%) for colorectal cancer
- 1 (0%) for breast cancer
It did not affect any of the estimates for other cancers.
For CAs, there were 7,000 survival estimates produced for each of colorectal, lung and other cancers and 3,500 estimates for breast cancer. The problem of not being able to produce robust estimates, requiring substitution, affected:
- 115 (1.6%) of the separate survival estimates for lung cancer
- 8 (0.1%) for colorectal cancer
It did not affect any of the estimates for breast cancer or other cancers.
5.5 Who uses these statistics and for what purpose?
In 2015, a 5-year cancer strategy for England was developed by the Independent Cancer Task Force. This set out recommendations for how the NHS can improve cancer outcomes for patients. The implementation of these recommendations is being monitored by government bodies.
Survival estimates are used to formulate, monitor and assess health policy and healthcare provision and planning. These index of cancer survival estimates feed into the CCG Outcomes Indicator Set (OIS), which ‘provides clear, comparative information for CCGs about the quality of health services and the associated health outcomes. The indicators measure outcomes at CCG level to help inform priority setting and drive local improvement. The CCG OIS does not set thresholds or levels of ambition’.
The CCG OIS also contributes to the NHS Outcomes Framework which focuses on measuring health outcomes and includes one-year and 5-year net survival from breast, colorectal, and lung cancers. The NHS Five Year Forward View (2014) set out ‘that improvements in outcomes will require action on 3 fronts: better preventions, swifter access to diagnosis, and better treatment and care for all those diagnosed with cancer’.
6. Links to other related statistics
Other statistics related to cancer are available in:
- Cancer survival in England provides national estimates of adult cancer survival for 29 cancer sites, including survival by stage at diagnosis where possible, and cancer survival for children
- Geographic patterns of cancer survival in England provides estimates of cancer survival for 14 cancer sites for CAs and STPs
- Cancer registration statistics, England provides the number of cancer diagnoses and age-standardised registration rate for all cancer sites
- information on the contents and uses of all the cancer publications in the article Cancer statistics explained: different data sources and when they should be used
The issue of comparability of cancer survival statistics across the UK has been discussed at the UK and Ireland Association of Cancer Registries (UKIACR) Executive Board, and a consensus has been made to use the International Cancer Survival Standard (ICSS) weights in cancer survival analysis in England, Scotland, Wales, Northern Ireland and the Republic of Ireland (as well as the same exclusions in data), so that results can be comparable across all countries in the UK and Ireland. Statistics on cancer around the UK are produced:
- in Scotland by the Scottish Cancer Registry and Intelligence Service
- in Wales by the Welsh Cancer Intelligence and Surveillance Unit
- in Northern Ireland by the Northern Ireland Cancer Registry
7. Authors
Responsible statistician: John Broggio
Production team: John Broggio, Bhavisha Hirani, Carolynn Gildea, Josephine French, Katherine Henson, Kwok Wong, Marta Emmett, Sophie Finnigan.
For queries relating to this bulletin contact ncrasenquiries@phe.gov.uk.
8. Acknowledgements
Data for this work is based on patient-level information collected by the NHS, as part of the care and support of cancer patients. The data is collated, maintained and quality assured by the National Cancer Registration and Analysis Service, PHE.
We would like to thank our colleagues in the Office for National Statistics, Andy Schofield, Leah Butler, Sarah Caul and Sophie John, for their advice and support in producing this release.
*[PSA]; prostate-specific antigen